Primerica, Inc. is a financial services provider serving middle-income households in the United States and Canada. The company operates through three main segments: Term Life Insurance, Investment and Savings Products, and Corporate and Other Distributed Products. It underwrites term life insurance policies and distributes mutual funds, annuities, managed investments, and other financial products, primarily on behalf of third parties. Key subsidiaries include Primerica Life Insurance Company, PFS Investments Inc., and Primerica Life Insurance Company of Canada. The company utilizes a distribution model based on a large network of independent sales representatives who meet with clients in person or via remote tools. Primerica was incorporated in 2009 and transferred its businesses from Citigroup, Inc. in 2010.

Summarised from the company's own disclosures, fiscal year ended Feb 2026

Industry Insurance - Life Homepage primerica.com
Sector Financial Services IR page investors.primerica.com
Tags
term life insurance, mutual funds, annuities, managed investments, independent sales force, middle-income households, financial needs analysis, debt resolution, retirement savings, Primerica Financial Services LLC, Primerica Life Insurance Company, PFS Investments Inc., National Benefit Life Insurance Company, Primerica Life Insurance Company of Canada, PFSL Investments Canada Ltd., PFSL Fund Management Ltd., Financial Needs Analysis tool
Press page —

Metrics

Valuation  
Market cap $ 9.026B
Market cap (USD) $ 9.026B
P/E 11.70
PEG 0.44
P/BV 3.19
P/S 2.58
P/OCF 9.21
P/FCF 10.31
Dividend yield 1.6%
Turnover / mcap —
Returns  
ROE 31.9%
ROI 17.8%
ROIC 17.8%
Profit margin 22.8%
Growth  
Revenue growing Yes
Profits growing Yes
Revenue up 3y Yes
Revenue up 5y Yes
Earnings growth 3y (net profit CAGR) 26.3%
Quality  
Profitable Yes
Margin expanding Yes
Buying back stock Yes
Diluting (TTM) No
Debt/Equity —
Podcast bulls (TTM) Sign up
Podcast bears (TTM) Sign up
Podcast sentiment (TTM) Sign up
Podcast sentiment % (TTM) Sign up
News sentiment (TTM) 16
Quality score 61.1%
Insiders  
Buys, 1w Sign up
Buys, 1m Sign up
Buys, 1y Sign up
Sells, 1w Sign up
Sells, 1m Sign up
Sells, 1y Sign up

Sign up to see this company's insider trades

Figure FY 2025 FY 2024 FY 2023 FY 2022 FY 2021 FY 2020 FY 2019 FY 2018 FY 2017 FY 2016 FY 2015 FY 2014 FY 2013 FY 2012 FY 2011 FY 2010 FY 2009
Revenue 3.292B 3.089B 2.816B 2.72B 2.71B 2.218B 2.053B 1.9B 1.689B 1.519B 1.405B 1.34B 1.267B 1.191B 1.103B 1.362B 2.22B
Net profit 751.234M 470.518M 576.601M 373.012M 373.357M 386.164M 366.391M 324.094M 350.255M 219.414M 189.871M 181.412M 162.725M 173.806M 178.276M 257.778M 494.589M
Free cash flow 875.126M 832.86M 658.62M 731.86M 632.268M — — — — — — — — — 83.989M 31.193M 711.45M

Figure FY 2025 FY 2024 FY 2023 FY 2022 FY 2021 FY 2020 FY 2019 FY 2018 FY 2017 FY 2016 FY 2015 FY 2014 FY 2013 FY 2012 FY 2011 FY 2010 FY 2009
Share price 258.36 271.42 205.76 141.82 153.27 133.93 130.56 97.71 101.55 69.15 47.23 54.26 42.91 30 23.36 22.1 —
Price performance 12m -0.05 0.32 0.45 -0.07 0.14 0.03 0.34 -0.04 0.47 0.46 -0.13 0.26 0.43 0.28 0.06 — —

Filed figures

Figure Dec 2016 Dec 2017 Dec 2018 Dec 2019 Dec 2020 Dec 2021 Dec 2022 Dec 2023 Dec 2024 Dec 2025
Balance sheet detail
Lease liabilities (USD) — — — 53.5M 52.8M 53.9M 46M 61.4M 55.5M 49.6M
Cash and deposits (USD) 212M 280M 262M 257M 548M 393M 489M 613M 688M 756M
Intangible assets (USD) 54.9M 51.5M 48.1M 45.3M 45.3M 196M 186M 175M 45.3M 45.3M
Right-of-use assets (USD) — — — 47.3M 46.6M 47.9M 40.5M 53.7M 47M 41.9M
Cash flow detail
Operating cash flow (USD) 292M 389M 478M 486M 643M 657M 758M 693M 862M 901M
Dividends paid (cash effect) (USD) -33.4M -35.8M -44.1M -57.6M -64.3M -74.6M -83.8M -93.7M -113M -136M
Share buybacks (cash effect) (USD) -150M -150M -210M -225M -231M -18.8M -356M -375M -428M -450M
Interest paid (cash effect) (USD) -28M -27.8M -27.9M -28.1M -27.9M -33.9M -27.1M -27.3M -24.2M -23.1M
Income taxes paid (cash effect) (USD) -45.4M -83.3M -88.3M -115M -123M -155M -178M -227M -140M -236M
Share-based compensation (USD) 13.4M 15.3M 17.3M 17.5M 19M 16.8M 22.4M 18.9M 25.1M 24.6M
Income detail
Total comprehensive income (USD) 237M 364M 252M 454M 457M 315M 43.3M 488M 709M 753M
Comprehensive income to owners (USD) — — — 454M 457M 316M 48.4M 488M 709M —
Reported Feb 27, 2017 Feb 26, 2018 Feb 26, 2019 Mar 1, 2022 Mar 1, 2022 Mar 1, 2022 Feb 28, 2023 Feb 28, 2024 Feb 28, 2025 Feb 27, 2026

Sign up to see institutional holdings

Sign Up

Podcast Mentions

Sign up to see podcast mentions and sentiment

Sign Up

On November 4, 2026, Primerica, Inc. (the “Company”) announced its results of operations for the quarter ended September 30, 2026. A copy of the press release is attached hereto as Exhibit 99.1.

Use of Non-GAAP Financial Measures. In addition to reporting financial results in accordance with U.S. generally accepted accounting principles (“GAAP”), the Company presents certain non-GAAP financial measures. Specifically, the Company presents adjusted direct premiums, other ceded premiums, adjusted operating revenues, adjusted operating income before income taxes, adjusted net operating income, diluted adjusted operating earnings per share and adjusted stockholders’ equity.

Adjusted direct premiums and other ceded premiums are net of amounts ceded under coinsurance transactions that were executed concurrent with our initial public offering (the “IPO coinsurance transactions”) for all periods presented. We exclude amounts ceded under the IPO coinsurance transactions in measuring adjusted direct premiums and other ceded premiums to present meaningful comparisons of the actual premiums economically maintained by the Company.

November 04, 2026 4:15pm EST Download as PDF

Related Documents

Earnings Webcast

Audio

Presentation

PDF

Financial Supplement

XLS

10-Q Filing

PDF

Key Financial Results

  • Total revenues of $902 million increased 7% compared to the third quarter of 2025
  • Net income of $209 million increased 1% year over year (YoY); net earnings per diluted share (EPS) of $6.76 increased 6% YoY, including a pre-tax remeasurement gain of $12 million versus a $23 million pre-tax remeasurement gain in the prior year period
  • Adjusted net operating income of $209 million increased 2% YoY; diluted adjusted operating EPS of $6.77 increased 7% YoY
  • Return on stockholders' equity (ROE) was 31.3%; adjusted net operating income return on adjusted stockholders' equity (ROAE) was 33.9%

Key Business Results

Term Life Insurance

  • Life-licensed sales force totaled 147,058 representatives at quarter end
  • Net premiums were consistent, while adjusted direct premiums increased 3% YoY
  • Issued Term Life face amount decreased 5% YoY to $25.7 billion

Investment and Savings Products (ISP)

  • ISP sales increased 19% YoY to $4.4 billion
  • Client asset values ended the quarter at $140 billion, up 10% YoY
  • Net inflows totaled $407 million during the quarter

Capital Management

  • Returned $159 million to stockholders during the quarter, including $122 million of share repurchases and $37 million of dividends paid
  • The Board of Directors approved a dividend of $1.20 per share payable on December 14, 2026 to stockholders of record on November 20, 2026
  • Primerica Life Insurance Company's estimated statutory risk-based capital ratio was approximately 445% as of September 30, 2026

DULUTH, Ga.--(BUSINESS WIRE)-- Primerica, Inc. (NYSE: PRI) reported financial results for the quarter ended September 30, 2026. The Company's financial results reflected continued momentum in its investment business, driven by strong client demand and expanded product offerings, while favorable equity market performance over the last year contributed to client asset value growth. The Term Life business continued to generate stable earnings and predictable cash flow, reflecting the Company’s large in-force block of term life insurance policies. Results included the impact of the annual actuarial assumption changes that are recognized in the third quarter.

"In the third quarter, Primerica’s financial performance underscored the consistency of our business fundamentals, driven by our unique operating model that is purpose-built to help middle-income families achieve financial security," said Glenn Williams, Chief Executive Officer. "Stable earnings in our Term Life segment and record investment sales continue to drive earnings momentum. These results reflect the dedication of our independent sales force and their commitment to helping families build a more secure future."

Third Quarter Distribution & Segment Results

Distribution Results
Q3 2026 Q3 2025 % Change
Life-Licensed Sales Force (1) 147,058 152,200 (3 )%
Recruits 90,818 101,156 (10 )%
New Life-Licensed Representatives 10,722 12,482 (14 )%
Life Productivity (2) 0.17 0.17 *
Issued Term Life Face Amount ($ billions) (3) $ 25.7 $ 27.1 (5 )%
Life Insurance Policies Issued 73,813 79,379 (7 )%
Client Asset Values ($ billions) (1) $ 139.6 $ 126.8 10 %
ISP Product Sales ($ billions) $ 4.4 $ 3.7 19 %
Closed U.S. Mortgage Volume ($ million brokered) $ 142.6 $ 143.4 (1 )%
(1) At period end
(2) Life productivity equals the average monthly policies issued divided by the average number of life insurance licensed representatives.
(3) Includes face amount on issued term life policies, additional riders added to existing policies and face increases under increasing benefit riders.
* Not calculated or less than 1%
Segment Results
Q3 2026 Q3 2025 % Change
($ in thousands)
Adjusted Operating Revenues:
Term Life Insurance $ 461,567 $ 463,301 *
Investment and Savings Products 378,026 318,788 19 %
Corporate and Other Distributed Products (1) 62,230 56,790 10 %
Total adjusted operating revenues (1) $ 901,823 $ 838,879 8 %
Adjusted Operating Income (Loss) before income taxes:
Term Life Insurance $ 152,693 $ 172,685 (12 )%
Investment and Savings Products 114,054 94,222 21 %
Corporate and Other Distributed Products (1) 5,334 3,799 41 %
Total adjusted operating income before income taxes (1) $ 272,081 $ 270,706 1 %
(1) See the Non-GAAP Financial Measures section and the Adjusted Operating Results reconciliation tables at the end of this release for additional information.
* Not calculated or less than 1%

Earnings Webcast Information

Primerica will hold a webcast on Thursday, November 5, 2026, at 10:00 a.m. (ET), to discuss the quarter’s results. To access the webcast, go to https://investors.primerica.com at least 15 minutes prior to the event to register, download and install any necessary software. A replay of the call will be available for approximately 30 days. This release and a detailed financial supplement will be posted on Primerica’s website.

Non-GAAP Financial Measures

In addition to reporting financial results in accordance with U.S. generally accepted accounting principles (GAAP), the Company presents certain non-GAAP financial measures. Specifically, the Company presents adjusted direct premiums, other ceded premiums, adjusted operating revenues, adjusted operating income before income taxes, adjusted net operating income, diluted adjusted operating earnings per share and adjusted stockholders' equity.

Adjusted direct premiums and other ceded premiums are net of amounts ceded under coinsurance transactions that were executed concurrent with our initial public offering (the IPO coinsurance transactions) for all periods presented. We exclude amounts ceded under the IPO coinsurance transactions in measuring adjusted direct premiums and other ceded premiums to present meaningful comparisons of the actual premiums economically maintained by the Company. Amounts ceded under the IPO coinsurance transactions will continue to decline over time as policies terminate within this block of business.

Adjusted operating revenues, adjusted operating income before income taxes, adjusted net operating income and diluted adjusted operating earnings per share exclude the impact of investment gains (losses), including credit impairments, and fair value mark-to-market (MTM) investment adjustments for all periods presented. We exclude investment gains (losses), including credit impairments, and MTM investment adjustments in measuring these non-GAAP financial measures to eliminate period-over-period fluctuations that may obscure comparisons of operating results due to items such as the timing of recognizing gains (losses) and market pricing variations prior to an invested asset’s maturity or sale that are not directly associated with the Company’s insurance operations.

Adjusted stockholders’ equity excludes the impact of net unrealized investment gains (losses) recorded in accumulated other comprehensive income (loss) for all periods presented. We exclude unrealized investment gains (losses) in measuring adjusted stockholders’ equity as unrealized gains (losses) from the Company’s available-for-sale securities are largely caused by market movements in interest rates and credit spreads that do not necessarily correlate with the cash flows we will ultimately realize when an available-for-sale security matures or is sold. Adjusted stockholders’ equity also excludes the difference in future policy benefits calculated using the current discount rate and future policy benefits calculated using the locked-in discount rate at contract issuance recognized in accumulated other comprehensive income (loss). We exclude the impact from the difference in the discount rate in measuring adjusted stockholders' equity as such difference is caused by market movements in interest rates that are not permanent and may not align with the cash flows we will ultimately incur when policy benefits are settled.

Our definitions of these non-GAAP financial measures may differ from the definitions of similar measures used by other companies. Management uses these non-GAAP financial measures in making financial, operating and planning decisions and in evaluating the Company’s performance. Furthermore, management believes that these non-GAAP financial measures may provide users with additional meaningful comparisons between current results and results of prior periods as they are expected to be reflective of the core ongoing business. These measures have limitations and users should not consider them in isolation or as a substitute for analysis of the Company’s results as reported under GAAP. Reconciliations of GAAP to non-GAAP financial measures are attached to this release.

Forward-Looking Statements

Except for historical information contained in this press release, the statements in this release are forward-looking and made pursuant to the safe harbor provisions of the Private Securities Litigation Reform Act of 1995. Forward-looking statements contain known and unknown risks and uncertainties that may cause our actual results in future periods to differ materially from anticipated or projected results. Those risks and uncertainties include, among others, our failure to continue to attract and license new recruits, retain independent sales representatives or license or maintain the licensing of independent sales representatives; laws or regulations that could apply to our distribution model, which could require us to modify our distribution structure; changes to the independent contractor status of sales representatives; our or independent sales representatives’ violation of or non-compliance with laws and regulations; litigation and regulatory investigations and actions concerning us or independent sales representatives; differences between our actual experience and our expectations regarding mortality, reinsurance, persistency, or disability as reflected in the pricing for our insurance policies; changes in federal, state and provincial legislation or regulation that affects our insurance, investment product and mortgage businesses; our failure to meet regulatory capital ratios or other minimum capital and surplus requirements; a significant downgrade by a ratings organization; the failure of our reinsurers or reserve financing counterparties to perform their obligations; the failure of our investment products to remain competitive with other investment options or the loss of our relationship with one or more of the companies whose investment products we provide; heightened standards of conduct or more stringent licensing requirements for independent sales representatives; inadequate policies and procedures regarding suitability review of client transactions; revocation of our subsidiary’s status as a non-bank custodian; a significant change to or disruption in the mortgage lenders’ mortgage businesses or an inability of the mortgage lenders to satisfy their contractual obligations to us; changes in prevailing mortgage interest rates or U.S. monetary policies that affect mortgage interest rates; economic downcycles that impact our business, financial condition and results of operations; major public health pandemics, epidemics or outbreaks or other catastrophic events; the failure of our or a third-party partner’s information technology systems, breach of our information security, failure of our business continuity plan or the loss of the Internet; any failure to protect the confidentiality of client information; the current legislative and regulatory climate with regard to privacy and cybersecurity; cyber-attack(s), security breaches; the development and use of artificial intelligence; the efficiency and success of business initiatives taken to enhance our technology, products and services; the effects of credit deterioration and interest rate fluctuations on our invested asset portfolio and other assets; incorrectly valuing our investments; changes in accounting standards may impact how we record and report our financial condition and results of operations; the inability of our subsidiaries to pay dividends or make distributions; laws and regulations in the U.S. and Canada, executive branch actions, orders and policies, judicial rulings and decisions by public officials impacting our business; the legislative and regulatory environment regarding climate change; litigation and regulatory investigations and actions; a significant change in the competitive environment in which we operate; the loss of key personnel or sales force leaders; inability to effectively execute our corporate strategy; and fluctuations in the market price of our common stock or Canadian currency exchange rates. These and other risks and uncertainties affecting us are more fully described in our filings with the Securities and Exchange Commission, which are available in the "Investor Relations" section of our website at https://investors.primerica.com . Primerica assumes no duty to update its forward-looking statements as of any future date.

About Primerica, Inc.

Primerica, Inc. is a leading diversified financial services distribution company serving middle-income households in the United States and Canada. Our licensed representatives educate families on how to prepare for a more secure financial future and help them achieve their financial goals with our term life insurance and third-party mutual funds, managed accounts, annuities, loans and other financial products. We insured over 5.5 million lives and had approximately 3.1 million client investment accounts as of December 31, 2025. Through our life insurance subsidiaries in North America, in 2025 Primerica was the #3 issuer of term life insurance, which we largely reinsure. Primerica stock is included in the S&P MidCap 400 and the Russell 1000 stock indices and is traded on The New York Stock Exchange under the symbol “PRI”. We are headquartered in Duluth, Georgia.

PRIMERICA, INC. AND SUBSIDIARIES
Condensed Consolidated Balance Sheets
(Unaudited)
September 30, 2026 December 31, 2025
(In thousands)
Assets
Investments:
Fixed-maturity securities available-for-sale, at fair value $ 3,281,333 $ 3,265,246
Fixed-maturity security held-to-maturity, at amortized cost 1,018,380 1,175,380
Equity securities, at fair value 28,770 26,433
Trading securities, at fair value 32,153 12,801
Policy loans and other invested assets 96,560 56,233
Total investments 4,457,196 4,536,093
Cash and cash equivalents 782,723 756,227
Accrued investment income 34,599 30,122
Reinsurance recoverables 2,287,256 2,564,952
Deferred policy acquisition costs, net 4,032,097 3,915,998
Agent balances, due premiums and other receivables 304,446 275,171
Intangible asset 45,275 45,275
Income taxes 139,269 177,302
Operating lease right-of-use assets 38,689 41,900
Other assets 254,037 387,776
Separate account assets 2,103,941 2,281,520
Total assets $ 14,479,528 $ 15,012,336
Liabilities and stockholders' equity
Liabilities:
Future policy benefits $ 6,286,925 $ 6,818,179
Unearned and advance premiums 15,720 15,521
Policy claims and other benefits payable 475,846 495,356
Other policyholders' funds 343,618 356,427
Note payable 595,917 595,315
Surplus note 1,018,167 1,175,119
Income taxes 64,913 147,960
Operating lease liabilities 45,574 49,565
Other liabilities 622,128 546,596
Payable under securities lending 80,185 84,876
Separate account liabilities 2,103,941 2,281,520
Total liabilities 11,652,934 12,566,434
Stockholders' equity:
Common stock 305 318
Retained earnings 2,527,210 2,416,149
Accumulated other comprehensive income (loss), net of income tax:
Effect of change in discount rate assumptions on the liability for future policy benefits 550,437 134,594
Unrealized foreign currency translation gains (losses) (31,065 ) (15,836 )
Net unrealized gains (losses) on available-for-sale securities (220,293 ) (89,323 )
Total stockholders' equity 2,826,594 2,445,902
Total liabilities and stockholders' equity $ 14,479,528 $ 15,012,336
PRIMERICA, INC. AND SUBSIDIARIES
Condensed Consolidated Statements of Income
(Unaudited)
Three months ended September 30,
2026 2025
(In thousands, except per-share amounts)
Revenues:
Direct premiums $ 876,839 $ 868,651
Ceded premiums (423,209 ) (414,104 )
Net premiums 453,630 454,547
Commissions and fees 386,717 325,490
Net investment income 45,740 42,431
Investment gains (losses) (169 ) 652
Other, net 15,736 16,732
Total revenues 901,654 839,852
Benefits and expenses:
Benefits and claims 167,452 172,152
Future policy benefits remeasurement (gain) loss (11,833 ) (23,114 )
Amortization of deferred policy acquisition costs 86,592 81,498
Sales commissions 210,916 174,688
Insurance expenses 70,357 64,131
Insurance commissions 6,070 5,499
Interest expense 5,750 5,985
Other operating expenses 94,438 87,334
Total benefits and expenses 629,742 568,173
Income before income taxes 271,912 271,679
Income taxes 62,785 64,886
Net income $ 209,127 $ 206,793
Earnings per share:
Basic earnings per share $ 6.77 $ 6.36
Diluted earnings per share $ 6.76 $ 6.35
Weighted-average shares used in computing earnings per share:
Basic 30,775 32,404
Diluted 30,820 32,451
PRIMERICA, INC. AND SUBSIDIARIES
Consolidated Adjusted Operating Results Reconciliation
(Unaudited)
Three months ended September 30,
2026 2025 % Change
(In thousands, except per-share amounts)
Total revenues $ 901,654 $ 839,852 7 %
Less: Investment (losses) gains (169 ) 652
Less: 10% deposit asset MTM included in NII - 321
Adjusted operating revenues $ 901,823 $ 838,879 8 %
Income before income taxes $ 271,912 $ 271,679 *
Less: Investment (losses) gains (169 ) 652
Less: 10% deposit asset MTM included in NII - 321
Adjusted operating income before income taxes $ 272,081 $ 270,706 *
Net Income $ 209,127 $ 206,793 1 %
Less: Investment (losses) gains (169 ) 652
Less: 10% deposit asset MTM included in NII - 321
Less: Tax impact of preceding items 39 (232 )
Adjusted net operating income $ 209,257 $ 206,052 2 %
Diluted earnings per share $ 6.76 $ 6.35 6 %
Less: Net after-tax impact of operating adjustments (0.01 ) 0.02
Diluted adjusted operating earnings per share $ 6.77 $ 6.33 7 %
* Not calculated or less than 1%
TERM LIFE INSURANCE SEGMENT
Adjusted Premiums Reconciliation
(Unaudited)
Three months ended September 30,
2026 2025 % Change
(In thousands)
Direct premiums $ 872,573 $ 864,047 *
Less: Premiums ceded to IPO coinsurers 173,221 185,392
Adjusted direct premiums 699,352 678,655 3 %
Ceded premiums (422,072 ) (412,935 )
Less: Premiums ceded to IPO coinsurers (173,221 ) (185,392 )
Other ceded premiums (248,851 ) (227,543 )
Net premiums $ 450,501 $ 451,112 *
* Not calculated or less than 1%
CORPORATE AND OTHER DISTRIBUTED PRODUCTS SEGMENT
Adjusted Operating Results Reconciliation
(Unaudited)
Three months ended September 30,
2026 2025 % Change
(In thousands)
Total revenues $ 62,061 $ 57,763 7 %
Less: Investment gains (losses) (169 ) 652
Less: 10% deposit asset MTM included in NII - 321
Adjusted operating revenues $ 62,230 $ 56,790 10 %
Income (loss) before income taxes $ 5,165 $ 4,772 *
Less: Investment gains (losses) (169 ) 652
Less: 10% deposit asset MTM included in NII - 321
Adjusted operating income (loss) before income taxes $ 5,334 $ 3,799 41 %
* Not calculated or less than 1%
PRIMERICA, INC. AND SUBSIDIARIES
Adjusted Stockholders' Equity Reconciliation
(Unaudited)
September 30, 2026 December 31, 2025 % Change
(In thousands)
Stockholders' equity $ 2,826,594 $ 2,445,902 16 %
Less: Net unrealized gains (losses) (220,293 ) (89,323 )
Less: Effect of change in discount rate assumptions on the liability for future policy benefits 550,437 134,594
Adjusted stockholders' equity $ 2,496,450 $ 2,400,631 4 %

View source version on businesswire.com: https://www.businesswire.com/news/home/20261104166978/en/

**Investor Contact:
**Nicole Russell
470-564-6663
Email: [email protected]

**Media Contact:
**Susan Chana
404-229-8302
Email: [email protected]

Source: Primerica, Inc.

Released November 4, 2026

©2026 Primerica, Inc. All Rights Reserved.

Privacy & Security Disclaimer Important disclosures Terms ADA Statement Sitemap

Primerica

By using this website, you agree to the use of cookies on your device to enhance site navigation, analyze site usage, and assist in optimizing your website experience. 

Learn More Close

Company Logo

About Cookies

When you visit any website, it may store or retrieve information on your browser, mostly in the form of cookies. This information might be about your web browsing preferences or your device, and is primarily used to make the site work as you expect it to. The information does not directly identify you, and it can give you a more personalized web experience. You may refuse to accept cookies by changing the settings on your browser. However, if you refuse to accept cookies, you may be unable to access certain parts of our Websites. Unless you have adjusted your browser settings to refuse cookies, our Websites may automatically issue cookies when you direct your browser to our Websites.
Visit Our Online Privacy Policy for More information

Strictly Necessary Cookies

Always Active

These cookies are necessary for the website to function and cannot be switched off in our systems. They are usually only set in response to actions made by you which amount to a request for services, such as setting your privacy preferences, logging in or filling in forms.    You can set your browser to block or alert you about these cookies, but some parts of the site will not then work. These cookies do not store any personally identifiable information.

Performance Cookies

Performance Cookies

These cookies allow us to count visits and traffic sources so we can measure and improve the performance of our site. They help us to know which pages are the most and least popular and see how visitors move around the site.    All information these cookies collect is aggregated and therefore anonymous. If you do not allow these cookies we will not know when you have visited our site, and will not be able to monitor its performance.

Targeting Cookies

Targeting Cookies

These cookies may be set through our site by our advertising partners. They may be used by those companies to build a profile of your interests and show you relevant adverts on other sites.    They do not store directly personal information, but are based on uniquely identifying your browser and internet device. If you do not allow these cookies, you will experience less targeted advertising.

Back Button

Cookie List

Search Icon

Filter Icon

Clear

checkbox label label

Apply Cancel

Consent Leg.Interest

checkbox label label

checkbox label label

checkbox label label

Close Window

Powered by Onetrust

October 29, 2026 12:00am EDT Download as PDF

DULUTH, Ga.--(BUSINESS WIRE)-- The latest Primerica Household Budget Index™ (HBI™) data, a monthly economic metric that examines how inflation and wage trends impact the ability of middle-income families to afford life’s everyday necessities, is estimated at 100.0% in September, a decrease of 0.6% from August and down 0.4% from a year ago.

This press release features multimedia. View the full release here: https://www.businesswire.com/news/home/20261028610055/en/

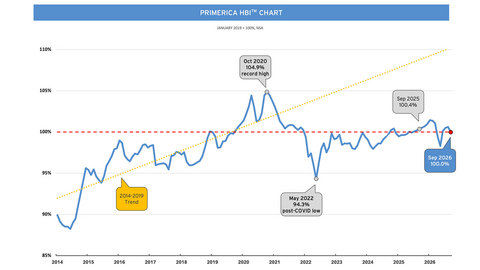
The latest Primerica Household Budget Index™ (HBI™) data, a monthly economic metric that examines how inflation and wage trends impact the ability of middle-income families to afford life’s everyday necessities, is estimated at 100.0% in September, a decrease of 0.6% from August and down 0.4% from a year ago. Gas prices and home heating fuel costs rose sharply in September and were the primary drivers for the decline in spending power for middle-income households. Average earned income was up 0.2% month-over-month and increased 3.3% year-over-year.

The latest Primerica Household Budget Index™ (HBI™) data, a monthly economic metric that examines how inflation and wage trends impact the ability of middle-income families to afford life’s everyday necessities, is estimated at 100.0% in September, a decrease of 0.6% from August and down 0.4% from a year ago. Gas prices and home heating fuel costs rose sharply in September and were the primary drivers for the decline in spending power for middle-income households. Average earned income was up 0.2% month-over-month and increased 3.3% year-over-year.

Gas prices and home heating fuel costs rose sharply in September and were the primary drivers for the decline in spending power for middle-income households. Average earned income was up 0.2% month-over-month and increased 3.3% year-over-year.

The Consumer Price Index (CPI), which measures inflation for a comprehensive basket of goods for all U.S. households, increased 3.7% in September compared to a year ago. The cost of necessity items as used in the HBI™ metric (food, utilities, gas, auto insurance, and health care) for middle-income Americans is up 4.5% from a year ago.

About the Primerica Household Budget Index™ (HBI™) Data

The Primerica Household Budget Index™ (HBI™) data is constructed monthly on behalf of Primerica by its chief economic consultant Amy Crews Cutts, PhD, CBE®. The index measures the purchasing power of middle-income families with household incomes from $30,000 to $130,000 and is developed using data from the U.S. Bureau of Labor Statistics, the U.S. Bureau of Census, and the Federal Reserve Bank of Kansas City. The index looks at the cost of necessities including food, gas, auto insurance, utilities, and health care and earned income to track differences in inflation and wage growth.

Primerica’s HBI™ metric was created to fill an information void around the economy’s impact on middle-income families. Metrics like the Consumer Price Index (CPI) measure overall inflation but don’t offer a clear picture of how it impacts middle-income Americans. Middle-income households play a key role in driving consumer spending and the overall economy as they account for over 55% of the U.S. population. The purchasing power of middle-income families are a key barometer of real-time economic trends. Understanding middle-income households’ purchasing power is important because it shows whether they are gaining financial ground or falling behind.

The HBI™ data uses January 2019 as its baseline, with the value set to 100% at that point in time.

Periodically, prior HBI™ values may be modified due to revisions in the CPI series and Consumer Expenditure Survey releases by the U.S. Bureau of Labor Statistics (BLS). Beginning with the December 2024 release of the index, the expenditure weights have been updated to the most recent (Q1 2024) data and auto insurance has been added to the group of necessity items. For more information, visit householdbudgetindex.com .

About Primerica, Inc.

Primerica, Inc. is a leading diversified financial services distribution company serving middle-income households in the United States and Canada. Our licensed representatives educate families on how to prepare for a more secure financial future and help them achieve their financial goals with our term life insurance and third-party mutual funds, managed accounts, annuities, loans and other financial products. We insured over 5.5 million lives and had approximately 3.1 million client investment accounts as of December 31, 2025. Through our life insurance subsidiaries in North America, in 2025 Primerica was the #3 issuer of term life insurance, which we largely reinsure. Primerica stock is included in the S&P MidCap 400 and the Russell 1000 stock indices and is traded on The New York Stock Exchange under the symbol “PRI”. We are headquartered in Duluth, Georgia.

View source version on businesswire.com: https://www.businesswire.com/news/home/20261028610055/en/

Media Contact:
Gana Ahn
678-431-9266
Email: [email protected]

Investor Contact:
Nicole Russell
470-564-6663
Email: [email protected]

Source: Primerica, Inc.

Released October 29, 2026

©2026 Primerica, Inc. All Rights Reserved.

Privacy & Security Disclaimer Important disclosures Terms ADA Statement Sitemap

Primerica

By using this website, you agree to the use of cookies on your device to enhance site navigation, analyze site usage, and assist in optimizing your website experience. 

Learn More Close

Company Logo

About Cookies

When you visit any website, it may store or retrieve information on your browser, mostly in the form of cookies. This information might be about your web browsing preferences or your device, and is primarily used to make the site work as you expect it to. The information does not directly identify you, and it can give you a more personalized web experience. You may refuse to accept cookies by changing the settings on your browser. However, if you refuse to accept cookies, you may be unable to access certain parts of our Websites. Unless you have adjusted your browser settings to refuse cookies, our Websites may automatically issue cookies when you direct your browser to our Websites.
Visit Our Online Privacy Policy for More information

Strictly Necessary Cookies

Always Active

These cookies are necessary for the website to function and cannot be switched off in our systems. They are usually only set in response to actions made by you which amount to a request for services, such as setting your privacy preferences, logging in or filling in forms.    You can set your browser to block or alert you about these cookies, but some parts of the site will not then work. These cookies do not store any personally identifiable information.

Performance Cookies

Performance Cookies

These cookies allow us to count visits and traffic sources so we can measure and improve the performance of our site. They help us to know which pages are the most and least popular and see how visitors move around the site.    All information these cookies collect is aggregated and therefore anonymous. If you do not allow these cookies we will not know when you have visited our site, and will not be able to monitor its performance.

Targeting Cookies

Targeting Cookies

These cookies may be set through our site by our advertising partners. They may be used by those companies to build a profile of your interests and show you relevant adverts on other sites.    They do not store directly personal information, but are based on uniquely identifying your browser and internet device. If you do not allow these cookies, you will experience less targeted advertising.

Back Button

Cookie List

Search Icon

Filter Icon

Clear

checkbox label label

Apply Cancel

Consent Leg.Interest

checkbox label label

checkbox label label

checkbox label label

Close Window
Powered by Onetrust

Prompts

Primerica, Inc. (ticker PRI), listed in United States.

ETFs Holding Primerica, Inc.

ETF Weight in ETF Shares Market value As of
SOVF 2.76% 7,544 $ 2.414M Jul 31, 2026
OSCV 2.50% 55,114 $ 17.634M Jul 31, 2026
RUNN 1.68% 24,251 $ 6.976M Aug 31, 2026
WBIF 1.64% 1,355 $ 385.091K Jun 30, 2026
BCFN 1.40% 2,279 $ 647.692K Jun 30, 2026
WBIG 1.09% 1,052 $ 298.978K Jun 30, 2026
SDVD 0.93% 28,963 $ 8.562M Nov 11, 2026
FFSM 0.78% 36,299 $ 11.614M Jul 31, 2026
SMDX 0.50% 2,146 $ 634.014K Nov 17, 2026
WTV 0.48% 49,399 $ 14.039M Jun 30, 2026
HSMV 0.41% 76 $ 22.453K Nov 16, 2026
SIXL 0.40% 2,888 $ 843.18K Nov 12, 2026
SMIZ 0.39% 3,726 $ 1.072M Aug 31, 2026
VFQY 0.36% 6,412 $ 1.844M Aug 31, 2026
GOP 0.29% 865 $ 255.556K Nov 17, 2026
AVMV 0.26% 7,314 $ 2.161M Nov 16, 2026
BAMD 0.26% 880 $ 253.132K Aug 31, 2026
VFMF 0.25% 8,455 $ 2.432M Aug 31, 2026
GVLU 0.23% 2,054 $ 606.834K Nov 17, 2026
AVLV 0.21% 163,849 $ 48.408M Nov 16, 2026
EBI 0.21% 4,991 $ 1.436M Aug 31, 2026
DFAS 0.17% 200,370 $ 58.5M Nov 12, 2026
AVMC 0.12% 2,317 $ 684.534K Nov 16, 2026
BDVL 0.11% 6,403 $ 1.892M Nov 16, 2026
AVIE 0.11% 62 $ 18.317K Nov 16, 2026
AVSU 0.10% 1,613 $ 476.545K Nov 16, 2026
AVUQ 0.09% 1,236 $ 365.164K Nov 16, 2026
JMEE 0.07% 7,163 $ 2.126M Nov 17, 2026
DXUV 0.07% 14,000 $ 4.087M Nov 12, 2026
AVUS 0.06% 28,027 $ 8.28M Nov 16, 2026
DFSU 0.05% 4,500 $ 1.314M Nov 12, 2026
MSSM 0.05% 1,299 $ 373.657K Aug 31, 2026
AVLC 0.05% 2,887 $ 852.935K Nov 16, 2026
DFAC 0.04% 124,639 $ 36.39M Nov 12, 2026
SFGV 0.04% 1,674 $ 500K Nov 18, 2026
DCOR 0.04% 58,810 $ 17.17M Nov 12, 2026
FTLS short -0.03% -2,981 $ 0.00 Nov 16, 2026
VSLU 0.03% 525 $ 149.205K Jun 30, 2026
DFAU 0.02% 8,223 $ 2.401M Nov 12, 2026
DFUS 0.01% 9,527 $ 2.782M Nov 12, 2026
MSLC 0.01% 1,254 $ 360.713K Aug 31, 2026