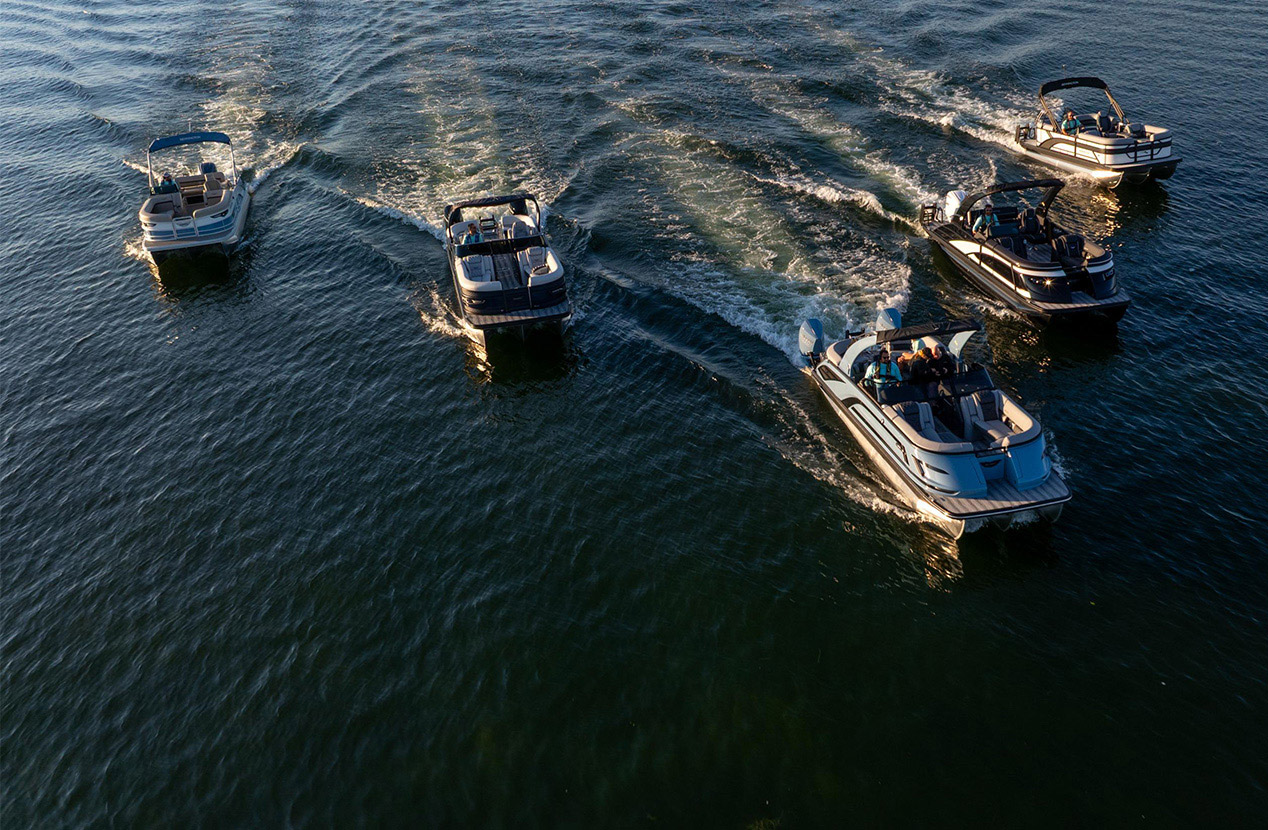
Polaris Inc. designs, engineers, manufactures, and markets powersports vehicles, including off-road vehicles (ORVs), snowmobiles, moto-roadsters, and boats. The company operates through three business segments: Off Road, On Road, and Marine. Its Off Road segment includes all-terrain vehicles (ATVs), side-by-side vehicles, and commercial and government/defense vehicles, featuring brands such as RZR, RANGER, GENERAL, XPEDITION, Sportsman, and ProXD. The On Road segment offers the Slingshot three-wheeled roadster and Goupil electric vehicles. The Marine segment includes Bennington pontoons, Hurricane deck boats, and Godfrey pontoons. Polaris also sells parts, garments, and accessories (PG&A) under brands like Kolpin, Pro Armor, Klim, 509, and Trail Tech. Products are sold through independent dealers and distributors in North America, Western Europe, Australia, Mexico, and over 90 other countries. The company was formed in 1994 as the successor to Polaris Industries Partners LP, with business operations beginning in 1954. Polaris partners with Qmerit for home charging solutions and offers ride experiences through Polaris Adventures.

Summarised from the company's own disclosures, fiscal year ended Feb 2026

Industry Auto Manufacturers Homepage polaris.com
Sector Consumer Cyclical IR page ir.polaris.com/home/default.aspx
Tags
off-road vehicles, snowmobiles, side-by-side vehicles, all-terrain vehicles, moto-roadsters, pontoons, deck boats, electric vehicles, military vehicles, commercial vehicles, powersports accessories, rider apparel, RZR, RANGER, GENERAL, XPEDITION, Sportsman, ProXD, DAGOR, MRZR, Slingshot, Goupil, Bennington, Hurricane, Godfrey, Kolpin, Pro Armor, Klim, 509, Trail Tech, Apex Product Group, Polaris Adventures, Qmerit
Press page polaris.com/en-us/news

Metrics

Valuation  
Market cap $ 2.967B
Market cap (USD) $ 2.967B
P/E -14.13
PEG —
P/BV 3.51
P/S 0.39
P/OCF 6.31
P/FCF 11.18
Dividend yield 0.08%
Turnover / mcap —
Returns  
ROE -44.0%
ROI -19.6%
ROIC -11.0%
Profit margin -6.5%
Growth  
Revenue growing No
Profits growing No
Revenue up 3y No
Revenue up 5y No
Earnings growth 3y (net profit CAGR) —
Quality  
Profitable No
Margin expanding No
Buying back stock No
Diluting (TTM) Yes
Debt/Equity 186.5%
Podcast bulls (TTM) Sign up
Podcast bears (TTM) Sign up
Podcast sentiment (TTM) Sign up
Podcast sentiment % (TTM) Sign up
News sentiment (TTM) 47
Quality score -61.1%
Insiders  
Buys, 1w Sign up
Buys, 1m Sign up
Buys, 1y Sign up
Sells, 1w Sign up
Sells, 1m Sign up
Sells, 1y Sign up

Sign up to see this company's insider trades

Figure FY 2025 FY 2024 FY 2023 FY 2022 FY 2021 FY 2020 FY 2019 FY 2018 FY 2017 FY 2016 FY 2015 FY 2014 FY 2013 FY 2012 FY 2011 FY 2010 FY 2009 FY 2008 FY 2007 FY 2006 FY 2005 FY 2004 FY 2003 FY 2002 FY 2001 FY 2000
Revenue 7.152B 7.175B 8.934B 8.589B 8.198B 7.028B 6.783B 6.079B 5.428B 4.517B 4.719B 4.48B 3.777B 3.21B 2.657B 1.991B 1.566B 1.948B 1.78B 1.657B 1.87B 1.773B 1.606B 1.521B 1.512B 1.426B
Net profit -465.5M 110.8M 502.8M 447.1M 493.9M 124.8M 323.96M 335.257M 172.492M 212.948M 455.361M 454.029M 377.292M 312.31M 227.575M 147.138M 101.017M 117.395M 111.65M 106.985M 143.278M 104.504M 110.929M 103.592M 91.414M 82.809M
Free cash flow 558.1M 6.5M 513.2M 202M -4.6M 804.7M 403.662M 251.698M 395.592M 362.646M 190.746M 324.191M 240.839M 313.027M 218.046M 241.901M 149.269M 99.179M 146.411M 92.987M 71.758M 157.992M 94.329M 136.196M 134.599M 44.61M

Figure FY 2025 FY 2024 FY 2023 FY 2022 FY 2021 FY 2020 FY 2019 FY 2018 FY 2017 FY 2016 FY 2015 FY 2014 FY 2013 FY 2012 FY 2011 FY 2010 FY 2009 FY 2008 FY 2007 FY 2006 FY 2005 FY 2004 FY 2003 FY 2002 FY 2001 FY 2000
Share price 63.25 57.62 94.77 101 109.91 95.28 101.7 76.68 123.99 82.39 85.95 151.24 145.64 84.15 56 78.16 43.55 28.48 50.1 43.92 — — — — — —
Price performance 12m 0.1 -0.39 -0.06 -0.08 0.15 -0.06 0.33 -0.38 0.5 -0.04 -0.43 0.04 0.73 0.5 -0.28 0.79 0.53 -0.43 0.14 — — — — — — —

Filed figures

Figure Dec 2016 Dec 2017 Dec 2018 Dec 2019 Dec 2020 Dec 2021 Dec 2022 Dec 2023 Dec 2024 Dec 2025
Balance sheet detail
Trade receivables (USD) 175M 200M 197M 190M 257M 241M 343M 306M 192M 238M
↳ YoY growth +16.0% +14.5% -1.5% -3.4% +35.1% -6.5% +42.6% -10.7% -37.2% +23.5%
↳ 5y CAGR +8.7% +10.8% +1.1% -1.5% +11.3% +6.6% +11.4% +9.2% +0.2% -1.6%
Borrowings, current (USD) 3.85M 47.7M 66.5M 167M 142M 553M 554M 54M 434M 34.8M
Borrowings, non-current (USD) 1.14B 865M 1.9B 1.53B 1.31B 1.25B 1.5B 1.85B 1.64B 1.5B
Lease liabilities (USD) — — 16.1M 129M 143M 181M 123M 155M 137M 133M
Cash and deposits (USD) 127M 138M 161M 157M 635M 509M 325M 368M 288M 138M
Intangible assets (USD) 371M 347M 871M 830M 686M 646M 524M 512M 543M 451M
Right-of-use assets (USD) — — — 110M 125M 165M 111M 144M 127M 121M
Net debt (borrowings + leases - cash) (USD) 1.01B 775M 1.8B 1.67B 959M 1.47B 1.86B 1.7B 1.92B 1.53B
Cash flow detail
Operating cash flow (USD) 572M 580M 477M 655M 1.02B 294M 509M 926M 268M 741M
Purchases of property, plant and equipment (USD) -209M -184M -225M -251M -214M -298M -307M -413M -262M -183M
Purchases of intangible assets (USD) — — — — — — 0.00 0.00 -62.7M 0.00
Change in receivables (cash effect) (USD) 2.03M -17.1M 20.7M 6.81M -56.2M -200,000 -123M 49M 103M -34.1M
Change in inventories (cash effect) (USD) 112M -27M -150M -150M -44.9M -503M -391M 115M 39.5M 184M
Change in payables (cash effect) (USD) -62.7M 39.5M -984,000 104M 327M 27.1M 71.7M -144M -142M 197M
Dividends paid (cash effect) (USD) -140M -145M -149M -149M -153M -153M -150M -147M -148M -150M
Share buybacks (cash effect) (USD) -246M -90.5M -349M -8.38M -50.3M -462M -505M -179M -82.7M -2.4M
Interest paid (cash effect) (USD) -15.8M -30.9M -51M -77M -67M -44.8M -71.2M -121M -142M -126M
Income taxes paid (cash effect) (USD) -127M -46.3M -74M -87.8M -65.5M -124M -194M -187M -124M -47.2M
Share-based compensation (USD) 57.9M 50.1M 64M 75M 65.3M 60.6M 62.9M 57.4M 49.2M 59.9M
Operating cash flow before change in receivables (USD) 570M 597M 456M 648M 1.07B 294M 631M 877M 165M 775M
Free cash flow (OCF - PPE - intangibles) (USD) 363M 396M 252M 404M 805M -4.6M 202M 513M -56.2M 558M
Income detail
Research and development expense (USD) 185M 238M 260M 293M 296M 337M 367M 374M 337M 372M
↳ 5y CAGR +11.9% +13.3% +13.3% +14.6% +12.2% +12.7% +9.0% +7.6% +2.8% +4.7%
Total comprehensive income (USD) 192M 211M 318M 315M 139M 475M 438M 533M 43.2M -371M
Comprehensive income to owners (USD) 192M 211M 318M 315M 139M 475M 437M 533M 42.8M -372M
Reported Feb 16, 2017 Feb 15, 2018 Oct 22, 2019 Feb 14, 2020 Feb 16, 2021 Feb 15, 2022 Feb 18, 2025 Feb 18, 2025 Feb 18, 2025 Feb 13, 2026

Sign up to see institutional holdings

Sign Up

Podcast Mentions

Sign up to see podcast mentions and sentiment

Sign Up

October 30, 2026

All-New Polaris-Engineered RZR Pro R Factory Boost Delivers 400 Horsepower and Purpose-Built Enhancements for Open Desert Racing, Joining the RZR Pro R Factory in Polaris' Race Machine Lineup Available for Purchase

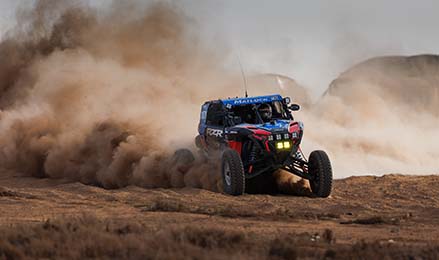
MINNEAPOLIS, Oct. 30, 2026 /PRNewswire/ -- Polaris  and RZR Factory Racing today unveiled the all-new RZR Pro R Factory Boost at the company's annual Camp RZR event at Glamis Imperial Sand Dunes. Delivering up to 400 horsepower, the RZR Pro R Factory Boost is designed and developed by Polaris engineers and built in Roseau, Minnesota, bringing a bigger, stronger and even more capable package to the race-proven platform.
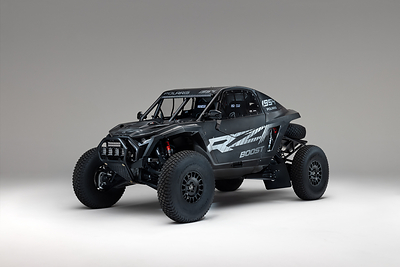
Delivering up to 400 horsepower, the RZR Pro R Factory Boost is designed and developed by Polaris engineers and built in Roseau, Minnesota, bringing a bigger, stronger and even more capable package to off-road desert racing.

Joining rather than replacing the existing Gen 2 RZR Pro R Factory, the new model gives racers another purpose-built option with a different level of performance and capability. Together, the two platforms strengthen Polaris' race vehicle lineup and its commitment to delivering race-ready side-by-sides designed to rule every race.

The RZR Pro R Factory Boost builds on the foundation established by the recently introduced production RZR Pro R Boost while incorporating proven components and lessons learned from the Gen 2 RZR Pro R Factory. Engineered specifically for competition, the new race machine further refines power delivery, chassis design, cooling and suspension to meet the demands of high-speed desert racing.

"The Gen 2 RZR Pro R Factory has proven itself as the benchmark in the side-by-side category and demonstrated our ability to compete among the best, beating all other UTVs in virtually every major offroad race in the world. With the RZR Pro R Factory Boost, we're building on that success with a clear goal: to keep pushing the boundaries of performance and give our team and customers every advantage to continue winning at the highest level," said Alex Scheuerell, Polaris' Director of Off-Road Motorsports. "Desert racing demands strength, speed and durability across hundreds of miles, and we've engineered this platform to take on the next level of competition. We're ready to put it to the test and push for results that reflect the ambition of our team."

The RZR Pro R Factory Boost includes the following race modifications:

  • Turbocharged Power – A race-tuned, turbocharged ProStar Fury 2.0L four-cylinder engine delivers up to 400 horsepower for commanding holeshots, high-speed passes, and the power to attack demanding terrain.
  • Performance Race-Spec Chassis – The reinforced chassis features a wheelbase extended by 6.5 inches to a total of 111 inches, for greater straight-line stability and control over rough terrain. Increased tubing size across key structural members adds strength and stiffness to support higher speeds and the demands of desert racing.
  • Competition-Ready Cockpit and Cage – Redesigned with driver feedback in mind, the all-new cage design delivers added strength, while a cab that's two inches wider provides more cockpit space for improved comfort and legroom. The expanded design transforms the feel from a traditional side-by-side to a purpose-built race car.
  • Full Carbon Fiber Bodywork with Aerodynamic Design – Sculpted carbon fiber bodywork and an arched roofline reduce weight and improve aerodynamic efficiency at high speeds. Polaris engineers used computational fluid dynamics (CFD) to model airflow at speeds exceeding 100 mph, informing the cage shape and redesigned rear body profile to optimize airflow and support high-speed desert racing performance.
  • Upgraded Fuel System – A 45-gallon (170-liter) fuel cell increases capacity over the previous-generation RZR Pro R Factory's 34-gallon system, extending its range beyond 200 miles to reduce pit stops.
  • MoTeC Components – The fully integrated MoTeC electronics package features an upgraded M150 ECU and dual power distribution modules, adding a second PDM over the Gen 2 RZR Pro R Factory for expanded power distribution and control capabilities.
  • Race-Tuned DYNAMIX DV Suspension – Three-inch internal bypass DYNAMIX DV Live Valve shocks feature race-specific components and upgraded one-inch shock shafts for increased strength and a broader dynamic range. Race-specific tuning maintains control across changing terrain, while a standard FOX steering damper absorbs large impacts to improve steering control and driver confidence at high speeds.

The RZR Pro R Factory Boost is available to order now in limited quantities through SCI Distribution, LLC, an exclusive distributor, with the first order window closing February 15, 2027. Starting at $200,000 US MSRP, the new race machine will be offered alongside the continued availability of the championship-proven RZR Pro R Factory, giving racers two platforms to choose from based on their performance needs and racing goals. Polaris will produce the RZR Pro R Factory Boost with SCI managing the sales and post-sale customer support process.

For the complete list of race-focused upgrades and technical specifications, or to submit an inquiry for purchase, visit https://www.polaris.com/en-us/off-road/rzr/models/rzr-pro-r-factory-boost/  

The RZR Factory Racing team will debut the new RZR Pro R Factory Boost race machine at the 2027 King of The Hammers event, competing in multiple races.

To learn more about Polaris and the production RZR Pro R Boost, please visit Polaris.com/RZR  or join the conversation and follow on Facebook sm, Instagram sm,  YouTube sm and X sm.

**About Polaris
**As the global leader in powersports, Polaris Inc. (NYSE: PII) has been defining and redefining outdoor adventure since 1954. Polaris delivers industry-shaping off-road vehicles, snowmobiles, boats, military, quadricycles, and commercial transportation vehicles, along with an expansive portfolio of parts, garments, and accessories. Its lineup includes some of the most iconic brands in powersports including the RANGER, RZR, Polaris XPEDITION, Bennington pontoons, Slingshot, and more. Headquartered in Minnesota and serving customers in nearly 100 countries, Polaris continues to set the standard for performance, quality, and unmatched service. Explore more at www.polaris.com .

Polaris RZR

Cision View original content to download multimedia:https://www.prnewswire.com/news-releases/polaris-and-rzr-factory-racing-unveil-all-new-rzr-pro-r-factory-boost-race-machine-302921842.html

SOURCE Polaris Inc.

View All News

Investor Contact

J.C. Weigelt
Vice President – Investor Relations

[email protected]

Visit Linkedin    Visit X (Formally Twitter)    Visit Facebook    Visit Youtube    Visit Instagram    

Quick Links

Email Alerts

Personal Information.

Email Address *Required Email Address is required. Email Address is invalid.

Investor Alert Options *

  • News
  • Quarterly Reports
  • Annual Reports
  • SEC Filings
  • End of Day Stock Quote
  • Events & Presentations

Investor Alert Options is required.

The captcha test has failed. Please try again. Submit

Unsubscribe

Company name, logo

© 2026 Polaris Inc. - All rights reserved

Powered By Q4 Inc. 5.191.0.1 (opens in new window)

Polaris Declares Regular Cash Dividend Bull 0 Bear 0 Capital return

October 29, 2026

MINNEAPOLIS, Oct. 29, 2026 /PRNewswire/ -- Polaris Inc. (NYSE: PII) announced today that its Board of Directors has declared a regular quarterly cash dividend of $0.68 per share payable on December 15, 2026 to shareholders of record at the close of business on December 1, 2026.

(PRNewsfoto/Polaris Inc.)

About Polaris As the global leader in powersports, Polaris Inc. (NYSE: PII) has been defining and redefining outdoor adventure since 1954. Polaris delivers industry-shaping off-road vehicles, snowmobiles, boats, military, quadricycles, and commercial transportation vehicles, along with an expansive portfolio of parts, garments, and accessories. Its lineup includes some of the most iconic brands in powersports including the RANGER, RZR, Polaris XPEDITION, Bennington pontoons, Slingshot, and more. Headquartered in Minnesota and serving customers in nearly 100 countries, Polaris continues to set the standard for performance, quality, and unmatched service. Explore more at www.polaris.com .

Cision View original content to download multimedia:https://www.prnewswire.com/news-releases/polaris-declares-regular-cash-dividend-302924308.html

SOURCE Polaris Inc.

View All News

Investor Contact

J.C. Weigelt
Vice President – Investor Relations

[email protected]

Visit Linkedin    Visit X (Formally Twitter)    Visit Facebook    Visit Youtube    Visit Instagram    

Quick Links

Email Alerts

Personal Information.

Email Address *Required Email Address is required. Email Address is invalid.

Investor Alert Options *

  • News
  • Quarterly Reports
  • Annual Reports
  • SEC Filings
  • End of Day Stock Quote
  • Events & Presentations

Investor Alert Options is required.

The captcha test has failed. Please try again. Submit

Unsubscribe

Company name, logo

© 2026 Polaris Inc. - All rights reserved

Powered By Q4 Inc. 5.191.0.1 (opens in new window)

Third Quarter 2026 Earnings Results Bull 5 Bear 0 Results

October 27, 2026

FINANCIAL AND OPERATIONAL HIGHLIGHTS

•Third quarter sales were $2,043 million, up 11 percent compared to last year driven by strength across all major product lines within Polaris Powersports and Marine.

•Third quarter reported diluted earnings per share was $0.66; adjusted diluted earnings per share was $1.08.

•Third quarter market share gains in off-road vehicles (ORV), our sixth straight quarter of share gains, and Marine.

•Polaris Utility ORV retail sales for the quarter, excluding Youth, were up six percent versus last year. ORV retail sales were up two percent, excluding Youth.

•The Company's third quarter results include $10 million of tariff refunds, which benefited adjusted EPS by $0.13.

•Polaris is raising full year 2026 guidance to adjusted EPS of $3.50 to $3.60 from $3.00 to $3.10.

KEY FINANCIAL DATA

(in millions, except per share data)

Quarter ended September 30, 2026 Reported YOY % Chg. Adjusted* YOY % Chg.

Sales $ 2,042.6 11% $ 2,041.8 11%

Gross profit margin 21.2 % +52 bps 21.2 % +53 bps

Total operating expenses $ 375.5 (1)%

Net income attributable to Polaris $ 38.4 NM $ 63.1 171%

Net income attributable to Polaris margin . . . . . .

Prompts

Polaris Inc. (ticker PII), listed in United States.

Company History

Date Change Detail
Jul 29, 2019 Renamed POLARIS INDUSTRIES INC/MN → POLARIS INC.

ETFs Holding Polaris Inc.

ETF Weight in ETF Shares Market value As of
ARWG 2.28% 5,210 $ 336.253K Aug 31, 2026
FFLS short -1.19% -8,000 $ -516.32K Aug 31, 2026
SMIZ 0.54% 23,022 $ 1.486M Aug 31, 2026
PAPI 0.49% 28,814 $ 1.972M Jun 30, 2026
FSEV 0.47% 455 $ 31.14K Jun 30, 2026
SEIS 0.41% 34,887 $ 2.388M Jun 30, 2026
CGMM 0.38% 210,858 $ 13.689M Nov 16, 2026
AVUV 0.38% 1,876,482 $ 121.821M Nov 16, 2026
FSCC 0.29% 16,418 $ 1.06M Aug 31, 2026
MKTN 0.26% 3,992 $ 273.212K Jun 30, 2026
GVLU 0.22% 9,031 $ 586.293K Nov 17, 2026
PSC 0.22% 73,805 $ 5.051M Jun 30, 2026
AVSC 0.21% 101,325 $ 6.578M Nov 16, 2026
OASC 0.20% 2,983 $ 192.523K Aug 31, 2026
SAGP 0.20% 2,246 $ 153.716K Jun 30, 2026
FSEG 0.18% 152 $ 10.403K Jun 30, 2026
SQLV 0.17% 699 $ 47.84K Jun 30, 2026
RESM 0.15% 78 $ 5,338.32 Jun 30, 2026
DFAS 0.08% 430,639 $ 27.858M Nov 12, 2026
FSML 0.08% 1,520 $ 104.029K Jun 30, 2026
VFMF 0.08% 12,198 $ 787.259K Aug 31, 2026
SMDX 0.06% 1,184 $ 76.865K Nov 17, 2026
VFQY 0.05% 4,084 $ 263.581K Aug 31, 2026
AVSU 0.04% 2,753 $ 178.725K Nov 16, 2026
DXUV 0.03% 30,068 $ 1.945M Nov 12, 2026
AVUS 0.03% 56,460 $ 3.665M Nov 16, 2026
SFGV 0.02% 3,288 $ 210K Nov 18, 2026
DFSU 0.02% 5,726 $ 370.415K Nov 12, 2026
DFAC 0.02% 204,722 $ 13.243M Nov 12, 2026
MSSM 0.01% 1,443 $ 93.131K Aug 31, 2026
DCOR 0.01% 64,007 $ 4.141M Nov 12, 2026
DFAU 0.01% 14,308 $ 925.585K Nov 12, 2026
DFUS 0.01% 16,720 $ 1.082M Nov 12, 2026
DFUV 0.00% 6,986 $ 451.924K Nov 12, 2026