Projeto Cine Petrobras leva cinema gratuito a 10 estados do Brasil Carreta itinerante com apresentações gratuitas de filmes passará por 30 cidades brasileiras Autor: Agência Petrobras Postado em 11/03/2026 send e-mail Share Facebook Share Twitter…
Projeto Cine Petrobras leva cinema gratuito a 10 estados do Brasil
Carreta itinerante com apresentações gratuitas de filmes passará por 30 cidades brasileiras
Autor: Agência Petrobras
Postado em 11/03/2026
send e-mail
Share Facebook
Share Twitter
Share to WhatsApp
Copiar texto Projeto Cine Petrobras leva cinema gratuito a 10 estados do Brasil
Texto copiado!
# Patrocínio
# Patrocínio Cultural
# Cultura
# Cinema
# Projeto Cine Petrobras
# Cinema Brasileiro
Divulgação

De março a junho, a carreta do projeto Cine Petrobras 2026 segue uma jornada do Nordeste até o Sul, começando em Paracuru, no Ceará
Download De março a junho, a carreta do projeto Cine Petrobras 2026 segue uma jornada do Nordeste até o Sul, começando em Paracuru, no Ceará
Uma carreta que se transforma em sala de cinema de alta tecnologia levará cultura e diversão gratuitamente a 30 cidades de 10 estados do Brasil. De março a junho, a carreta do projeto Cine Petrobras 2026 segue uma jornada do Nordeste até o Sul, começando em Paracuru, no Ceará. A iniciativa, 100% gratuita para a população, é aprovada pelo Ministério da Cultura e viabilizada pela Lei de Incentivo à Cultura, com patrocínio da Petrobras, execução da Cepar Comunicação e apoio das prefeituras dos municípios.
“A Petrobras tem uma trajetória histórica de apoio ao cinema brasileiro, pois acredita no poder da cultura como instrumento de transformação social. O Cine Petrobras amplia esse compromisso ao levar gratuitamente a experiência do cinema a cidades e bairros que muitas vezes não contam com salas de exibição. Uma iniciativa que aproxima as pessoas da cultura e forma novos públicos”, destaca Milton Bittencourt, Gerente de Patrocínio Cultural da Petrobras.
Os estados contemplados pelo projeto são Ceará, Rio Grande do Norte, Paraíba, Pernambuco, Sergipe, Bahia, Espírito Santo, Rio de Janeiro, São Paulo e Rio Grande do Sul (veja a programação completa abaixo). O projeto teve início nos dias 05 e 06 de março, com a instalação da carreta e exibição de filmes na cidade de Paracuru, no Ceará.
A carreta, que para dois dias em cada cidade contemplada, transforma-se numa sala de cinema climatizada com poltronas confortáveis, sistema de som e imagem digitais, e cabine de distribuição de pipoca e refrigerante. Durante o dia, quatro sessões gratuitas e previamente agendadas são direcionadas exclusivamente a escolas e instituições públicas da localidade. À noite, o atrativo são sessões gratuitas e abertas ao público, com distribuição de ingressos na carreta no dia. Também há recursos de acessibilidade audiovisual e espaço para cadeirantes.
Compromisso com o cinema brasileiro
A iniciativa soma-se a muitos outros projetos apoiados pela Petrobras voltados à produção e à difusão do cinema no Brasil. Ao longo de mais de 30 anos, a empresa já patrocinou cerca de 600 filmes nacionais, entre eles clássicos como “Carlota Joaquina, Princesa do Brazil”, “Cidade de Deus”, “Tieta do Agreste”, “Carandiru”, “O Quatrilho”, “Bacurau” e o celebrado filme “O Agente Secreto”, de Kléber Mendonça Filho, que neste ano concorre ao Oscar.
A companhia também mantém iniciativas especiais como o Sessão Vitrine Petrobras, que periodicamente leva filmes novos e restaurados a cinemas de mais de 20 cidades brasileiras, em sessões com preços reduzidos. Além disso, apoia importantes mostras e festivais de audiovisual no país, como o Festival de Cinema de Gramado, Bonito Cine Sur, Mostra de Cinema em São Paulo, Mostra de Cinema de Tiradentes, Mostra de Cinema de Gostoso, e patrocina o Espaço Petrobras de Cinema, um dos cinemas mais emblemáticos de São Paulo.
Programação – Cine Petrobras 2026 Cidade Datas
Paracuru, CE 5 e 6 de março (Já realizado)
Caucaia, CE 9 e 10 de março (Já realizado)
Pecém (São Gonçalo do Amarante), CE 12 e 13 de março
Macau, RN 17 e 18 de março
Assú, RN 20 e 21 de março
Montadas, PB 25 e 26 de março
Santa Rita, PB 30 e 31 de março
Bayeux, PB 1 e 2 de abril
Cabo de Santo Agostinho, PE 6 e 7 de abril
Ipojuca, PE 9 e 10 de abril
Japaratuba, SE 13 e 14 de abril
Estância, SE 17 e 18 de abril
Entre Rios, BA 20 e 21 de abril
Alagoinhas, BA 23 e 24 de abril
Valença, BA 28 e 29 de abril
Itamaraju, BA 3 e 4 de maio
Linhares, ES 7 e 8 de maio
Anchieta, ES 11 e 12 de maio
Itapemirim, ES 14 e 15 de maio
Quissamã, RJ 18 e 19 de maio
Macaé, RJ 21 e 22 de maio
Arraial do Cabo, RJ 25 e 26 de maio
Itaboraí, RJ 28 e 29 de maio
Magé, RJ 1 e 2 de junho
Duque de Caxias, RJ 4 e 5 de junho
Vila Emir, SP 9 e 10 de junho
Esteio, RS 17 e 18 de junho
Camaquã, RS 22 e 23 de junho
São Lourenço do Sul, RS 25 e 26 de junho
São José do Norte, RS 29 e 30 de junho
00:00
;
Notas
Fotos
X


Foto: 1 /6
Projeto Cine Petrobras leva cinema gratuito a 10 estados do Brasil
11/03/2026
Por: Cepar
Baixar
O uso deste material é autorizado apenas para fins editoriais.
send e-mail
Share to WhatsApp
X

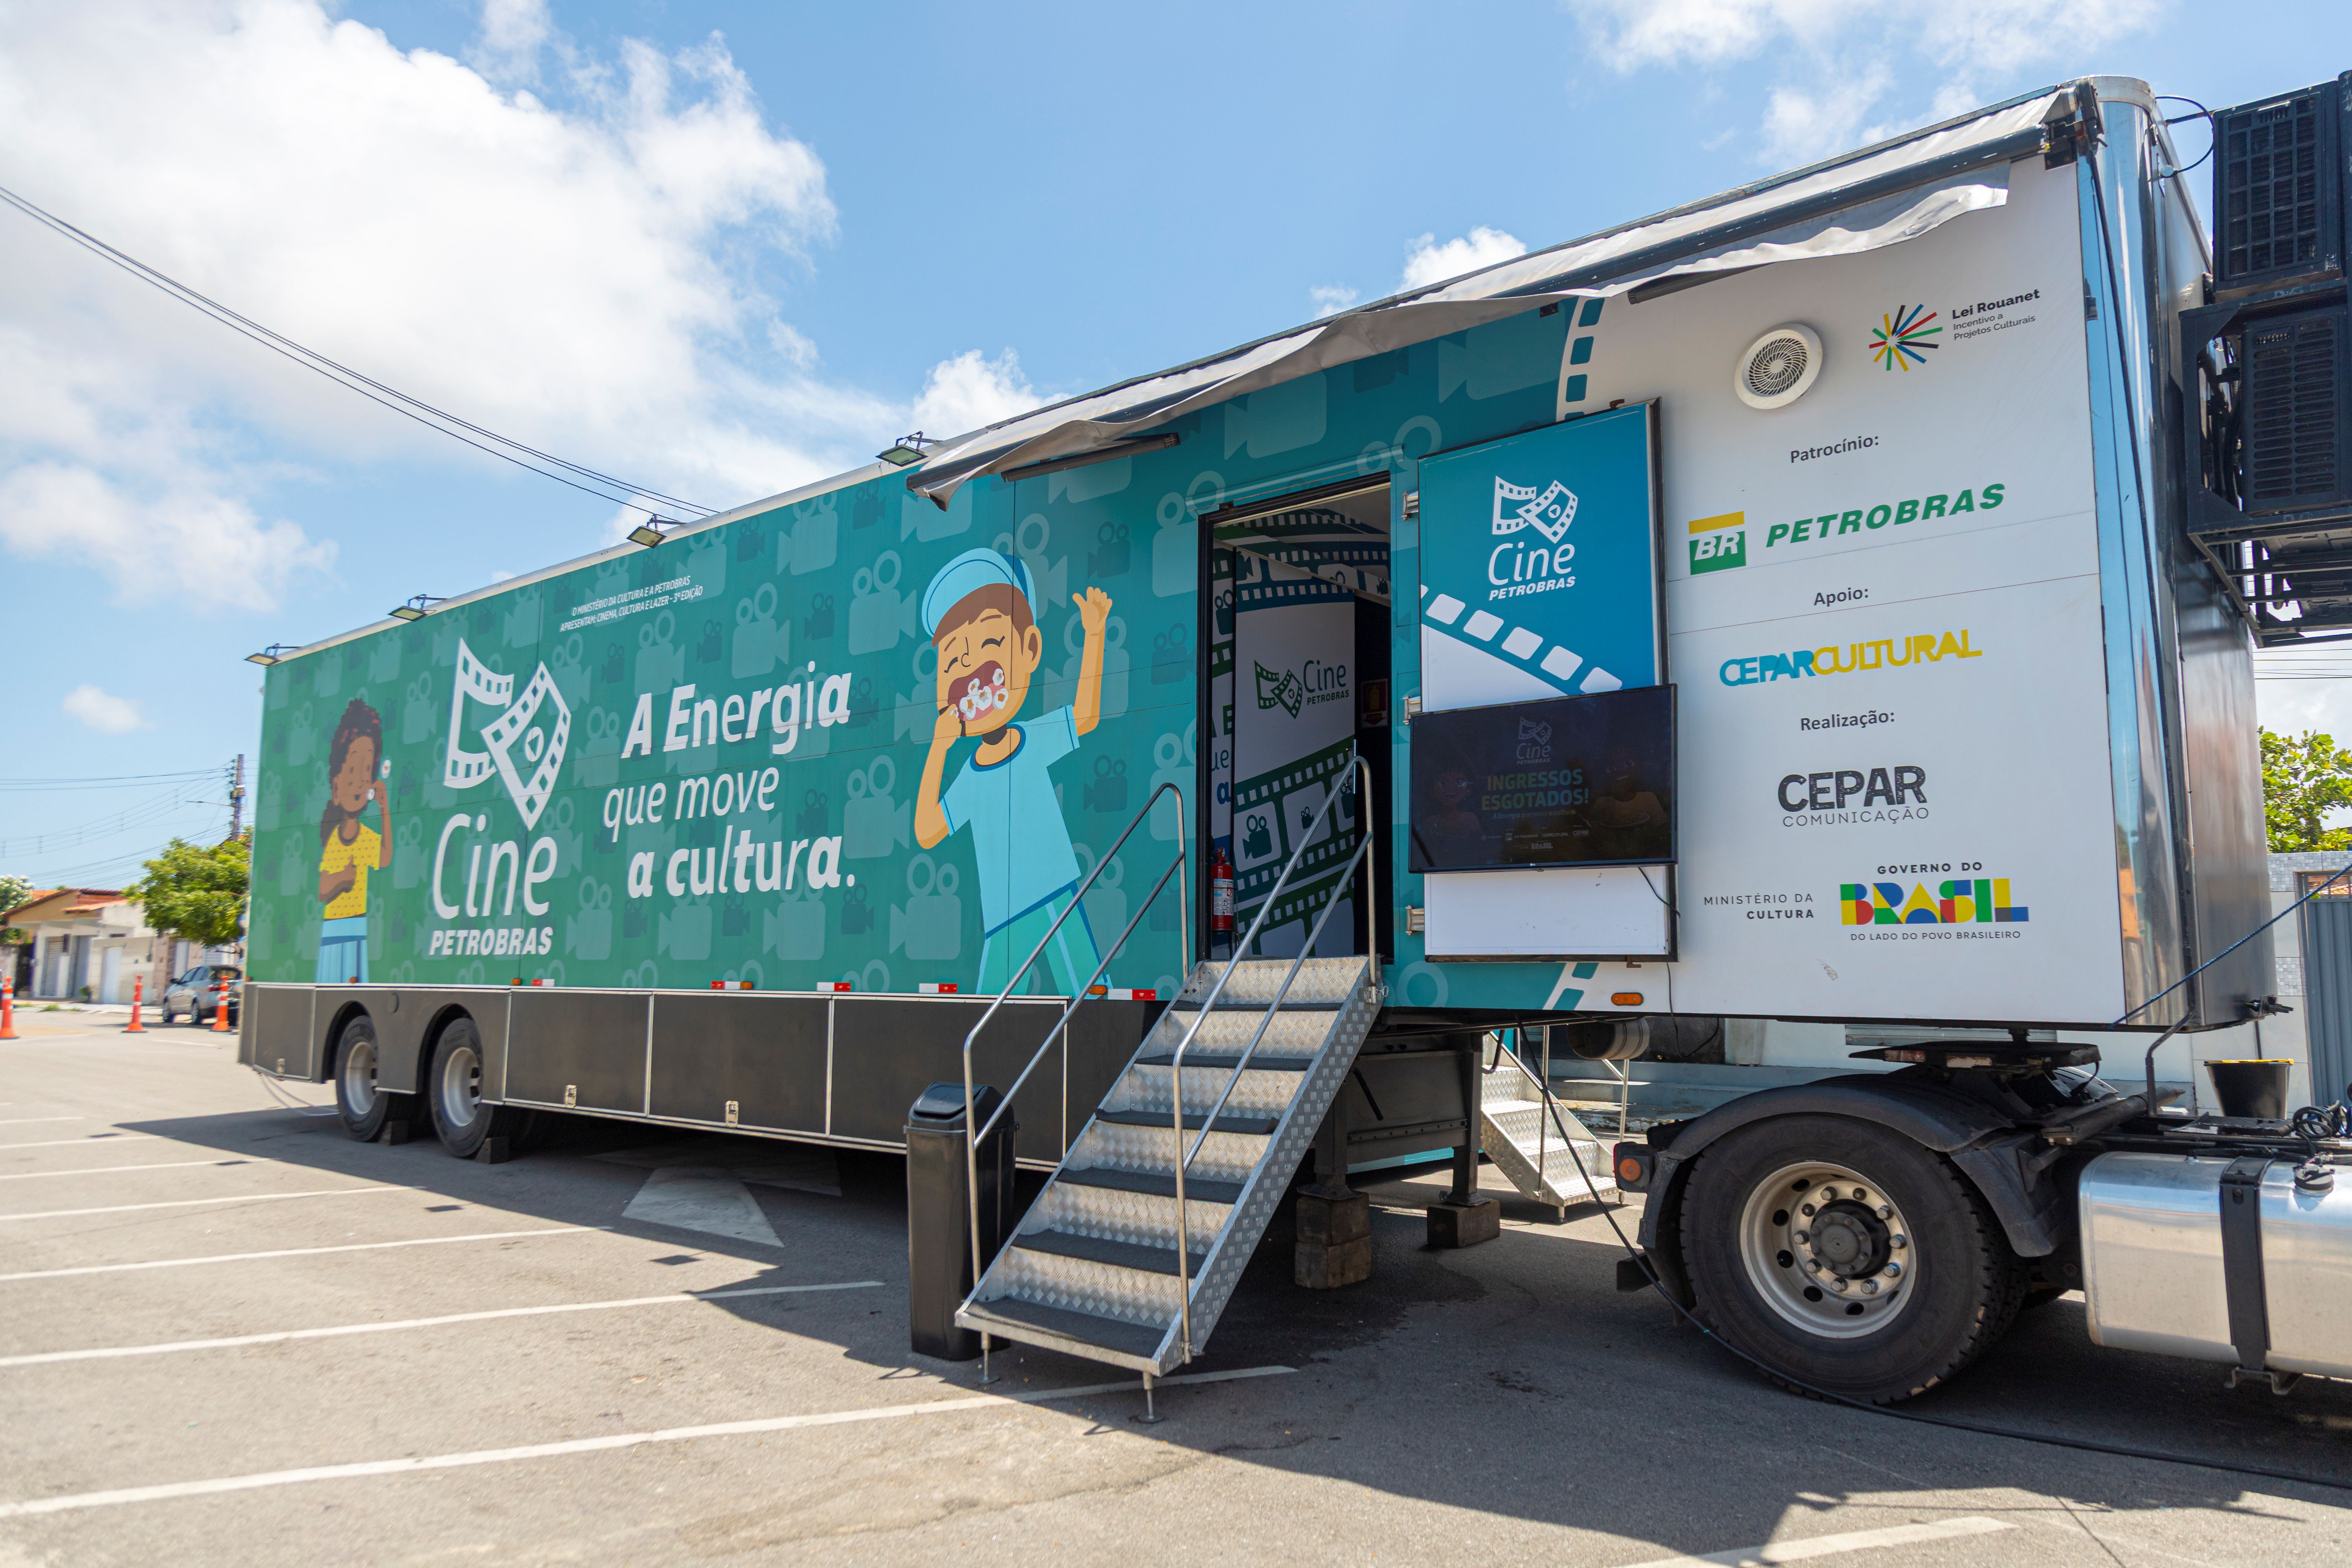
Foto: 2 /6
Projeto Cine Petrobras leva cinema gratuito a 10 estados do Brasil
11/03/2026
Por: Cepar
Baixar
O uso deste material é autorizado apenas para fins editoriais.
send e-mail
Share to WhatsApp
X


Foto: 3 /6
Projeto Cine Petrobras leva cinema gratuito a 10 estados do Brasil
11/03/2026
Por: Cepar
Baixar
O uso deste material é autorizado apenas para fins editoriais.
send e-mail
Share to WhatsApp
X

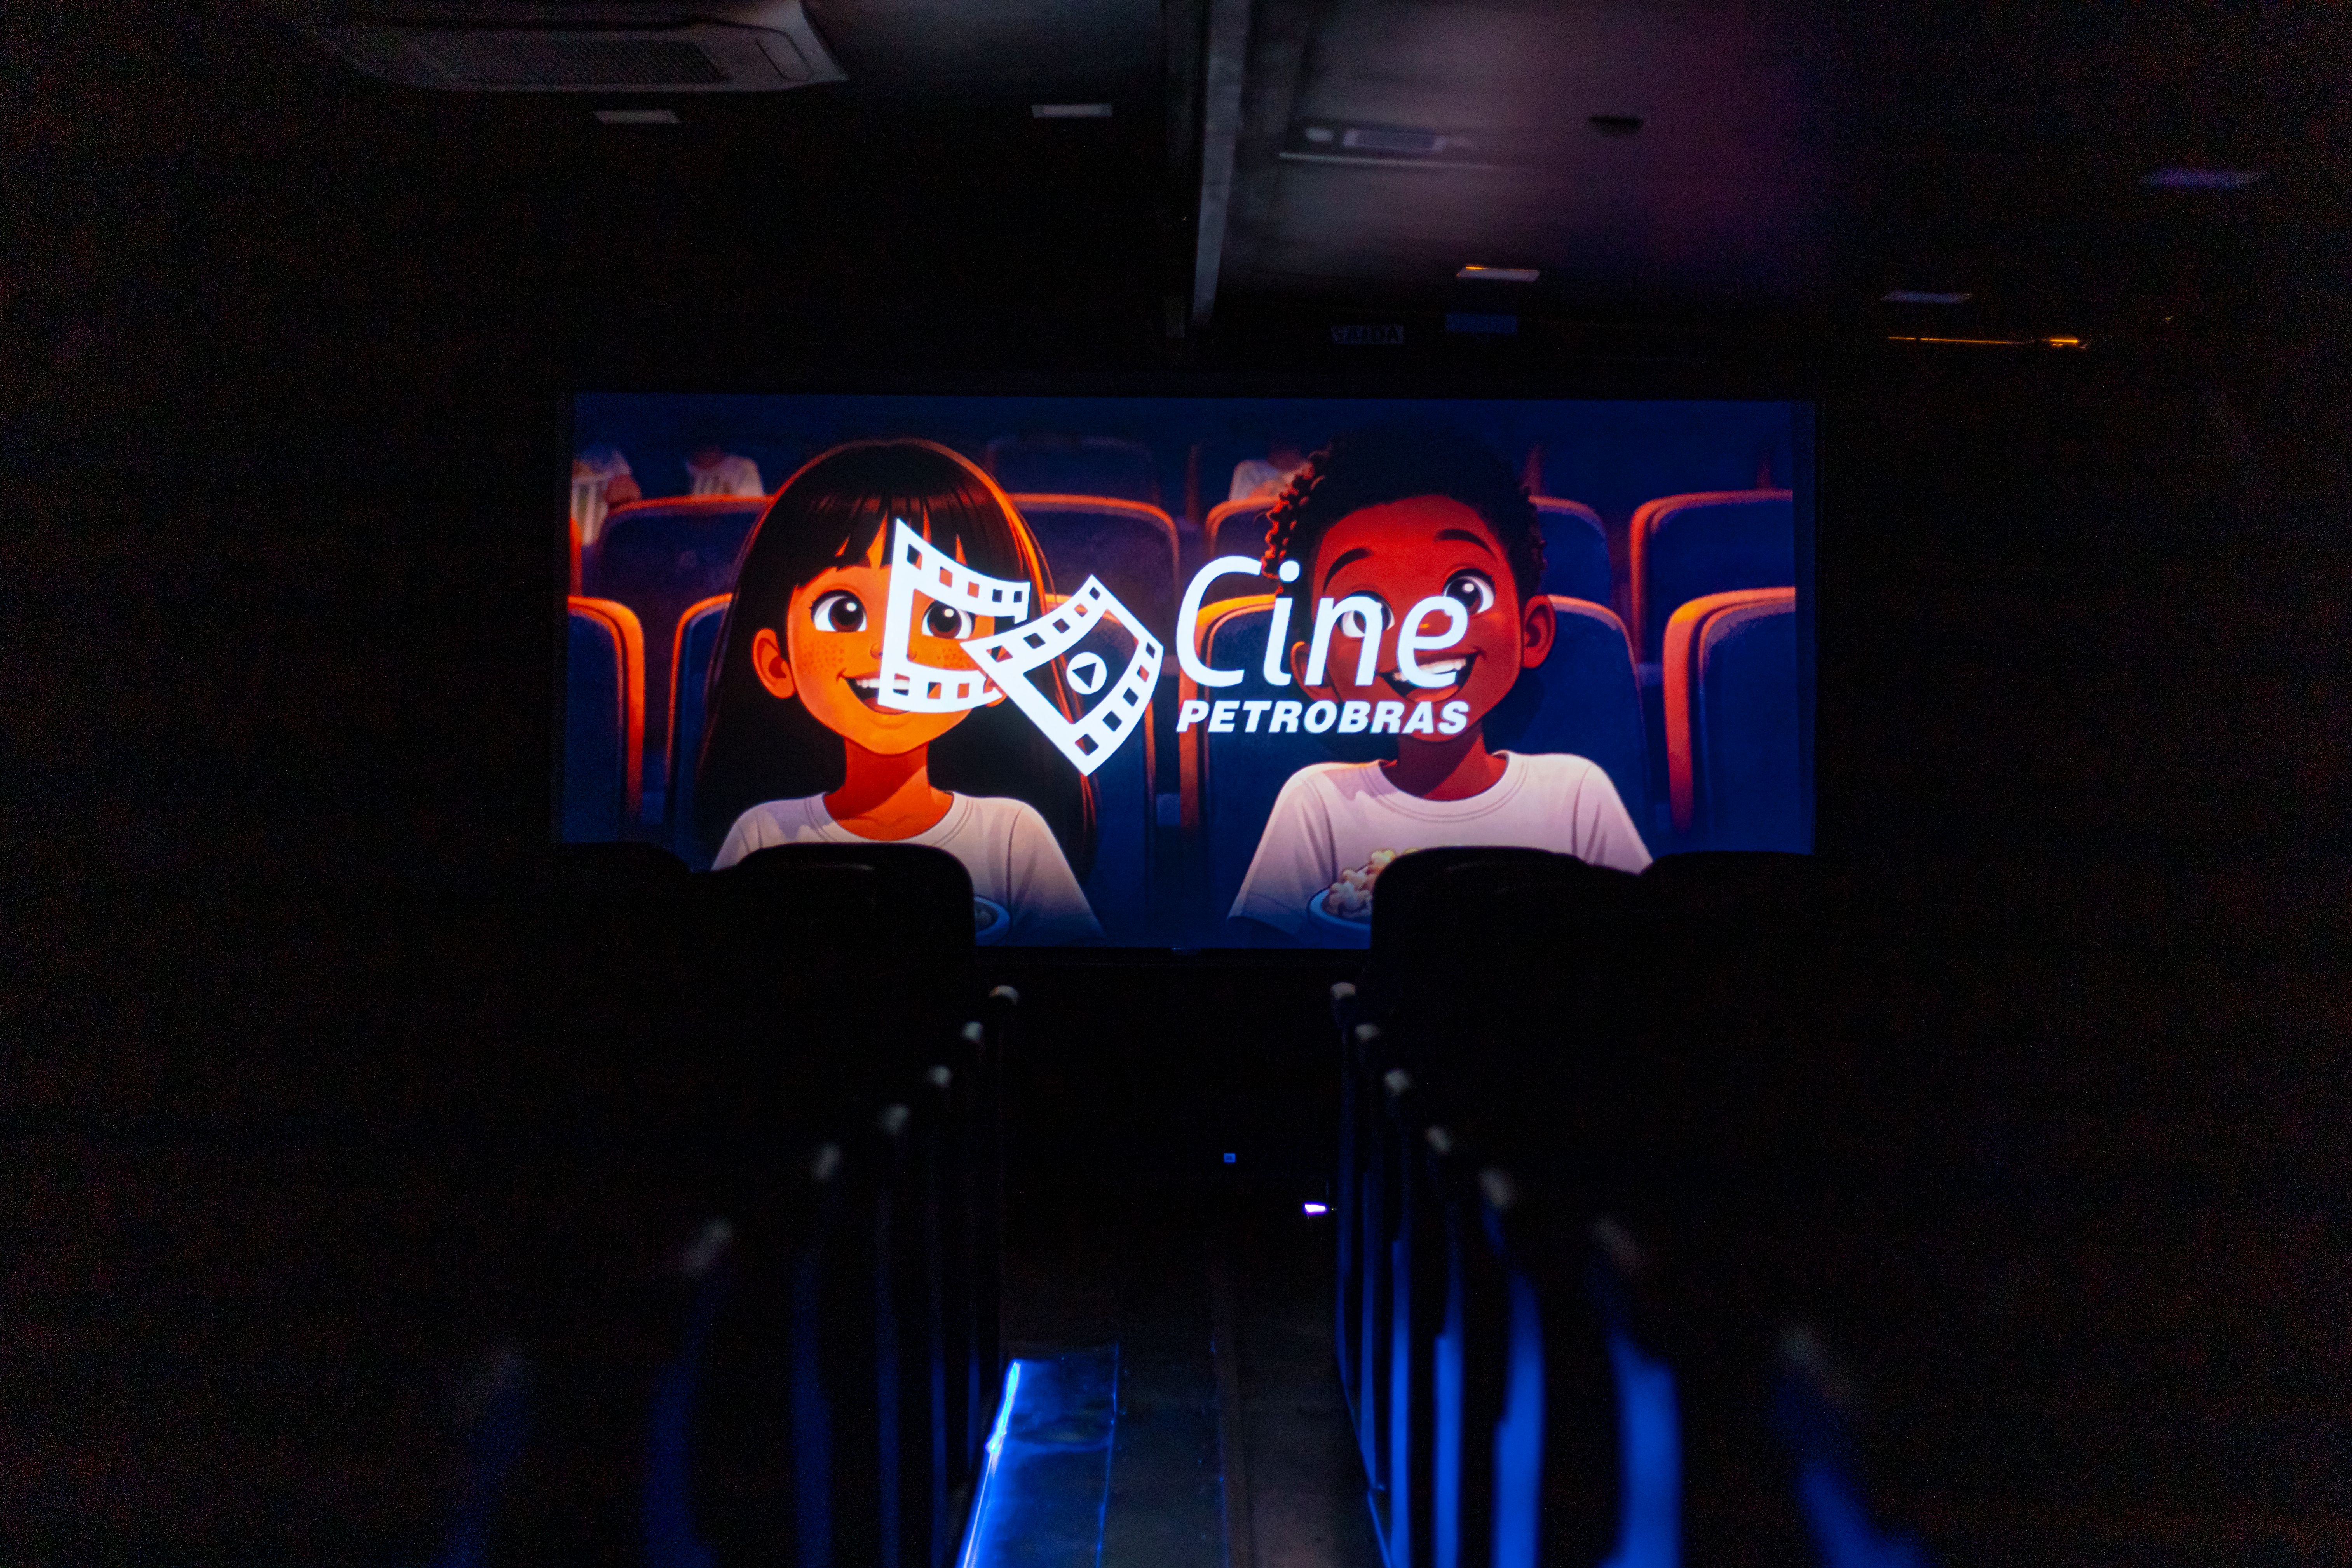
Foto: 4 /6
Projeto Cine Petrobras leva cinema gratuito a 10 estados do Brasil
11/03/2026
Por: Cepar
Baixar
O uso deste material é autorizado apenas para fins editoriais.
send e-mail
Share to WhatsApp
X


Foto: 5 /6
Projeto Cine Petrobras leva cinema gratuito a 10 estados do Brasil
11/03/2026
Por: Cepar
Baixar
O uso deste material é autorizado apenas para fins editoriais.
send e-mail
Share to WhatsApp
X


Foto: 6 /6
Projeto Cine Petrobras leva cinema gratuito a 10 estados do Brasil
11/03/2026
Por: Cepar
Baixar
O uso deste material é autorizado apenas para fins editoriais.
send e-mail
Share to WhatsApp
Downloads
Texto desta matéria
Download do texto
Fotos desta matéria
Download das fotos
Vídeos desta matéria
Você pode se interessar por
Time Petrobras encerra Jogos Olímpicos de Paris com medalhas em 7 categorias
Time Petrobras encerra Jogos Olímpicos de Paris com medalhas em 7 categorias
Continuar lendo
Projeto Cine Petrobras leva cinema gratuito a 10 estados do Brasil
Projeto Cine Petrobras leva cinema gratuito a 10 estados do Brasil
Continuar lendo
Petrobras lança segunda edição da Seleção de Jornalismo com bolsas de R$ 20 mil
Petrobras lança segunda edição da Seleção de Jornalismo com bolsas de R$ 20 mil
Continuar lendo
Petrobras alcança R$ 800 bilhões em valor de mercado e renova máxima histórica na B3
Petrobras alcança R$ 800 bilhões em valor de mercado e renova máxima histórica na B3
Continuar lendo
Petrobras patrocina inauguração do primeiro Museu da Cultura Hip Hop da América Latina, em Porto Alegre
Petrobras patrocina inauguração do primeiro Museu da Cultura Hip Hop da América Latina, em Porto Alegre
Continuar lendo
Presidente da Petrobras participa de conferência do Future Investment Initiative na Arábia Saudita
Presidente da Petrobras participa de conferência do Future Investment Initiative na Arábia Saudita
Continuar lendo
Resultados da Petrobras em 2023 são considerados excepcionais
Resultados da Petrobras em 2023 são considerados excepcionais
Continuar lendo
Inativação de conteúdos no período eleitoral
Inativação de conteúdos no período eleitoral
Continuar lendo
Aviso
Este é um canal exclusivo para atendimento a veículos de imprensa. Solicitamos que demandas não relacionadas a conteúdo jornalístico (por exemplo: conteúdos publicitários, jurídicos, participação de empregados em eventos, pesquisas acadêmicas, entre outros) não sejam enviadas para esse contato.
O canal Fale Conosco
ou o 0800 728 9001 são os canais adequados para solicitações de informações gerais sobre a companhia.

Página da Petrobras no Bluesky

Página da Petrobras no Bluesky
Página da Petrobras no Threds

Página da Petrobras no Threds
Página da Petrobras no Facebook

Página da Petrobras no Facebook
Página da Petrobras no Instagram

Página da Petrobras no Instagram
Página da Petrobras no You Tube

Página da Petrobras no You Tube
Página da Petrobras no Tik Tok

Página da Petrobras no Tik Tok
Página da Petrobras no Linkedin

Página da Petrobras no Linkedin
Utilize nossa busca para encontrar o que procura
no content
Faça uma busca:
Sugestões de busca
Link do botão
 Exibir mais resultados

Mais pesquisados
Preço dos combustíveis
Pré-Sal
Time Petrobras

SAC Petrobras
0800 728 9001

Acesso à Informação
Portal da Transparência
-
Assessoria de Imprensa
-
Categorias
-
Acesse também
Definições de Cookies Privacidade e Dados Pessoais
Acessibilidade
Sitemap
© Copyright Petrobras 2024. Todos os direitos reservados.
Você está em: AGÊNCIA PETROBRAS
Escolha um Canal:
Negócios

Negócios
Transparência

Transparência
Site Petrobras

Site Petrobras
no content
Faça uma busca:
Sugestões de busca
Link do botão
Exibir mais resultados
Mais pesquisados
Preço dos combustíveis
Pré-Sal
Time Petrobras
Acessibilidade
Alto-Contraste
Desligado
Ligado
Alto-Contraste
Texto Grande
Desligado
Ligado
Texto Grande
Idioma:
Selecione um idioma:
Português Inglês
Idioma
Acessibilidade
Canais
Busca
logo-petro Fechar caixa de cookies
Centro de preferências de privacidade
Quando você visita um site, ele pode armazenar ou coletar informações no seu navegador, principalmente na forma de cookies. Essas informações podem ser sobre você, suas preferências ou seu dispositivo e são usadas principalmente para fazer o site funcionar como você espera. As informações normalmente não o identificam diretamente, mas podem oferecer uma experiência na web mais personalizada. Como respeitamos seu direito à privacidade, você pode optar por não permitir alguns tipos de cookies. Clique nos títulos das diferentes categorias para saber mais e alterar nossas configurações padrão. No entanto, o bloqueio de alguns tipos de cookies pode afetar sua experiência no website e os serviços que podemos oferecer. Para mais informações, acesse nossa página de Privacidade e Proteção de Dados Pessoais.
Permitir todos
Gerenciar preferências de consentimento
Cookies estritamente necessários
Sempre ativos
Esses cookies são necessários para o funcionamento do site e não podem ser desabilitados em nossos sistemas. Eles geralmente são definidos apenas em resposta a ações que você realiza que constituem uma solicitação de serviços, como definir suas preferências de privacidade, fazer login ou preencher formulários. Você pode configurar seu navegador para bloquear ou avisá-lo sobre esses cookies, mas algumas partes do site não funcionarão. Esses cookies não armazenam nenhuma informação de identificação pessoal.
Cookies de funcionalidade
toggle cookies0
Esses cookies permitem que o site forneça funcionalidade e personalização aprimoradas. Eles podem ser estabelecidos por nós ou terceiros que tenham serviços adicionados em nossas páginas. Se esses cookies não forem permitidos, alguns ou todos esses serviços podem não funcionar corretamente.
Cookies de desempenho
toggle cookies1
Esses cookies nos permitem contar visitas e fontes de tráfego para que possamos medir e melhorar o desempenho do nosso site. Eles nos ajudam a saber quais páginas são as mais e menos populares e a ver como os visitantes se movimentam pelo site. Todas as informações coletadas por esses cookies são agregadas e, portanto, anônimas. Se você não permitir esses cookies, não saberemos quando você visitou nosso site.
Cookies de publicidade
toggle cookies2
Esses cookies podem ser colocados em nosso site por nossos parceiros de publicidade. Eles podem ser usados por essas empresas para criar um perfil de seus interesses e mostrar anúncios relevantes em outros sites. Eles não armazenam informações pessoais diretamente, mas são baseados na identificação exclusiva do seu navegador e dispositivo de internet. Se não permitir esses cookies, você verá menos publicidade direcionada.
Confirmar minhas escolhas
Rejeitar todos
Oculto
fechar banner de cookies
Consentimento de Cookies
Ao clicar em "Aceitar todos os cookies", concorda com o armazenamento de cookies no seu dispositivo para melhorar a navegação no site, analisar a utilização do site e ajudar nas nossas iniciativas de marketing. Para mais informações, acesse nossa página de Privacidade e Proteção de Dados Pessoais.
Definições de Cookies
Aceitar todos os cookies
Rejeitar todos
-
Exibir mais
-
Exibir mais
-
Exibir mais


