Pitney Bowes Inc. — Results of Operations and Financial Condition
Bull 4
Bear 0
Results
|
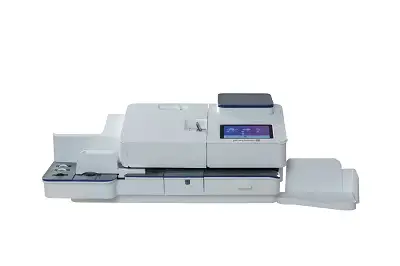
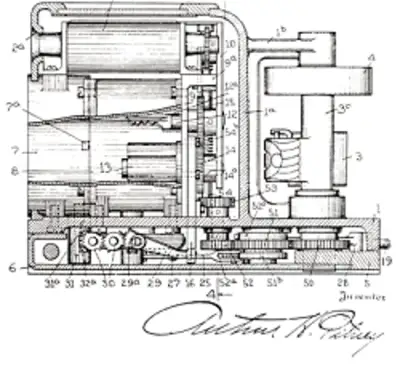
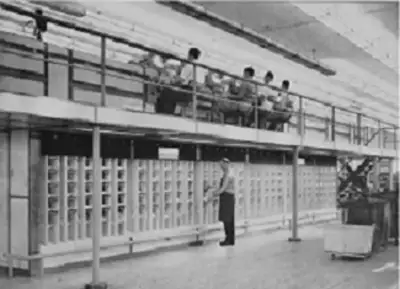
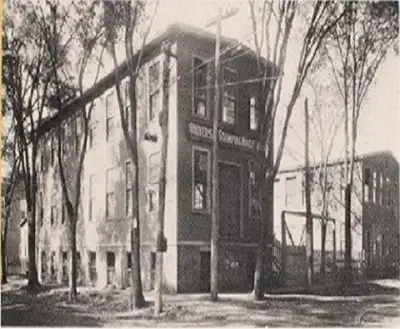
Pitney Bowes Inc. is a technology-driven company providing digital shipping solutions, mailing innovation, and financial services to clients worldwide, including small businesses, large enterprises, and government entities. The company operates through two primary segments: SendTech Solutions and Presort Services. SendTech Solutions offers physical and digital shipping and mailing technology, including cloud-based software platforms, shipping APIs, and equipment for sending, tracking, and receiving letters, parcels, and flats. This segment also includes financing alternatives provided through its wholly owned subsidiary, The Pitney Bowes Bank, which offers equipment financing, revolving credit, and deposit solutions. Presort Services functions as a national outsource provider of mail sortation services, partnering with the United States Postal Service to help clients qualify for postal workshare discounts on First-Class Mail, Marketing Mail, and other categories. The company serves clients across various industries and regions, utilizing a direct sales force, partner channels, and digital platforms. Pitney Bowes was founded by Arthur Pitney and Walter Bowes, with the company's history dating back over a century to the approval of the postage meter by the USPS. Summarised from the company's own disclosures, fiscal year ended Feb 2026 |
Industry Specialty Business Services | Homepage pitneybowes.com |
| Sector Industrials | IR page investorrelations.pitneybowes.com | |
|
Tags
shipping software, mailing technology, presort services, postal workshare, equipment financing, ecommerce fulfillment, shipping apis, mailroom automation, logistics optimization, embedded finance, SendTech Solutions, The Pitney Bowes Bank, Mail Exchange, Presort Services Account, Ecommerce fulfillment software, Shipping label printer, Mailroom equipment
|
Press page pitneybowes.com/us/newsroom/pb-100-years-images |
Metrics
| Valuation | |
|---|---|
| Market cap | $ 2.2B |
| Market cap (USD) | $ 2.2B |
| P/E | 12.49 |
| PEG | 0.22 |
| P/BV | -2.63 |
| P/S | 1.18 |
| P/OCF | 3.86 |
| P/FCF | 4.36 |
| Dividend yield | 0.18% |
| Turnover / mcap | — |
| Returns | |
|---|---|
| ROE | -18.0% |
| ROI | 12.2% |
| ROIC | 24.4% |
| Profit margin | 7.6% |
| Growth | |
|---|---|
| Revenue growing | No |
| Profits growing | Yes |
| Revenue up 3y | No |
| Revenue up 5y | No |
| Earnings growth 3y (net profit CAGR) | 57.6% |
| Quality | |
|---|---|
| Profitable | Yes |
| Margin expanding | Yes |
| Buying back stock | Yes |
| Diluting (TTM) | No |
| Debt/Equity | — |
| Podcast bulls (TTM) | Sign up |
| Podcast bears (TTM) | Sign up |
| Podcast sentiment (TTM) | Sign up |
| Podcast sentiment % (TTM) | Sign up |
| News sentiment (TTM) | 35 |
| Quality score | 15.8% |
| Insiders | |
|---|---|
| Buys, 1w | Sign up |
| Buys, 1m | Sign up |
| Buys, 1y | Sign up |
| Sells, 1w | Sign up |
| Sells, 1m | Sign up |
| Sells, 1y | Sign up |
Sign up to see this company's insider trades
| Figure | FY 2025 | FY 2024 | FY 2023 | FY 2022 | FY 2021 | FY 2020 | FY 2019 | FY 2018 | FY 2017 | FY 2016 | FY 2015 | FY 2014 | FY 2013 | FY 2012 | FY 2011 | FY 2010 | FY 2009 | FY 2008 | FY 2007 | FY 2006 | FY 2005 | FY 2004 | FY 2003 | FY 2002 | FY 2001 | FY 2000 |
|---|---|---|---|---|---|---|---|---|---|---|---|---|---|---|---|---|---|---|---|---|---|---|---|---|---|---|
| Revenue | 1.893B | 2.027B | 3.266B | 3.538B | 3.674B | 3.554B | 3.205B | 2.63B | 3.55B | 3.407B | 3.578B | 3.822B | 3.869B | 4.904B | 5.278B | 5.425B | 5.569B | 6.262B | 6.13B | 5.73B | 5.492B | 4.957B | 4.577B | 4.41B | 4.122B | 3.881B |
| Net profit | 144.697M | -203.597M | -385.627M | 36.94M | -1.351M | -181.544M | 194.609M | 223.665M | 261.34M | 92.805M | 407.943M | 333.755M | 142.835M | 445.163M | 617.48M | 292.379M | 444.913M | 419.793M | 366.781M | 105.347M | 526.578M | 480.526M | 498.117M | 475.75M | 488.343M | 622.546M |
| Free cash flow | 316.979M | 156.767M | -23.41M | 51.143M | 117.473M | 196.985M | 114.954M | 200.818M | 324.823M | 329.861M | 348.31M | 474.97M | 487.312M | 483.602M | 764.213M | 832.343M | 657.34M | 753.129M | 795.809M | -614.451M | 248.043M | 627.657M | 565.58M | — | — | — |
| Figure | FY 2025 | FY 2024 | FY 2023 | FY 2022 | FY 2021 | FY 2020 | FY 2019 | FY 2018 | FY 2017 | FY 2016 | FY 2015 | FY 2014 | FY 2013 | FY 2012 | FY 2011 | FY 2010 | FY 2009 | FY 2008 | FY 2007 | FY 2006 | FY 2005 | FY 2004 | FY 2003 | FY 2002 | FY 2001 | FY 2000 |
|---|---|---|---|---|---|---|---|---|---|---|---|---|---|---|---|---|---|---|---|---|---|---|---|---|---|---|
| Share price | 10.57 | 7.24 | 4.4 | 3.8 | 6.63 | 6.16 | 4.03 | 5.91 | 11.18 | 15.19 | 20.65 | 24.37 | 23.3 | 10.64 | 18.54 | 24.18 | 22.76 | 25.47 | 38.13 | 47.68 | — | — | — | — | — | — |
| Price performance 12m | 0.46 | 0.65 | 0.16 | -0.43 | 0.08 | 0.53 | -0.32 | -0.47 | -0.26 | -0.26 | -0.15 | 0.05 | 1.19 | -0.43 | -0.23 | 0.06 | -0.11 | -0.33 | -0.2 | — | — | — | — | — | — | — |
Filed figures
Lines the statements and their notes report beside the headline figures, read from the filings' XBRL as filed (no restatement applied), with figures computed from one filing's own lines. Cash-flow lines carry their cash direction: an outflow is negative. Each period links to its filing; a figure's period, report date and tag are in its tooltip.
| Figure | Dec 2016 | Dec 2017 | Dec 2018 | Dec 2019 | Dec 2020 | Dec 2021 | Dec 2022 | Dec 2023 | Dec 2024 | Dec 2025 |
|---|---|---|---|---|---|---|---|---|---|---|
| Balance sheet detail | ||||||||||
| Trade receivables (USD) | 456M | 524M | 456M | 373M | 389M | 335M | 344M | 342M | 160M | 168M |
| ↳ YoY growth | -0.4% | +15.1% | -13.1% | -18.1% | +4.2% | -14.0% | +2.7% | -0.4% | -53.3% | +5.1% |
| ↳ 5y CAGR | -8.8% | -6.4% | -0.6% | -2.0% | -3.2% | -6.0% | -8.1% | -5.6% | -15.6% | -15.5% |
| Borrowings, current (USD) | 614M | 271M | 200M | 20.1M | 216M | 24.7M | 32.8M | 58.9M | 53.3M | 17.2M |
| Borrowings, non-current (USD) | 2.75B | 3.56B | 3.07B | 2.72B | 2.35B | 2.3B | 2.17B | 2.09B | 1.87B | 1.98B |
| Lease liabilities (USD) | — | — | 174M | 225M | 243M | 283M | 374M | 392M | 160M | 165M |
| Cash and deposits (USD) | 765M | 1.01B | 867M | 924M | 921M | 732M | 670M | 601M | 470M | 285M |
| Intangible assets (USD) | 165M | 272M | 227M | 191M | 160M | 132M | 77.9M | 62.3M | 15.8M | 14.7M |
| Right-of-use assets (USD) | — | — | 157M | 201M | 202M | 208M | 296M | 310M | 113M | 107M |
| Net debt (borrowings + leases - cash) (USD) | 2.6B | 2.82B | 2.4B | 2.04B | 1.89B | 1.87B | 1.91B | 1.94B | 1.61B | 1.87B |
| Cash flow detail | ||||||||||
| Operating cash flow (USD) | 491M | 496M | 392M | 252M | 302M | 302M | 176M | 79.5M | 229M | 383M |
| Purchases of property, plant and equipment (USD) | -161M | -171M | -191M | -137M | -105M | -184M | -125M | -103M | -72.4M | -66.3M |
| Change in receivables (cash effect) (USD) | 44M | -20.6M | -35.6M | 8.32M | -47.2M | 37.5M | -29.3M | -6.03M | 32M | -14M |
| Change in inventories (cash effect) (USD) | -7M | 5.57M | 93,000 | -5.59M | 3.15M | -8.01M | -4.94M | 14.3M | 2.26M | -5.57M |
| Change in payables (cash effect) (USD) | -64.9M | -14.1M | -3.18M | 11.5M | 94.9M | 57.8M | 18.6M | -43.1M | 47.3M | -62M |
| Dividends paid (cash effect) (USD) | -141M | -139M | -140M | -35.4M | -34.3M | -34.8M | -34.7M | -35.2M | -36M | -51.1M |
| Interest paid (cash effect) (USD) | -151M | -169M | -171M | -158M | -152M | -124M | -134M | -164M | -168M | -142M |
| Income taxes paid (cash effect) (USD) | -127M | -53.2M | -25.9M | -27.1M | -20.2M | -4.34M | -14.6M | -22.6M | -45.5M | -16.1M |
| Share-based compensation (USD) | 14.9M | 24.4M | 21M | 23.1M | 17.5M | 20.9M | 16.6M | 9.6M | 16.5M | 14.2M |
| Operating cash flow before change in receivables (USD) | 447M | 516M | 428M | 244M | 349M | 264M | 205M | 85.5M | 197M | 397M |
| Free cash flow (OCF - PPE - intangibles) (USD) | 330M | 325M | 201M | 115M | 197M | 117M | 51.1M | -23.4M | 157M | 317M |
| Income detail | ||||||||||
| Research and development expense (USD) | 121M | 130M | 126M | 51.3M | 38.4M | 46.8M | 43.7M | 41.4M | 32M | 15.3M |
| ↳ 5y CAGR | -4.0% | -1.1% | +2.6% | -14.2% | -19.0% | -17.4% | -19.6% | -19.9% | -9.0% | -16.8% |
| Total comprehensive income (USD) | 41.3M | 409M | 184M | 303M | -181M | 57.5M | -18.3M | -401M | -192M | 195M |
| Comprehensive income to owners (USD) | 41.3M | 409M | 184M | 303M | -181M | 57.5M | -18.3M | -401M | -192M | 195M |
| Provision for credit losses (USD) | — | — | 26.4M | 28.5M | 42.2M | 7.81M | 6.42M | 8.18M | 25.2M | -773,000 |
| Credit cost ratio (credit losses / average receivables) (%) | — | — | 5.4% | 6.9% | 11.1% | 2.2% | 1.9% | 2.4% | 10.0% | 0.5% |
| Reported | Feb 22, 2017 | Feb 22, 2018 | Feb 19, 2021 | Feb 19, 2021 | Feb 19, 2021 | Feb 22, 2022 | Feb 17, 2023 | Feb 20, 2024 | Feb 21, 2025 | Feb 19, 2026 |
Sign up to see institutional holdings
Sign UpPodcast Mentions
Sign up to see podcast mentions and sentiment
Sign UpMaterial events reported to the SEC on Form 8-K or 6-K, newest first. The link opens the filing itself on EDGAR. Press releases from the company's own website, newest first.
Pitney Bowes Announces Strong Financial Results for Third Quarter 2026 and Issues CEO Letter
Bull 1
Bear 0
Results
October 28, 2026 4:05pm EDT
Related documents
Historical Segment Financials PDF
Discloses Continued Progress Toward Stabilizing Revenue as well as Growth in Adj. EBIT, Adj. EPS, and Adj. Free Cash Flow
Shares Positive Updates on Full-Year Guidance, Including Narrowing Outlooks and Increasing Midpoints for Revenue and Adj. Free Cash Flow
SHELTON, Conn.--(BUSINESS WIRE)-- Pitney Bowes Inc. (NYSE: PBI) (“Pitney Bowes” or the “Company”), a technology-driven company that provides digital shipping solutions, mailing innovation and financial services to clients around the world, today disclosed its financial results for the third quarter of 2026. In conjunction with this announcement, CEO Kurt Wolf has released a letter to shareholders to provide his commentary on the quarter and updates on strategic initiatives. To read and/or download a copy of this quarter’s CEO letter, please click here .
_Financial Highlights:
_The following table summarizes the Company’s financial highlights for the third quarter 2026:
Scroll to view ↔
| Third Quarter | ||||||||
| $ millions, except EPS | 2026 | 2025 | $ Change | % Change | ||||
| Revenue | $456 | $460 | ($3) | (1%) | ||||
| GAAP EPS | $0.37 | $0.30 | $0.07 | 23% | ||||
| Adj. EPS1 | $0.42 | $0.31 | $0.11 | 35% | ||||
| GAAP Net Income | $53 | $52 | $1 | 1% | ||||
| Adj. EBIT1 | $114 | $107 | $7 | 6% | ||||
| Cash from Operations | $151 | $67 | $84 | 126% | ||||
| Adj. Free Cash Flow1 | $147 | $60 | $87 | 144% | ||||
| 1 Adjusted EPS, Adjusted EBIT, and Adjusted Free Cash Flow are non-GAAP measures. Definitions for these metrics can be found in the Use of Non-GAAP Measures section. Reconciliations of non-GAAP measures to comparable GAAP measures can be found in the attached financial schedules. |
Update on Capital Allocation
- The Company reduced debt by $148 million in the quarter, including $46 million through a tender offer of its notes, due in 2037 and 2043, at a discount to par. Year-to-date, debt has been reduced by $108 million.
- During the quarter, the Company also repriced its $585 million Term Loan B, due 2032, reducing the interest margin by 75 basis points.
- The Company repurchased approximately 1.0 million shares for $17 million in the third quarter at an average per share price of $16.84. Additionally, the Company repurchased another 0.6 million shares for $11 million from the start of the fourth quarter through October 23, 2026.
- The Board approved a $0.10 per share quarterly regular dividend, which is payable on December 8, 2026, to shareholders of record as of November 16, 2026.
Business Segment Reporting
**SendTech Solutions
**SendTech Solutions offers physical and digital shipping and mailing technology solutions, financing, services, supplies and other applications for small and medium businesses, retail, enterprise, and government clients around the world to help simplify and save on the sending, tracking and receiving of letters, parcels and flats.
Scroll to view ↔
| Third Quarter | ||||||||
| $ millions | 2026 | 2025 | $ Change | % Change | ||||
| Revenue | $305 | $311 | ($6) | (2%) | ||||
| Adj. Segment EBITDA | $124 | $112 | $12 | 11% | ||||
| Adj. Segment EBIT | $115 | $101 | $14 | 14% |
SendTech saw a modest revenue decline in the third quarter due to anticipated decreases in the mailing install base at this point in the cycle. This was partially offset by higher equipment sales.
Gross profit was flat year-over-year despite lower revenue, supported by favorable product mix and lower tariff costs. Adjusted Segment EBITDA and EBIT improved as a result of cost reductions, with operating expenses declining $13 million versus prior year. Results also benefited from certain non-recurring items, most notably a $3 million benefit allocation from Corporate expenses reflecting better-than-anticipated medical claims at SendTech year-to-date.
**Presort Services
**Presort Services provides sortation services that enable clients to qualify for USPS workshare discounts in First Class Mail, Marketing Mail, Marketing Mail Flats and Bound Printed Matter.
Scroll to view ↔
| Third Quarter | ||||||||
| $ millions | 2026 | 2025 | $ Change | % Change | ||||
| Revenue | $151 | $149 | $2 | 1% | ||||
| Adj. Segment EBITDA | $41 | $42 | ($1) | (2%) | ||||
| Adj. Segment EBIT | $32 | $33 | ($1) | (2%) |
Presort revenue grew 1% in the third quarter, returning to year-over-year growth, driven by increased volume from new client wins. Total volume sorted in the quarter was 3.4 billion pieces of mail, a 4% increase year-over-year.
Adjusted Segment EBITDA and EBIT saw modest declines due to lower revenue per piece and to higher transportation costs, which increased $6 million year-over-year driven by elevated fuel prices and freight cost inflation. Results also benefited from a non-recurring $7 million benefit allocation from Corporate expenses reflecting better-than-anticipated medical claims at Presort year-to-date.
2026 Full-Year Outlook
As a result of strong performance, the Company is raising the low end and effectively establishing a higher midpoint for Revenue. The Company is also raising its guidance for Adjusted Free Cash Flow and narrowing its guidance ranges for Adjusted EBIT and Adjusted EPS, maintaining their midpoints. Of note, the Company's year-to-date Adjusted Free Cash Flow reflects the benefit of increased prepayments due to new customers, resulting from the exit of a significant mail sortation competitor.
Updated guidance for Revenue, Adjusted EBIT, Adjusted EPS and Adjusted Free Cash Flow in 2026 is as follows:
Scroll to view ↔
| Previous Guidance | Updated Guidance | |||||||
| $ millions, except EPS | Low | High | Low | High | ||||
| Revenue | $1,800 | $1,860 | $1,830 | $1,860 | ||||
| Adjusted EBIT | $445 | $475 | $450 | $470 | ||||
| Adjusted EPS | $1.55 | $1.70 | $1.58 | $1.67 | ||||
| Adjusted Free Cash Flow | $360 | $410 | $380 | $420 |
Q3 2026 Earnings Conference Call
Management will discuss the Company’s results in a webcast tomorrow, October 29, 2026, at 8:00 a.m. ET. Instructions for accessing the earnings results call are available on the Investor Relations page of the Company’s website at www.pitneybowes.com .
***As a reminder, to read and/or download a copy of this quarter’s CEO letter, please click here ***
About Pitney Bowes
Pitney Bowes (NYSE: PBI) is a technology-driven company that provides digital shipping solutions, mailing innovation, and financial services to clients around the world – including more than 90 percent of the Fortune 500. Small businesses to large enterprises, and government entities rely on Pitney Bowes to reduce the complexity of sending mail and parcels. For the latest news, corporate announcements, and financial results, visit www.pitneybowes.com/us/newsroom . For additional information, visit Pitney Bowes at www.pitneybowes.com .
Adjusted Segment EBIT
Adjusted Segment EBIT (earnings before interest and taxes) is the primary measure of profitability and operational performance at the segment level. Adjusted Segment EBIT includes segment revenues and related costs and expenses attributable to the segment, but excludes interest, taxes, general corporate expenses, restructuring charges, and other items not allocated to a business segment. Effective January 1, 2026, Adjusted Segment EBIT also excludes pension expense related to U.S. and Canada pension plans that we have taken steps to terminate. We also report Adjusted Segment EBITDA (earnings before interest, taxes, depreciation and amortization) as an additional useful measure of segment profitability and operational performance, which is calculated as Adjusted Segment EBIT plus depreciation and amortization expense of the segment.
Use of Non-GAAP Measures
Pitney Bowes’ financial results are reported in accordance with generally accepted accounting principles (GAAP). Pitney Bowes also discloses certain non-GAAP measures, such as Adjusted EBIT, Adjusted EBITDA, adjusted earnings per share (Adjusted EPS) and adjusted free cash flow.
Adjusted EBIT, Adjusted EBITDA and Adjusted EPS exclude the impact of restructuring charges, foreign currency gains and losses on intercompany loans, certain costs associated with the Ecommerce Restructuring, gains and losses on debt redemptions and other unusual items that we believe are not indicative of our core business operations. For the 2026 periods, these measures also exclude pension expense related to the U.S. and Canada pension plans that we have taken steps to terminate.
Effective Q2 2026, the Company has renamed “Free Cash Flow” to “Adjusted Free Cash Flow”. This is a change in title only. There is no change in definition nor calculation methodology, and all prior-period amounts remain unchanged. Adjusted free cash flow adjusts cash flow from operations calculated in accordance with GAAP for capital expenditures, restructuring payments and other special items. Management believes adjusted free cash flow provides better insight into the amount of cash available for other discretionary uses.
Reconciliations of non-GAAP measures to comparable GAAP measures can be found in the attached financial schedules and at the Company's website at: https://www.investorrelations.pitneybowes.com . We do not provide a reconciliation of forward-looking non-GAAP measures to the most comparable GAAP measures because items necessary for such reconciliation are not available on a reasonable basis without unreasonable efforts.
Forward-Looking Statements
This document contains “forward-looking statements” about the Company’s expected or potential future business and financial performance, including, but not limited to, statements about future revenue and profitability, earnings guidance, future events or conditions, capital allocation strategy, expected cost savings and efficiency improvements, and strategic initiatives and priorities. Forward-looking statements are not guarantees of future performance and involve risks and uncertainties that could cause actual results to differ materially from those projected. Factors which could cause future performance to differ materially from expectations include, without limitation, changes in postal regulations or the operations and financial health of posts in the U.S. or other major markets or changes to the broader postal or shipping markets; accelerated or sudden declines in physical mail volumes or shipping volumes; the loss of some of our larger clients; changes in trade policies, tariffs and regulations; periods of difficult economic conditions, the impacts of inflation and rising prices, higher interest rates and a slow-down in economic activity, including a global recession, or a prolonged U.S. government shutdown, to the Company and our clients; changes in labor and transportation availability and costs; and other factors as more fully outlined in the Company's Annual Report on Form 10-K/A for the year ended December 31, 2025 and subsequent reports filed with the Securities and Exchange Commission. Pitney Bowes assumes no obligation to update any forward-looking statements contained in this document as a result of new information, events, or developments, except as required by law.
Scroll to view ↔
| Pitney Bowes Inc. | ||||||||||||
| Consolidated Statements of Operations | ||||||||||||
| (Unaudited; in thousands, except per share amounts) | ||||||||||||
| Three Months Ended September 30, | Nine Months Ended September 30, | |||||||||||
| 2026 | 2025 | 2026 | 2025 | |||||||||
| Revenue: | ||||||||||||
| Services | $288,033 | $289,476 | $879,120 | $898,331 | ||||||||
| Products | 90,257 | 89,712 | 266,430 | 273,782 | ||||||||
| Financing and other | 77,892 | 80,487 | 239,543 | 242,891 | ||||||||
| Total revenue | 456,182 | 459,675 | 1,385,093 | 1,415,004 | ||||||||
| Costs and expenses: | ||||||||||||
| Cost of services | 149,439 | 146,394 | 460,950 | 446,507 | ||||||||
| Cost of products | 47,689 | 54,294 | 137,811 | 159,700 | ||||||||
| Cost of financing and other | 11,746 | 14,708 | 36,965 | 47,871 | ||||||||
| Selling, general and administrative | 139,201 | 144,154 | 401,324 | 480,611 | ||||||||
| Research and development | 3,383 | 3,409 | 10,560 | 11,773 | ||||||||
| Restructuring charges | 1,529 | 1,836 | 9,978 | 17,042 | ||||||||
| Interest expense, net | 25,984 | 26,072 | 80,556 | 75,279 | ||||||||
| Other components of net pension and postretirement cost | 10,274 | 1,645 | 33,564 | 5,446 | ||||||||
| Other expense | (3,155 | ) | (981 | ) | (2,672 | ) | 16,628 | |||||
| Total costs and expenses | 386,090 | 391,531 | 1,169,036 | 1,260,857 | ||||||||
| Income before taxes | 70,092 | 68,144 | 216,057 | 154,147 | ||||||||
| Provision for income taxes | 17,426 | 16,181 | 55,345 | 36,787 | ||||||||
| Net income | $52,666 | $51,963 | $160,712 | $117,360 | ||||||||
| Basic earnings per share | $0.39 | $0.31 | $1.14 | $0.66 | ||||||||
| Diluted earnings per share | $0.37 | $0.30 | $1.12 | $0.66 | ||||||||
| Weighted-average shares used in diluted earnings per share | 140,728 | 170,370 | 142,971 | 178,375 |
Scroll to view ↔
| Pitney Bowes Inc. | ||||||
| Consolidated Balance Sheets | ||||||
| (Unaudited; in thousands) | ||||||
| Assets | September 30,2026 | December 31,2025 | ||||
| Current assets: | ||||||
| Cash and cash equivalents | $268,514 | $284,887 | ||||
| Short-term investments | 12,661 | 12,232 | ||||
| Accounts and other receivables, net | 162,171 | 168,099 | ||||
| Short-term finance receivables, net | 461,910 | 496,446 | ||||
| Inventories | 63,022 | 66,241 | ||||
| Current income taxes | 2,422 | 3,143 | ||||
| Other current assets and prepayments | 74,172 | 69,451 | ||||
| Total current assets | 1,044,872 | 1,100,499 | ||||
| Property, plant and equipment, net | 171,932 | 185,913 | ||||
| Rental property and equipment, net | 21,959 | 24,054 | ||||
| Long-term finance receivables, net | 533,191 | 605,129 | ||||
| Goodwill | 739,193 | 746,687 | ||||
| Intangible assets, net | 12,039 | 14,741 | ||||
| Operating lease assets | 97,168 | 106,996 | ||||
| Noncurrent income taxes | 98,131 | 95,412 | ||||
| Other assets | 273,795 | 289,520 | ||||
| Total assets | $2,992,280 | $3,168,951 | ||||
| Liabilities and stockholders' deficit | ||||||
| Current liabilities: | ||||||
| Accounts payable and accrued liabilities | $796,213 | $845,378 | ||||
| Customer deposits at Pitney Bowes Bank | 576,949 | 582,630 | ||||
| Current operating lease liabilities | 29,725 | 28,396 | ||||
| Current portion of long-term debt | 24,730 | 17,150 | ||||
| Advance billings | 66,928 | 69,075 | ||||
| Current income taxes | 2,795 | 5,210 | ||||
| Total current liabilities | 1,497,340 | 1,547,839 | ||||
| Long-term debt | 1,862,691 | 1,975,888 | ||||
| Deferred taxes on income | 111,879 | 72,665 | ||||
| Tax uncertainties and other income tax liabilities | 60 | 278 | ||||
| Noncurrent operating lease liabilities | 87,595 | 99,757 | ||||
| Noncurrent customer deposits at Pitney Bowes Bank | 71,000 | 71,000 | ||||
| Other noncurrent liabilities | 198,452 | 203,884 | ||||
| Total liabilities | 3,829,017 | 3,971,311 | ||||
| Stockholders' deficit: | ||||||
| Common stock | 270,338 | 270,338 | ||||
| Retained earnings | 2,739,946 | 2,655,703 | ||||
| Accumulated other comprehensive loss | (789,981 | ) | (789,132 | ) | ||
| Treasury stock, at cost | (3,057,040 | ) | (2,939,269 | ) | ||
| Total stockholders' deficit | (836,737 | ) | (802,360 | ) | ||
| Total liabilities and stockholders' deficit | $2,992,280 | $3,168,951 |
Scroll to view ↔
| PITNEY BOWES INC. | ||||||
| STATEMENTS OF CASH FLOWS | ||||||
| SEPTEMBER 2026 | ||||||
| (Dollars in thousands) | ||||||
| YEAR-TO-DATE | ||||||
| 2026 | 2025 | |||||
| Cash Flows From Operating Activities: | ||||||
| Net income | $160,712 | $117,360 | ||||
| Adjustments to reconcile net income to net cash provided by operating activities: | ||||||
| Depreciation and amortization | 72,062 | 84,503 | ||||
| Allowance for credit losses | 8,268 | 9,382 | ||||
| Change in allowance for DIP Facility | - | (8,907 | ) | |||
| Stock-based compensation | 16,956 | 15,038 | ||||
| Amortization of debt fees | 5,603 | 5,319 | ||||
| Loss on debt redemption/refinancing | (2,039 | ) | 24,446 | |||
| Restructuring charges | 9,978 | 17,042 | ||||
| Restructuring payments | (35,592 | ) | (30,843 | ) | ||
| Loss on disposal of fixed assets | 4,474 | 9,203 | ||||
| (Gain) loss on revaluation of intercompany loans | (6,731 | ) | 21,234 | |||
| Other, net | 26,058 | (14,875 | ) | |||
| Changes in operating assets and liabilities, net of acquisitions: | ||||||
| Accounts and other receivables | 1,359 | (4,500 | ) | |||
| Finance receivables | 87,499 | 94,725 | ||||
| Inventories | 3,022 | (14,825 | ) | |||
| Other current assets and prepayments | (7,332 | ) | (5,932 | ) | ||
| Accounts payable and accrued liabilities | (23,297 | ) | (171,665 | ) | ||
| Current and noncurrent income taxes | 28,673 | 14,666 | ||||
| Advance billings | (1,461 | ) | 186 | |||
| Net cash from operating activities | 348,212 | 161,557 | ||||
| Cash Flows From Investing Activities: | ||||||
| Capital expenditures | (45,041 | ) | (46,027 | ) | ||
| Purchases of investment securities | (9,171 | ) | (30,039 | ) | ||
| Proceeds from sales/maturities of investment securities | 14,959 | 23,844 | ||||
| Net investment in loans receivables | 10,383 | (66,736 | ) | |||
| DIP Facility reimbursement | - | 8,907 | ||||
| Acquisition | - | (2,200 | ) | |||
| Other investing activities, net | 233 | 1,720 | ||||
| Net cash from investing activities | (28,637 | ) | (110,531 | ) | ||
| Cash Flows From Financing Activities: | ||||||
| Borrowings under revolving credit facility | 176,700 | - | ||||
| Repayments under revolving credit facility | (176,700 | ) | - | |||
| Proceeds from issuance of debt | 300,000 | 1,005,000 | ||||
| Principal payments of debt | (402,032 | ) | (820,262 | ) | ||
| Premium and fees paid to redeem/refinance debt | (7,728 | ) | (29,127 | ) | ||
| Dividends paid to stockholders | (40,599 | ) | (36,905 | ) | ||
| Customer deposits at Pitney Bowes Bank | (5,681 | ) | (55,648 | ) | ||
| Capped call payment | - | (24,702 | ) | |||
| Proceeds from stock option exercise | 36,818 | 21,703 | ||||
| Common stock repurchases | (205,725 | ) | (251,774 | ) | ||
| Other financing activities, net | (10,151 | ) | (10,672 | ) | ||
| Net cash from financing activities | (335,098 | ) | (202,387 | ) | ||
| Effect of exchange rate changes on cash and cash equivalents | (850 | ) | 2,629 | |||
| Change in cash and cash equivalents | (16,373 | ) | (148,732 | ) | ||
| Cash and cash equivalents at beginning of period | 284,887 | 469,726 | ||||
| Cash and cash equivalents at end of period | $268,514 | $320,994 |
Scroll to view ↔
| Pitney Bowes Inc. | ||||||||||||||||||
| Business Segment Revenue | ||||||||||||||||||
| (Unaudited; in thousands) | ||||||||||||||||||
| Three Months Ended September 30, | Nine Months Ended September 30, | |||||||||||||||||
| 2026 | 2025 | % Change | 2026 | 2025 | % Change | |||||||||||||
| Sending Technology Solutions | $305,255 | $310,782 | (2 | %) | $928,132 | $938,104 | (1 | %) | ||||||||||
| Presort Services | 150,927 | 148,893 | 1 | % | 456,961 | 476,900 | (4 | %) | ||||||||||
| Total revenue | $456,182 | $459,675 | (1 | %) | $1,385,093 | $1,415,004 | (2 | %) |
Scroll to view ↔
| Pitney Bowes Inc. | ||||||||||||||||||||
| Adjusted Segment EBIT & EBITDA | ||||||||||||||||||||
| (Unaudited; in thousands) | ||||||||||||||||||||
| Three Months Ended September 30, | ||||||||||||||||||||
| 2026 | 2025 | % change | ||||||||||||||||||
| AdjustedSegmentEBIT | D&A | AdjustedSegmentEBITDA | AdjustedSegmentEBIT | D&A | AdjustedSegmentEBITDA | AdjustedSegmentEBIT | AdjustedSegmentEBITDA | |||||||||||||
| Sending Technology Solutions | $115,035 | $9,172 | $124,207 | $101,059 | $11,190 | $112,249 | 14 | % | 11 | % | ||||||||||
| Presort Services | 31,861 | 8,991 | 40,852 | 32,626 | 9,242 | 41,868 | (2 | %) | (2 | %) | ||||||||||
| Total reportable segments | $146,896 | $18,163 | $165,059 | $133,685 | $20,432 | $154,117 | 10 | % | 7 | % | ||||||||||
| Reconciliation of Adjusted Segment EBITDA to income before taxes: | ||||||||||||||||||||
| Depreciation and amortization - reportable segments | (18,163 | ) | (20,432 | ) | ||||||||||||||||
| Interest expense, net | (34,450 | ) | (37,287 | ) | ||||||||||||||||
| Corporate expenses | (32,980 | ) | (26,350 | ) | ||||||||||||||||
| Restructuring charges | (1,529 | ) | (1,836 | ) | ||||||||||||||||
| Gain (loss) on debt activities | 3,155 | (82 | ) | |||||||||||||||||
| Foreign currency gain on intercompany loans | 960 | 3,390 | ||||||||||||||||||
| Pension expense of plans to be terminated | (7,149 | ) | - | |||||||||||||||||
| Transaction and strategic review costs | (4,811 | ) | (4,439 | ) | ||||||||||||||||
| Benefit in connection with Ecommerce Restructuring | - | 1,063 | ||||||||||||||||||
| Income before taxes | $70,092 | $68,144 | ||||||||||||||||||
| Nine Months Ended September 30, | ||||||||||||||||||||
| 2026 | 2025 | % change | ||||||||||||||||||
| AdjustedSegmentEBIT | D&A | AdjustedSegmentEBITDA | AdjustedSegmentEBIT | D&A | AdjustedSegmentEBITDA | AdjustedSegmentEBIT | AdjustedSegmentEBITDA | |||||||||||||
| Sending Technology Solutions | $351,243 | $28,906 | $380,149 | $299,341 | $34,602 | $333,943 | 17 | % | 14 | % | ||||||||||
| Presort Services | 91,045 | 26,582 | 117,627 | 123,345 | 27,649 | 150,994 | (26 | %) | (22 | %) | ||||||||||
| Total reportable segments | $442,288 | $55,488 | $497,776 | $422,686 | $62,251 | $484,937 | 5 | % | 3 | % | ||||||||||
| Reconciliation of Adjusted Segment EBITDA to income before taxes: | ||||||||||||||||||||
| Depreciation and amortization - reportable segments | (55,488 | ) | (62,251 | ) | ||||||||||||||||
| Interest expense, net | (107,633 | ) | (112,671 | ) | ||||||||||||||||
| Corporate expenses | (81,942 | ) | (93,369 | ) | ||||||||||||||||
| Restructuring charges | (9,978 | ) | (17,042 | ) | ||||||||||||||||
| Gain (loss) on debt activities | 2,039 | (24,446 | ) | |||||||||||||||||
| Foreign currency gain (loss) on intercompany loans | 6,731 | (21,234 | ) | |||||||||||||||||
| Pension expense of plans to be terminated | (23,125 | ) | - | |||||||||||||||||
| Transaction and strategic review costs | (12,956 | ) | (7,595 | ) | ||||||||||||||||
| Benefit in connection with Ecommerce Restructuring | 633 | 7,818 | ||||||||||||||||||
| Income before taxes | $216,057 | $154,147 |
Scroll to view ↔
| Pitney Bowes Inc. | ||||||||||||
| Reconciliation of Reported Consolidated Results to Adjusted Results | ||||||||||||
| (Unaudited; in thousands, except per share amounts) | ||||||||||||
| Three Months EndedSeptember 30, | Nine Months EndedSeptember 30, | |||||||||||
| 2026 | 2025 | 2026 | 2025 | |||||||||
| Reconciliation of net income to adjusted net income, adjusted EBIT and adjusted EBITDA | ||||||||||||
| Net income - GAAP | $52,666 | $51,963 | $160,712 | $117,360 | ||||||||
| Provision for income taxes | 17,426 | 16,181 | 55,345 | 36,787 | ||||||||
| Income before taxes | 70,092 | 68,144 | 216,057 | 154,147 | ||||||||
| Restructuring charges | 1,529 | 1,836 | 9,978 | 17,042 | ||||||||
| Foreign currency (gain) loss on intercompany loans | (960 | ) | (3,390 | ) | (6,731 | ) | 21,234 | |||||
| (Gain) loss on debt activities | (3,155 | ) | 82 | (2,039 | ) | 24,446 | ||||||
| Pension expense of plans to be terminated | 7,149 | - | 23,125 | - | ||||||||
| Transaction and strategic review costs | 4,811 | 4,439 | 12,956 | 7,595 | ||||||||
| Benefit in connection with Ecommerce Restructuring | - | (1,063 | ) | (633 | ) | (7,818 | ) | |||||
| Adjusted net income before tax | 79,466 | 70,048 | 252,713 | 216,646 | ||||||||
| Adjusted tax provision | 19,898 | 16,657 | 64,454 | 52,488 | ||||||||
| Adjusted net income | $59,568 | $53,391 | $188,259 | $164,158 | ||||||||
| Adjusted income before tax | 79,466 | $70,048 | $252,713 | $216,646 | ||||||||
| Interest expense, including financing interest | 34,450 | 37,287 | 107,633 | 112,671 | ||||||||
| Adjusted EBIT | 113,916 | 107,335 | 360,346 | 329,317 | ||||||||
| Depreciation and amortization | 22,734 | 27,418 | 72,062 | 84,503 | ||||||||
| Adjusted EBITDA | $136,650 | $134,753 | $432,408 | $413,820 | ||||||||
| Reconciliation of diluted earnings per share to adjusted diluted earnings per share | ||||||||||||
| Diluted earnings per share - GAAP | $0.37 | $0.30 | $1.12 | $0.66 | ||||||||
| Restructuring charges | $0.01 | 0.01 | 0.05 | 0.07 | ||||||||
| Foreign currency (gain) loss on intercompany loans | ($0.01 | ) | (0.02 | ) | (0.04 | ) | 0.09 | |||||
| Pension expense of plans to be terminated | $0.04 | - | 0.12 | - | ||||||||
| (Gain) loss on debt activities | ($0.02 | ) | - | (0.01 | ) | 0.10 | ||||||
| Transaction and strategic review costs | $0.03 | 0.02 | 0.07 | 0.03 | ||||||||
| Benefit in connection with Ecommerce Restructuring | - | (0.01 | ) | - | (0.03 | ) | ||||||
| Adjusted diluted earnings per share | $0.42 | $0.31 | $1.32 | $0.92 | ||||||||
| The sum of the earnings per share amounts may not equal the total due to rounding. | ||||||||||||
| Reconciliation of net cash from operating activities to adjusted free cash flow | ||||||||||||
| Net cash from operating activities | $151,140 | $66,848 | $348,212 | $161,557 | ||||||||
| Capital expenditures | (10,710 | ) | (15,797 | ) | (45,041 | ) | (46,027 | ) | ||||
| Restructuring payments | 6,694 | 9,325 | 35,592 | 30,843 | ||||||||
| Adjusted free cash flow | $147,124 | $60,376 | $338,763 | $146,373 |
View source version on businesswire.com: https://www.businesswire.com/news/home/20261028149219/en/
For Investors:
Alex Brown
[email protected]
Source: Pitney Bowes Inc.
Released October 28, 2026
©2026 Pitney Bowes Inc. All Rights Reserved.
Market Data copyright © 2026 QuoteMedia . Data delayed 15 minutes unless otherwise indicated (view delay times for all exchanges). RT=Real-Time, EOD=End of Day, PD=Previous Day. Market Data powered by QuoteMedia . Terms of Use .
Pitney Bowes Announces Date for Third Quarter 2026 Earnings Release and Conference Call
Bull 0
Bear 0
Routine
October 15, 2026 8am EDT
SHELTON, Conn.--(BUSINESS WIRE)-- Pitney Bowes Inc. (NYSE: PBI), a technology-driven products and services company that provides digital shipping solutions, mailing innovation, and financial services to clients around the world – including more than 90 percent of the Fortune 500 – today announced that it will report third quarter 2026 earnings results after market close on Wednesday, October 28, 2026.
The Company will host an investor conference call the next day on Thursday, October 29, 2026, at 8:00 a.m. ET to review its results. This call and all supplemental information can be accessed on Pitney Bowes’ investor relations site at https://www.investorrelations.pitneybowes.com/ .
**Pitney Bowes Third Quarter 2026 Financial Results
**When: Thursday, October 29, 2026
Time: 8:00 a.m. ET
Webcast: Webcast Link
A recording of the call will also be available on the Company’s website after the call.
About Pitney Bowes
Pitney Bowes (NYSE: PBI) is a technology-driven products and services company that provides digital shipping solutions, mailing innovation, and financial services to clients around the world – including more than 90 percent of the Fortune 500. Small businesses to large enterprises, and government entities rely on Pitney Bowes to reduce the complexity of sending mail and parcels. For the latest news, corporate announcements, and financial results, visit www.pitneybowes.com/us/newsroom . For additional information, visit Pitney Bowes at www.pitneybowes.com .
View source version on businesswire.com: https://www.businesswire.com/news/home/20261015840649/en/
Alex Brown
[email protected]
Source: Pitney Bowes Inc.
Released October 15, 2026
©2026 Pitney Bowes Inc. All Rights Reserved.
Market Data copyright © 2026 QuoteMedia . Data delayed 15 minutes unless otherwise indicated (view delay times for all exchanges). RT=Real-Time, EOD=End of Day, PD=Previous Day. Market Data powered by QuoteMedia . Terms of Use .

 Government
 Financial services
 Healthcare
 Higher education
 Legal
 Pharmacy
 Retail & ecommerce
 Small business
 Digital certified mail
 Order management
 Multicarrier management
 Shipping analytics & insights
 International shipping
 Newsletter
 Newsroom
 Webinars
 Shipping rate calculator
 Blogs
 Carriers
 Case studies
 Rate change
 Trust center
 Product update hub
 Web support Find answers, product guides and help for all your Pitney Bowes services













































Prompts
Click prompts to add them under the company line, click again to take one out, then copy the result into your AI chat. Shared by Asian Century Stocks and Uncovered Thai Stocks. Thank you.
Pitney Bowes Inc. (ticker PBI), listed in United States.
Copied
ETFs Holding Pitney Bowes Inc.
Exchange-traded funds whose newest published daily portfolio holds one of the company's listings, largest weight first.
| ETF | Weight in ETF | Shares | Market value | As of |
|---|---|---|---|---|
| SIXS | 1.03% | 95,419 | $ 1.492M | Nov 12, 2026 |
| MYLD | 0.96% | 18,511 | $ 324.498K | Jul 31, 2026 |
| VAMO | 0.89% | 55,371 | $ 970.654K | Jul 31, 2026 |
| EHLS | 0.79% | 27,631 | $ 424.965K | Nov 17, 2026 |
| ESSC | 0.31% | 6,296 | $ 110.369K | Jul 31, 2026 |
| FSCC | 0.29% | 62,240 | $ 1.066M | Aug 31, 2026 |
| SAGP | 0.20% | 8,834 | $ 154.772K | Jun 30, 2026 |
| AFSM | 0.19% | 18,116 | $ 278.624K | Nov 16, 2026 |
| VFMF | 0.16% | 92,816 | $ 1.59M | Aug 31, 2026 |
| SEIS | 0.14% | 47,935 | $ 839.821K | Jun 30, 2026 |
| RESM | 0.11% | 225 | $ 3,942.00 | Jun 30, 2026 |
| MKTN | 0.09% | 5,527 | $ 96.833K | Jun 30, 2026 |
| VFVA | 0.07% | 39,420 | $ 675.265K | Aug 31, 2026 |
| DFAS | 0.05% | 1,006,196 | $ 15.737M | Nov 12, 2026 |
| MSSM | 0.03% | 12,604 | $ 215.907K | Aug 31, 2026 |
| JMEE | 0.03% | 52,696 | $ 795.71K | Nov 17, 2026 |
| SMDX | 0.03% | 2,471 | $ 38.004K | Nov 17, 2026 |
| DFSU | 0.01% | 10,937 | $ 171.055K | Nov 12, 2026 |
| DFAC | 0.01% | 378,321 | $ 5.917M | Nov 12, 2026 |
| DFAU | 0.00% | 32,748 | $ 512.179K | Nov 12, 2026 |
| DCOR | 0.00% | 109,308 | $ 1.71M | Nov 12, 2026 |
| DFUS | 0.00% | 43,850 | $ 685.814K | Nov 12, 2026 |
| NTRL | 0.00% | 9,546 | $ 0.00 | Nov 16, 2026 |