Booth #311 · Gaylord Texan, Grapevine, TX September 23–25, 2026 FSTEC is where the restaurant industry comes to see what’s actually shipping — not what’s on a roadmap slide. This year, PAR Restaurant is bringing four launches to Booth #311, and…

Booth #311 · Gaylord Texan, Grapevine, TX September 23–25, 2026
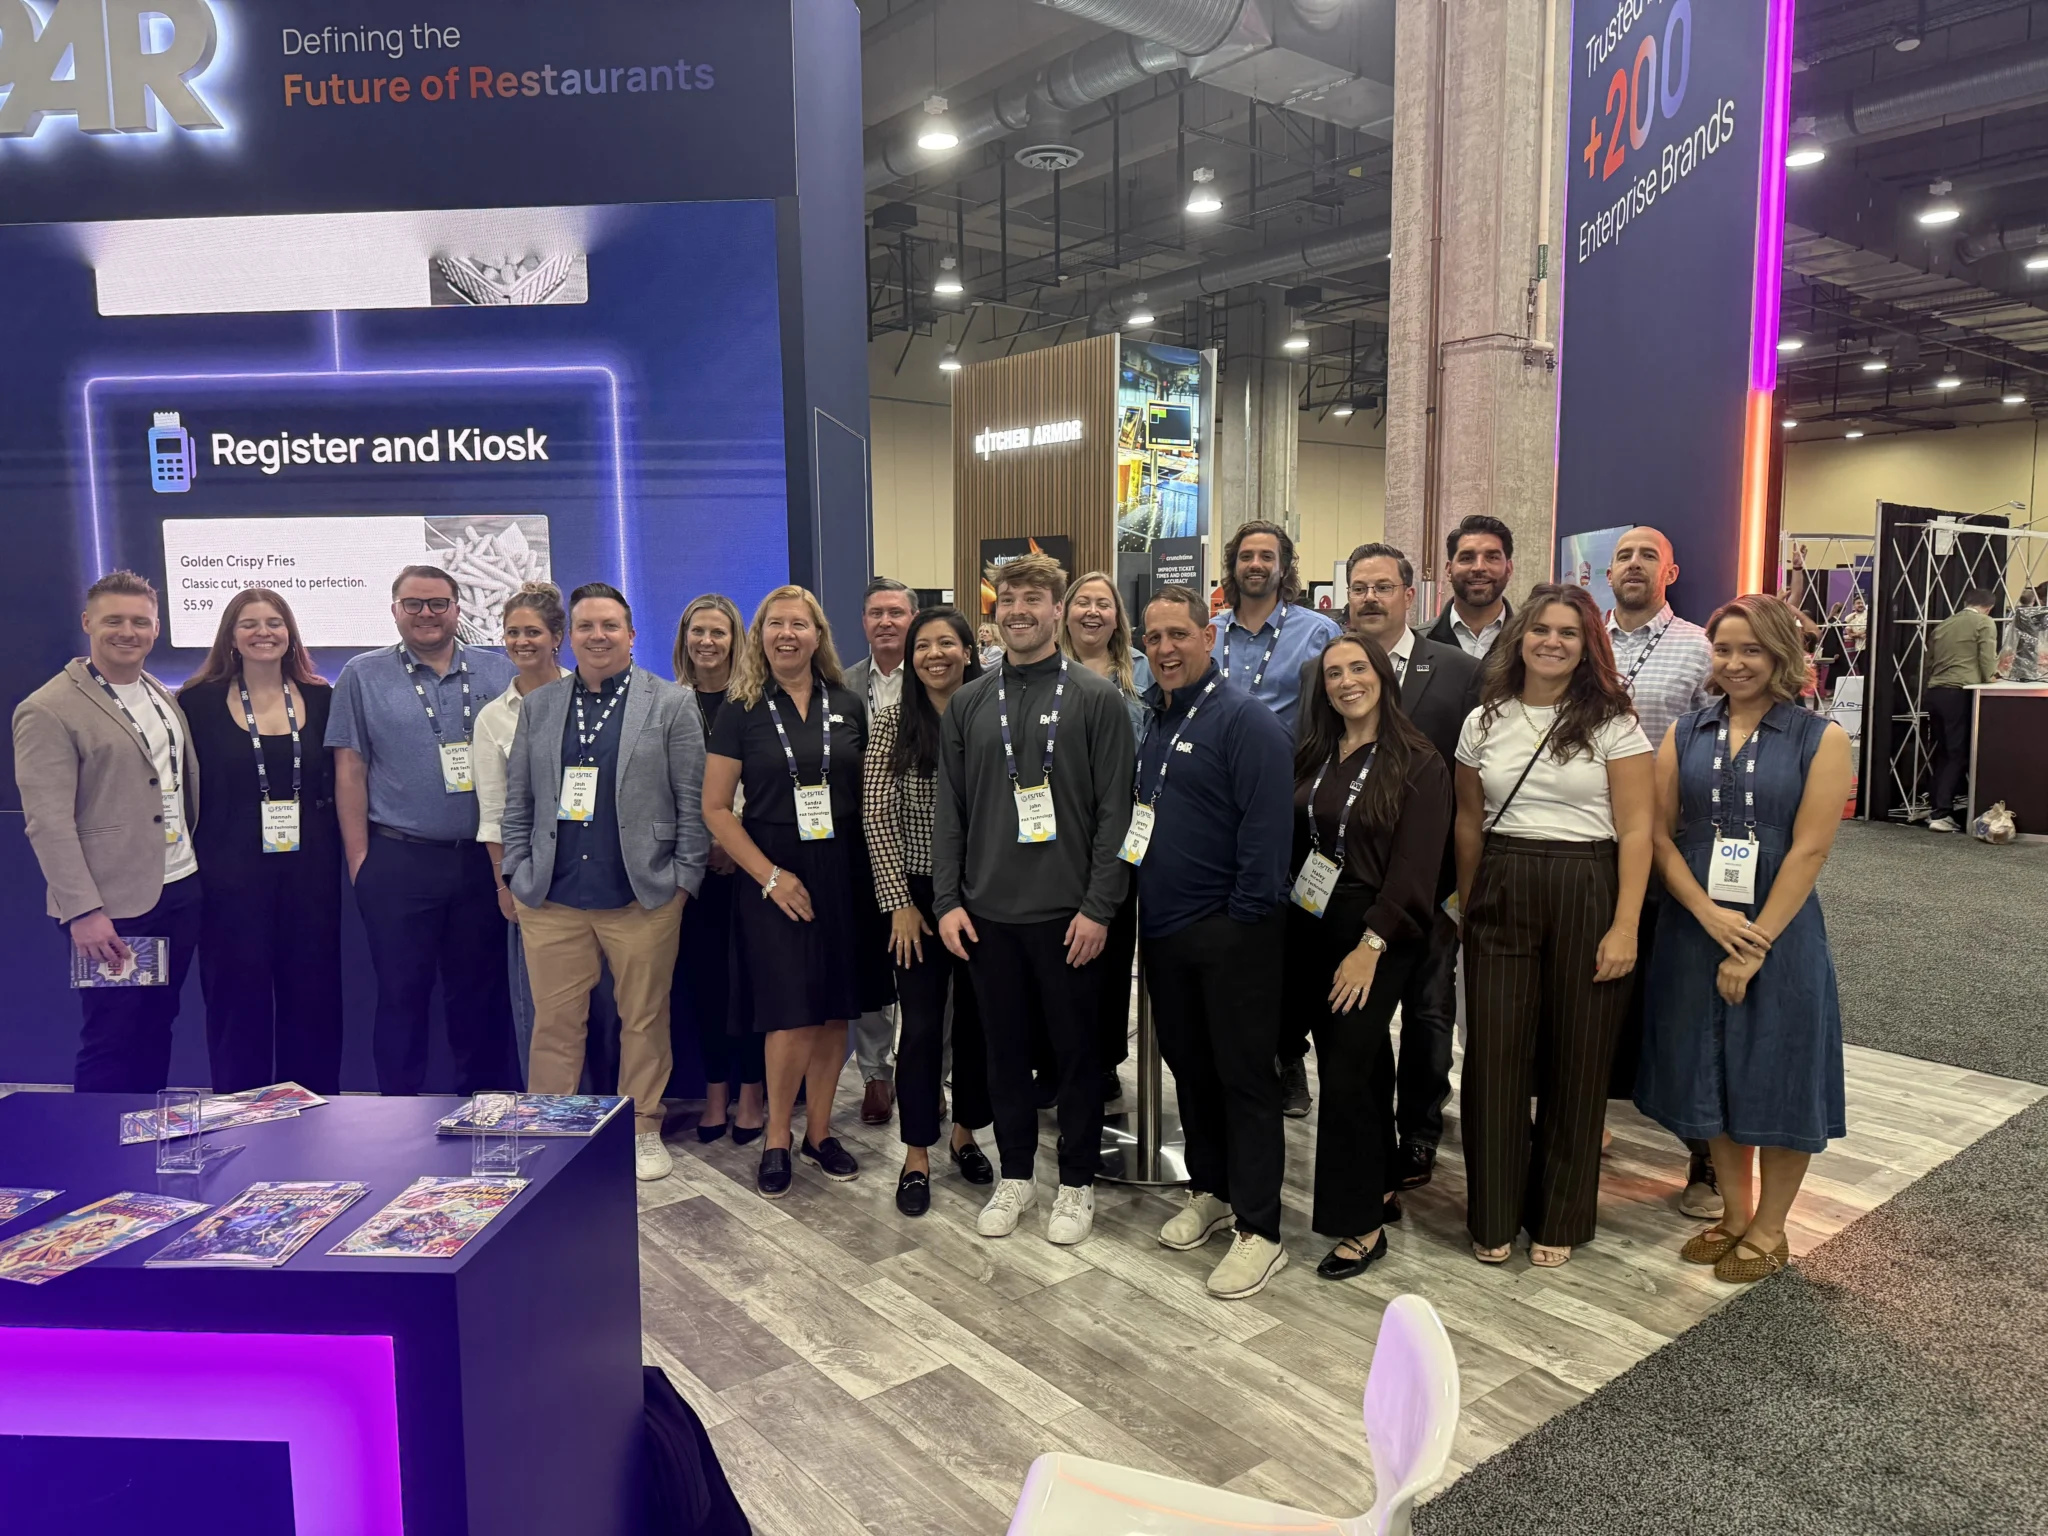
FSTEC is where the restaurant industry comes to see what’s actually shipping — not what’s on a roadmap slide. This year, PAR Restaurant is bringing four launches to Booth #311, and each one is live at the booth.
Here’s what we’re unveiling, where we’re speaking, and how to find us.
The bigger picture: better products, better together
Before the individual launches, it’s worth naming the thread that connects them.
PAR Restaurant brings together the essential systems enterprise restaurants rely on: PAR POS, PAR Ordering, PAR Punchh, PAR Pay, PAR OPS, and hardware from terminal to drive-thru. Both in-store and above-store guest experiences and operations run from the same foundation.
That matters for everything below. None of these four launches is a standalone product bolted onto a stack. Each one is built on the systems already running the restaurant.
- Guest360: recognize every guest, not just the loyal ones
Live now, rolling out to Punchh customers through the end of the year
Most restaurant brands can only market to the guests who enrolled in loyalty. Everyone else stays anonymous, and that’s a large majority of the people walking in the door.
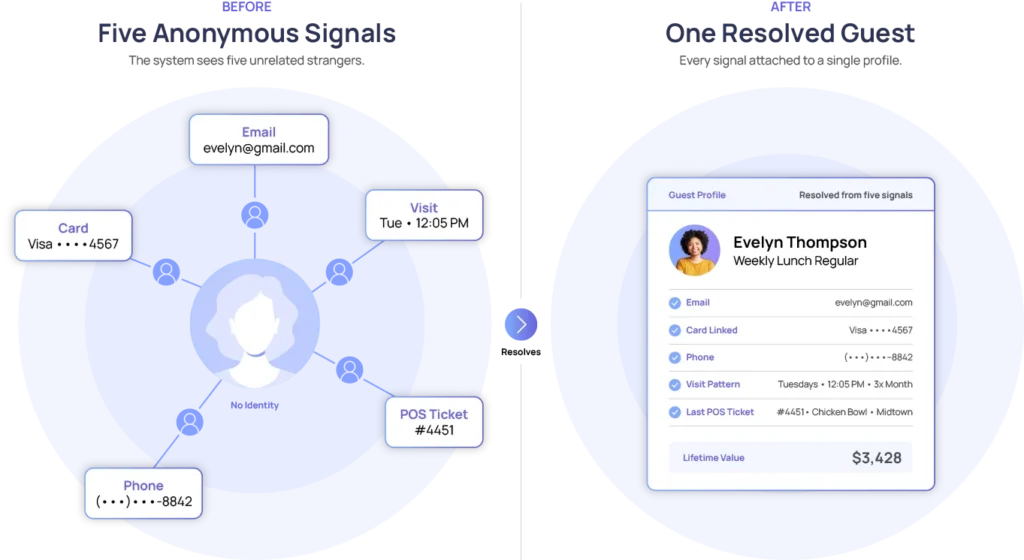
Guest360 is PAR’s customer data and activation platform, and it closes that gap. It recognizes guests without waiting for enrollment, then connects their activity into one continuously updated profile. A POS transaction, a mobile order, a card, a phone number, a store visit: Profile Stitching resolves those signals into a single identity, confidence-scored and auditable.
From there the profile becomes something you can act on. Frequency, spend, lifecycle stage, and menu preference roll up into living audiences that trigger campaigns in Punchh. Results tie back to visits, POS revenue, and item-level sales rather than modeled estimates.
At the booth
Watch an anonymous transaction become a guest. We’ll build a live guest record in real time from disconnected restaurant activity, create behavioral audiences spanning loyalty and non-loyalty guests, then activate a campaign and measure the revenue.
Guest360 is live today and will be included with Punchh, working seamlessly alongside it. It’s rolling out to Punchh customers through the end of the year, and was co-developed with customers in PAR’s product advisory group.
- PAR Handheld: the POS goes where service happens
In pilot now. Launching October 6.
Service has outgrown the fixed terminal. PAR Handheld brings order, payment, and loyalty together on one device so teams can close the transaction where the guest already is, whether that means stepping into the line where it forms or staying with the table without leaving the section.
The important part isn’t that it’s a handheld. It’s that it is the PAR POS. Same menus, same payments, same loyalty, same reporting and management as the terminal behind the counter. Not another system to certify and keep in sync, but the full PAR ecosystem behind it from day one. It runs on the Verifone Victa with PCI-certified payments and all-shift battery life.
At the booth
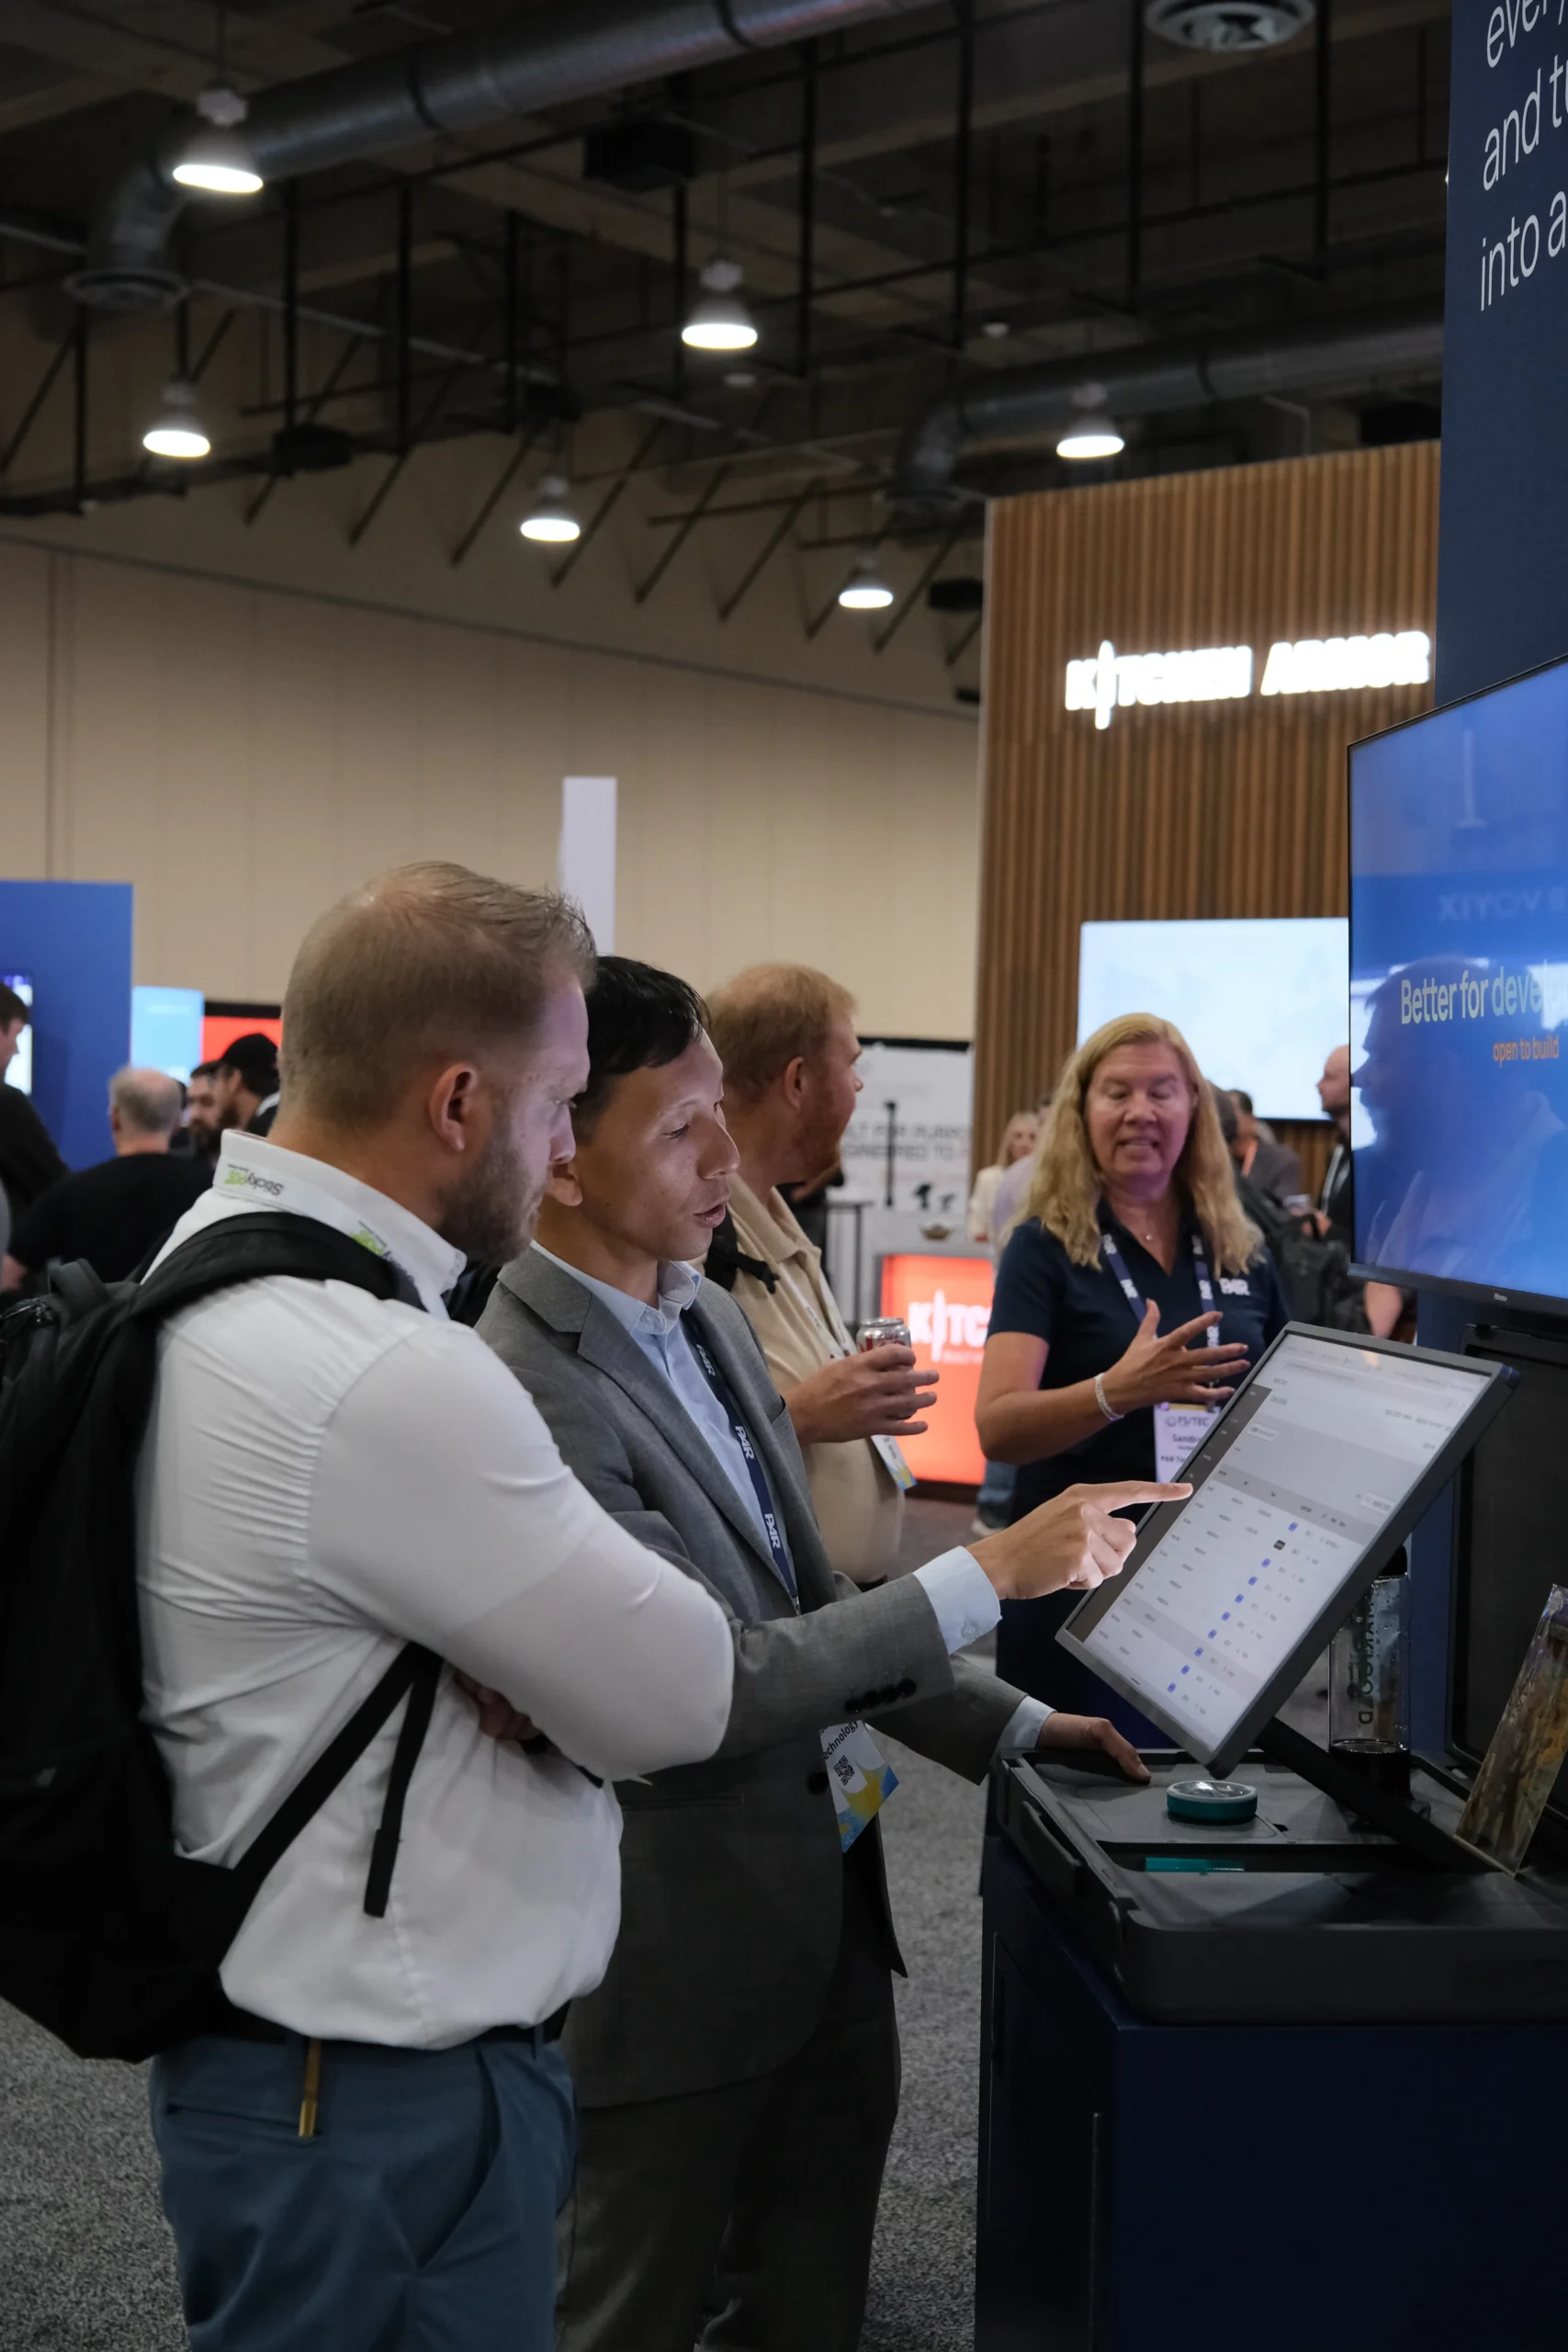
One interaction, start to finish. We take a live order, you tap to pay on the device, and we recognize a loyalty member and redeem a reward — then we show you the same order landing in the fixed terminal, the KDS, and reporting.
PAR Handheld is available for PAR POS customers across quick service, fast casual, and casual dining, and pairs with PAR Ordering, PAR Pay, and PAR Punchh. It’s currently in beta with a 1,000+ location national coffee brand, running at peak.
- PAR Intelligence: the whole restaurant, in one answer
A first look at where PAR Intelligence is headed — live at Booth #311.
Ask a GM why drive-thru speed of service slipped last week and the answer is almost never in one system. A new LTO the crew is still learning. Traffic running above forecast. A noon peak scheduled two below coverage. Three small signals stacking in the same window, sitting in three different places. By the time anyone connects them, the week is over.
Every system in the restaurant is good at its own job. The POS knows the transaction. Loyalty knows the guest. Ordering knows the channel. Labor knows the shift. But the decisions that actually move the business live between those systems — which means today they get made on instinct.
PAR Intelligence is our answer to that gap: connect the signals across the restaurant, then put intelligence to work on top of them.
It takes two shapes. Coaches are the strategizers. Each one watches a specific area of the business, grounded in your brand’s own data, and turns what it sees into answers, insights, and recommendations. Loyalty. Ordering. POS. Drive-thru. Labor. Inventory. You own the products; you add the Coaches that watch them. Assist is the executor. Grounded in the product it lives inside, it speeds up the work your team already does — answering questions, building a segment, updating hours across locations, finishing work faster.
The compounding step is when the two meet. A Coach surfaces the problem and explains the cause. Assist stages the fix inside the product where the work actually happens, pre-populated and waiting on a human to review and publish. Nothing fires without someone approving it.
Why PAR: the model isn’t the advantage — the context is. Anyone can prompt a model. The real question is how much of the restaurant it can see. POS-first platforms see the transaction and infer the guest. Guest-first platforms see loyalty and infer the operation. PAR owns both sides — POS, ordering, loyalty, payments, and operations — which is what makes an answer that spans them possible at all. It’s also the hardest thing for a single-product vendor to copy.
At the booth
We’re demoing where this goes. You’ll see the connected operating picture, meet the bench of Coaches, and watch one work an issue end to end — surface it, explain the cause, then hand the fix to Assist for approval. It’s a vision environment built to make the direction concrete, so you can tell us where we’ve got it right and where we haven’t.
- A reimagined in-store experience, starting with the new PAR Kitchen Display System
New KDS experience at the booth. The in-store operating system is in development, with availability coming in 2027.
Most of what determines whether a restaurant has a good shift is invisible. Not the screens themselves, but what happens underneath them: whether an 86 reaches every channel, whether the kitchen keeps working when the connection doesn’t, whether the counter and the line are looking at the same thing.
PAR is rebuilding that layer. We’re developing an in-store operating system designed to keep every screen, device, and decision running from inside the restaurant, so service doesn’t wait on the internet. It’s infrastructure, which means there’s nothing to look at. But it’s the reason the products built on it behave differently, and PAR POS is being rebuilt on it too: the same point of sale your teams already run, on a new foundation.
Critically, it’s designed to run alongside the POS already on the counter. Nothing to rip out, nothing to migrate.
The first product built on it is thenew PAR Kitchen Display System, and that part you can see.
At the booth
A first look at the redesigned KDS experience. Tickets that show the build as it happens, with color-coded aging and clear step-by-step instructions on the line, plus live station pacing so expo and the kitchen are working from the same picture. It’s a genuinely new interface for the screen your kitchen stares at all day, and it’s the concrete, visible piece of the operating system work.
Where to find us on the agenda
Two sessions, both worth putting on your schedule.
General Session:
The Best Store, the Worst Store, and the Context Between Them
Wednesday, September 23, 2026 • 3:30–4:00 PM CT
Grapevine Ballroom A-D
Joe Yetter
President, PAR Restaurant
Chakri Somisetti
Vice President IT, RBI
Chris Padilla
Chief Information Officer, Dine Brands
Across a fleet of locations, some stores consistently grow same-store sales and protect margin while others fall behind. The answers are hiding in the context behind the data.
Most operators have spent years unifying their systems and now have more data than ever. But data tells you what happened, not why it happened or what to do about it.
Joe Yetter is joined by technology leaders from two very different sides of the industry, quick service and full service, to explore how restaurant brands are modernizing past unified commerce and using technology to guide where they invest, how they grow comps, and how they defend margin across every location.
Thirty minutes, real operators, no product pitch. Come with questions.
Innovation Forum:
2026 Restaurant Tech Mega Trends & Hot Takes
Thursday, September 24, 2026 · 9:15–10:00 AM CT
Innovation Forum
Joe Yetter
President, PAR Restaurant
Josh Schoonmaker
SVP of Product, PAR Restaurant
Warning: this session is not a sales pitch.
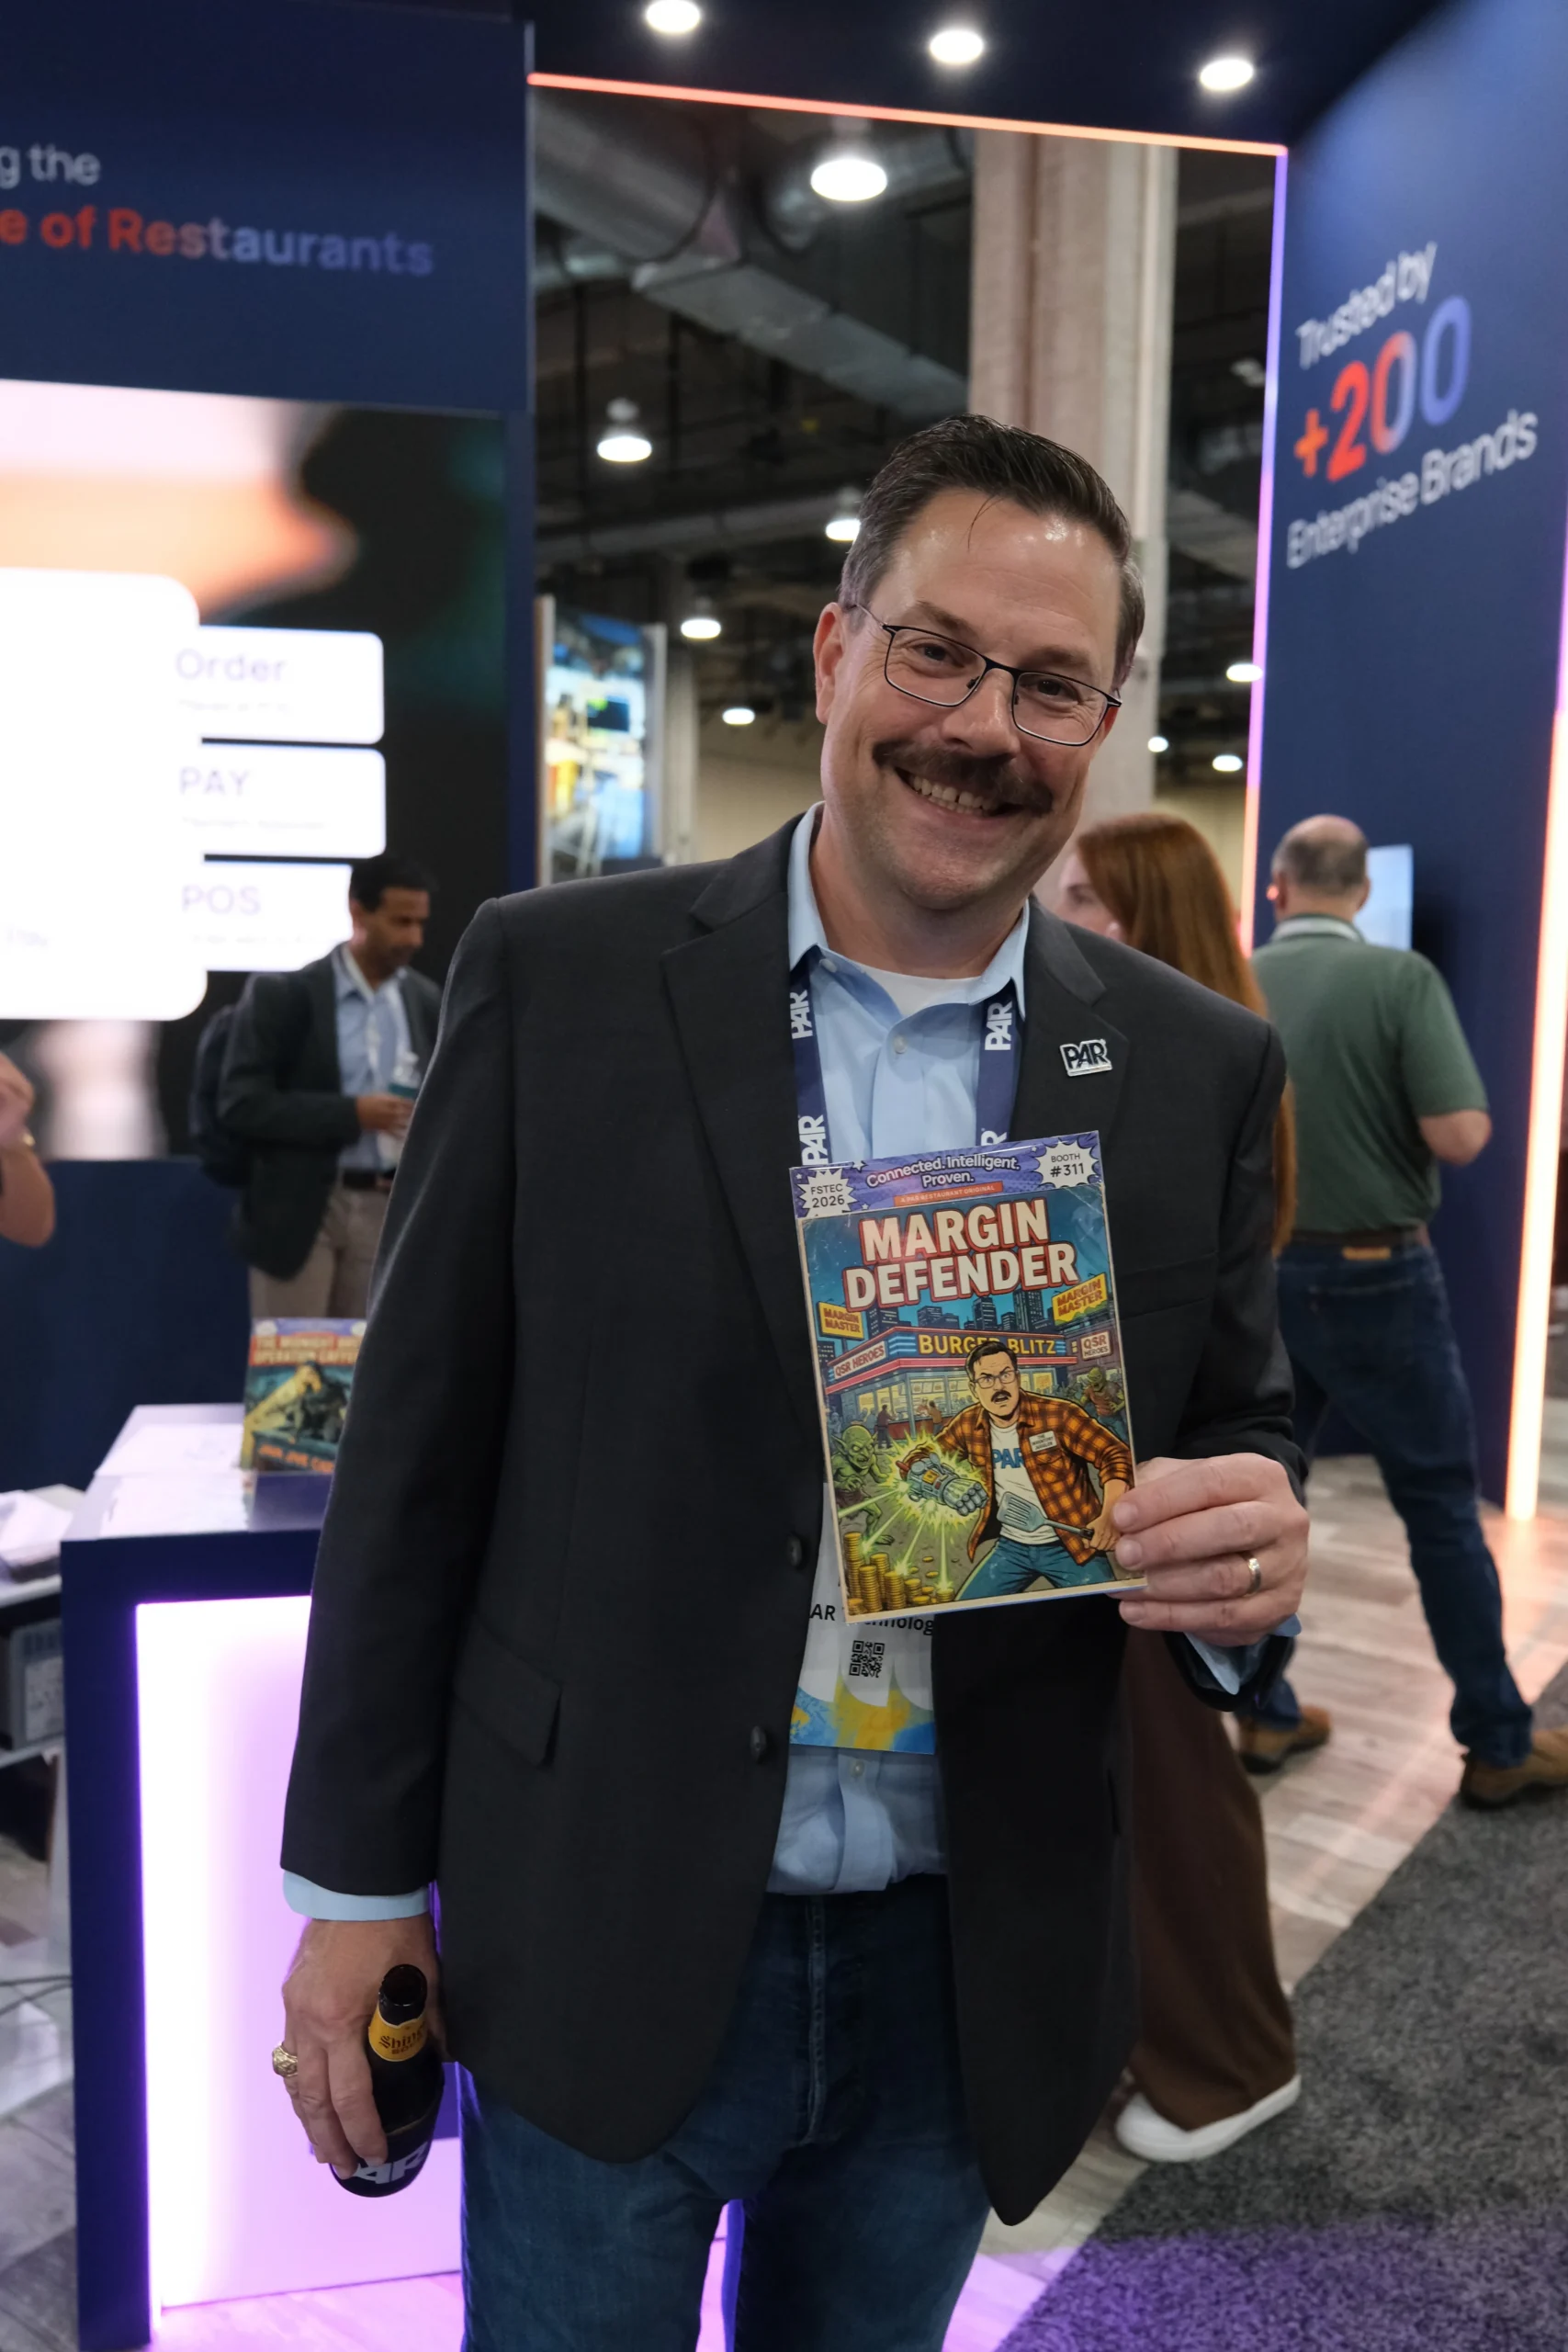
Back for the third year, Joe Yetter returns with unique data, non-consensus predictions, and too many AI-generated images to cut through the industry noise and explore the real trends shaping restaurant technology in 2026.
This year, Joe is joined by Josh Schoonmaker, PAR’s Head of Product, for a conversation grounded in insights from 300+ brands, exploring topics across the full stack — from operations, engagement, and performance to emerging technologies like AI.
The goal: offer a unique perspective on what’s next, challenge conventional thinking, and separate the real signals from the hype.
Find us at Booth #311
All four launches are demo-ready at the booth. If you want the walkthrough rather than the highlight reel, come see us.
Booth #311 Gaylord Texan, Grapevine, TX September 23–25, 2026
We’d love to walk your team through everything new at the booth!
See you in Grapevine.
Categories
AI (4) Back-of-House (43) Blog (60) Casino (1) Catering (1) Content Hub (2) Convenience and Fuel Retail (73) Drive-Thru (16) Fast Casual (20) Front-of-House (16) Hardware-as-a-Service (HaaS) (1) Integration Partners (11) Loyalty (15) Online Ordering (21) PAR (11) Partner Ecosystem (1) Payment Services (24) POS Software (27) Quick Service (QSR) (26) Quick Service (QSR) (14) Restaurant Hardware (13) All Posts
EnglishFrançais
 en