Oct. 29, 2026 Download Download Reports Third Quarter Sales of $2.84 billion, up 5.7 Percent Reports Third Quarter Earnings per Share of $2.22 and Adjusted1 Earnings per Share of $2.41 Updates Outlook for 2026 to Reflect Lower Fire Truck Production…
Oct. 29, 2026
Download
Download
Reports Third Quarter Sales of $2.84 billion, up 5.7 Percent
Reports Third Quarter Earnings per Share of $2.22 and Adjusted1 Earnings per Share of $2.41
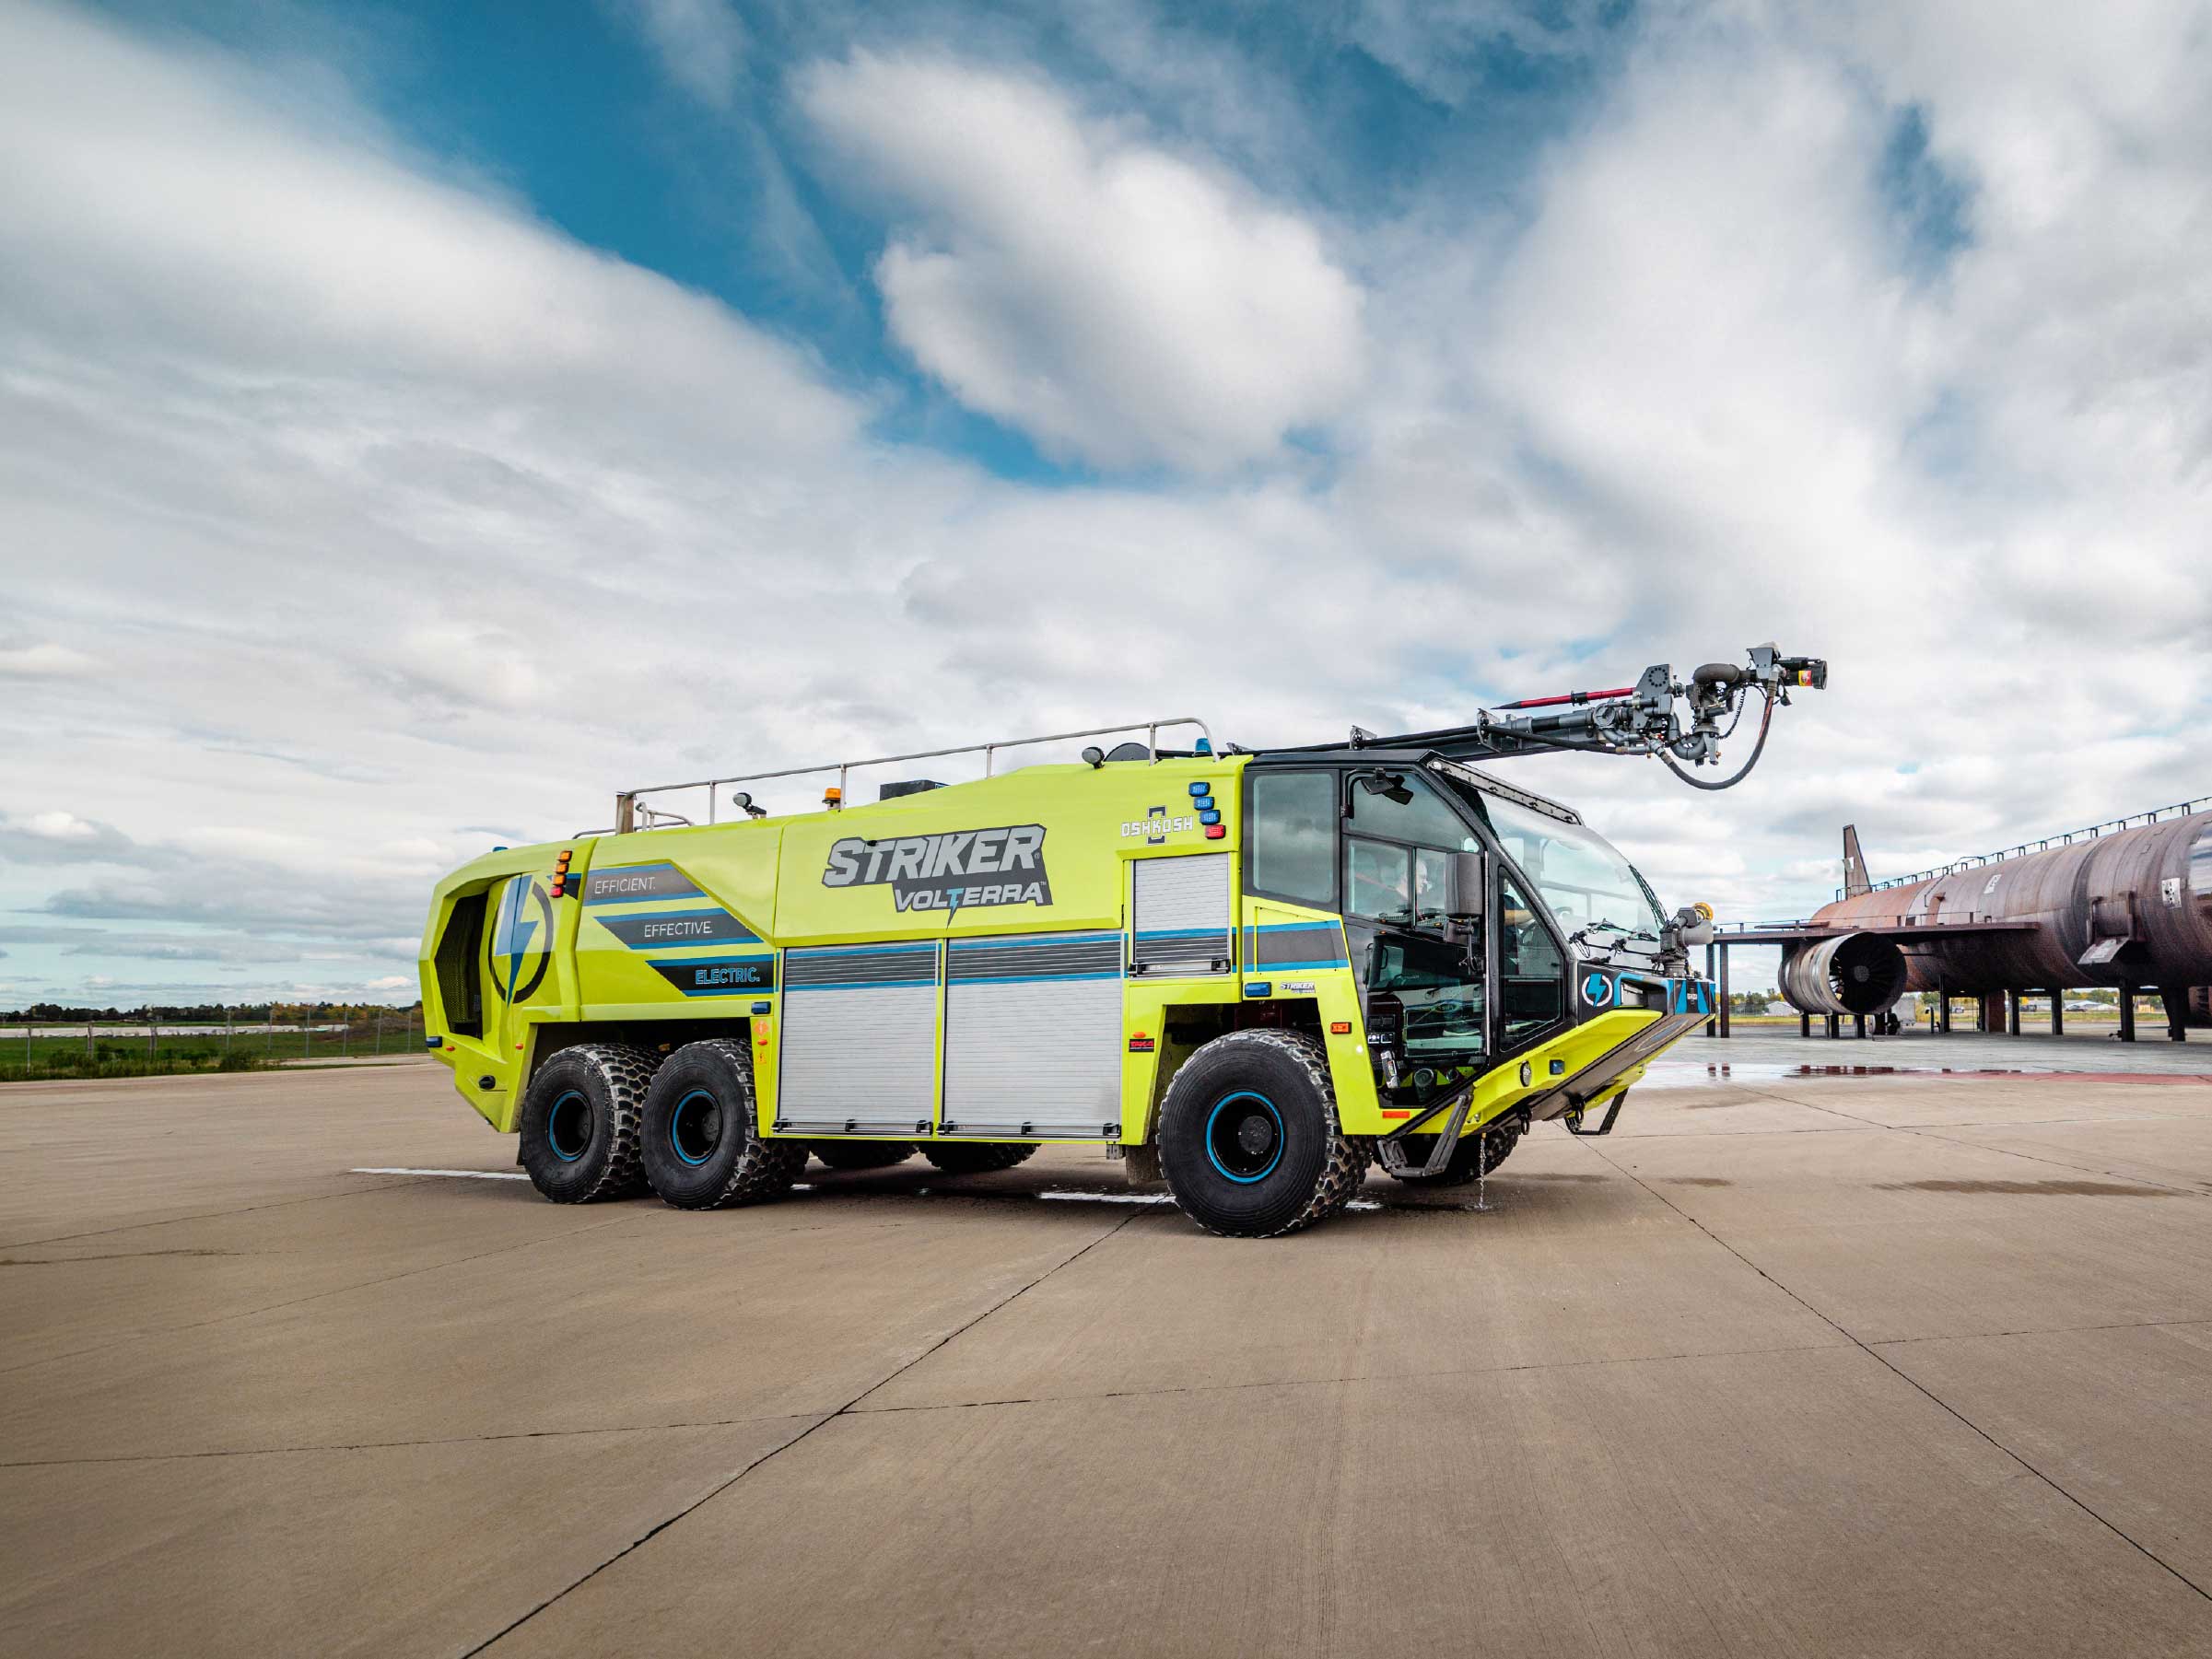
Updates Outlook for 2026 to Reflect Lower Fire Truck Production
OSHKOSH, Wis.--(BUSINESS WIRE)-- Oshkosh Corporation (NYSE: OSK), a leading innovator of purpose-built vehicles and equipment, today reported 2026 third quarter net income of $138.4 million, or $2.22 per diluted share, compared to net income of $196.2 million, or $3.04 per diluted share, for the third quarter of 2025. Adjusted1 net income was $150.1 million, or $2.41 per diluted share, for the third quarter of 2026 compared to $206.6 million, or $3.20 per diluted share, for the third quarter of 2025. Comparisons in this news release are to the third quarter of 2025, unless otherwise noted.
Consolidated sales in the third quarter of 2026 increased $153.0 million, or 5.7 percent, to $2.84 billion primarily due to higher sales volume in the Access segment and improved pricing in all three segments, offset by lower sales volume in the Vocational segment.
Consolidated operating income in the third quarter of 2026 decreased 24.3 percent to $197.1 million, or 6.9 percent of sales, compared to $260.4 million, or 9.7 percent of sales, in the third quarter of 2025. The decrease was primarily due to unfavorable sales mix and higher selling, general and administrative expenses, offset in part by higher sales volume and improved price/cost dynamics.
Adjusted1 operating income in the third quarter of 2026 decreased 20.9 percent to $216.9 million, or 7.6 percent of sales, compared to $274.3 million, or 10.2 percent of sales, in the third quarter of 2025.
“Our results reflected challenges arising from our transformation of fire truck production. Improvements in throughput are taking longer than we previously expected, and we have identified the primary factors that affected production. We are taking focused actions to improve material flow and strengthen production scheduling, and we believe this is a near-term issue. We delivered solid performance in our Access segment during the third quarter, reflecting strong customer demand and improved execution,” said John Pfeifer, president and chief executive officer of Oshkosh Corporation.
“Given our short-term challenges in fire truck production, we are lowering our full-year expectation for adjusted earnings per share to a range of $8.50 to $9.50. Our backlog for fire trucks remains elevated, and we remain confident that the actions we are taking as we move to high-flow lines will result in increased production levels over time, supporting a strong outlook for fire trucks and returns in the Vocational segment consistent with our long-term expectations.
“We remain focused on disciplined execution and continue to believe our strong market positions, differentiated products and investments in technology and manufacturing capabilities position Oshkosh well for success in the future,” added Pfeifer.
Factors affecting third quarter results for the Company’s business segments included:
Access - Access segment sales for the third quarter of 2026 increased $229.9 million, or 20.7 percent, to $1.34 billion primarily due to higher sales volume in North America and improved pricing.
Access segment operating income in the third quarter of 2026 increased 23.5 percent to $145.7 million, or 10.9 percent of sales, compared to $118.0 million, or 10.6 percent of sales, in the third quarter of 2025. The increase was primarily due to higher sales volume, offset in part by adverse sales mix and higher incentive compensation accruals.
Adjusted1 operating income in the third quarter of 2026 was $149.9 million, or 11.2 percent of sales, compared to $121.8 million, or 11.0 percent of sales, in the third quarter of 2025.
Vocational - Vocational segment sales for the third quarter of 2026 decreased $68.1 million, or 7.0 percent, to $899.9 million primarily due to lower sales volume, offset in part by improved pricing. Lower fire apparatus production compared with last year and the second quarter of 2026 reflected challenges associated with initiatives to modernize fire apparatus manufacturing.
Vocational segment operating income in the third quarter of 2026 decreased 38.2 percent to $87.6 million, or 9.7 percent of sales, compared to $141.7 million, or 14.6 percent of sales, in the third quarter of 2025. The decrease was primarily due to lower sales volume, higher selling, general and administrative expenses and higher manufacturing overhead including costs related to the fire apparatus manufacturing initiatives.
Adjusted1 operating income in the third quarter of 2026 was $102.4 million, or 11.4 percent of sales, compared to $151.1 million, or 15.6 percent of sales, in the third quarter of 2025.
Transport - Transport segment sales for the third quarter of 2026 decreased $25.9 million, or 4.4 percent, to $562.0 million primarily due to a license of JLTV-related intellectual property to the U.S. government in the third quarter of 2025.
Transport segment operating income in the third quarter of 2026 decreased 77.6 percent to $8.2 million, or 1.5 percent of sales, compared to $36.6 million, or 6.2 percent of sales, in the third quarter of 2025. The decrease was primarily the result of the license of intellectual property of $25.0 million in the third quarter of 2025. In addition, improved pricing and lower warranty costs were offset by adverse sales mix and higher production costs.
Corporate and other - Net operating costs for corporate and other in the third quarter of 2026 increased $8.5 million to $44.4 million primarily due to the timing of healthcare charges between Corporate and the segments.
Miscellaneous, net- Miscellaneous income, net in the third quarter of 2026 was $5.8 million compared to $6.1 million in the third quarter of 2025. The third quarter of 2026 included the recognition of an indemnification receivable related to a recapture of a purchased federal income tax credit. The third quarter of 2025 included unrealized gains on investments.
Provision for Income Taxes - The Company recorded income tax expense in the third quarter of 2026 of $40.5 million, or 22.8 percent of pre-tax income, compared to $41.7 million, or 17.5 percent of pre-tax income, in the third quarter of 2025. Income taxes in the third quarter of 2026 included a $5.4 million discrete tax charge related to the recapture of a purchased federal income tax credit, which is subject to indemnification, as well as a $4.0 million discrete tax benefit related to the expiration of the statute of limitations for a foreign anti-hybrid tax matter. Income taxes in the third quarter of 2025 included a benefit of $19.1 million from the resolution of a multi-year U.S. federal income tax audit.
Repurchases of Common Stock - The Company repurchased 556,138 shares of common stock in the third quarter of 2026 for $82.4 million. Share repurchases completed during the previous twelve months benefited earnings per share in the third quarter of 2026 by $0.08 compared to the third quarter of 2025.
Dividend Announcement
The Company’s Board of Directors today declared a quarterly cash dividend of $0.57 per share of Common Stock. The dividend will be payable on November 30, 2026, to shareholders of record as of November 16, 2026.
Nine-Month Results
The Company reported net sales for the first nine months of 2026 of $8.07 billion and net income of $364.7 million, or $5.81 per diluted share. This compares with net sales of $7.73 billion and net income of $513.2 million, or $7.92 per diluted share, for the nine months ended September 30, 2025. The decrease in net income for the first nine months of 2026 compared to the nine months ended September 30, 2025, was primarily due to unfavorable sales mix, higher manufacturing overhead costs and higher selling, general and administrative expenses, offset in part by higher sales volume and improved price/cost dynamics. Share repurchases completed during the previous twelve months benefited earnings per share in the first nine months of 2026 by $0.18 compared to the first nine months of 2025.
Adjusted1 net income for the first nine months of 2026 was $384.0 million, or $6.12 per diluted share, compared to $552.0 million, or $8.52 per diluted share, for the nine months ended September 30, 2025.
2026 Expectations
The Company now expects its 2026 diluted earnings per share to be between $8.00 and $9.00 and its adjusted1 earnings per share to be between $8.50 and $9.50, down between $1.50 and $2.50 from its most recent guidance. The Company now expects net sales to be approximately $11.0 billion in 2026, down $0.2 billion from its previous guidance. The Company's revised expectations reflect lower fire apparatus and NGDV production, offset in part by higher sales volume in the Access segment. The bottom end of the earnings per share range also reflects the possibility that we do not receive an NGDV order in 2026, which could impact earnings by up to $0.50 per share.
Conference Call
The Company will host a conference call at 9:30 a.m. EDT this morning to discuss its third quarter 2026 results and 2026 expectations. Slides for the call will be available on the Company’s website beginning at 7:00 a.m. EDT this morning. The call will be simultaneously webcast. To access the webcast, go to oshkoshcorp.com at least 15 minutes prior to the event and follow instructions for listening to the webcast. An audio replay of the call and related question and answer session will be available for 12 months at this website.
Forward-Looking Statements
This news release contains statements that the Company believes to be “forward-looking statements” within the meaning of the Private Securities Litigation Reform Act of 1995. All statements other than statements of historical fact, including, without limitation, statements regarding the Company’s future financial position, business strategy, growth and drivers, capital allocation, resiliency, targets, projected sales, costs, margins, earnings, capital expenditures, debt levels and cash flows, and plans and objectives of management for future operations, are forward-looking statements. When used in this news release, words such as “may,” “will,” “expect,” “intend,” “estimate,” “anticipate,” “believe,” “should,” “project,” “confident” or “plan” or the negative thereof or variations thereon or similar terminology are generally intended to identify forward-looking statements. These forward-looking statements are not guarantees of future performance and are subject to risks, uncertainties, assumptions and other factors, some of which are beyond the Company’s control, which could cause actual results to differ materially from those expressed or implied by such forward-looking statements. These factors include the cyclical nature of the Company’s access equipment, fire apparatus, refuse and recycling collection vehicle and air transportation equipment markets, which are particularly impacted by the strength of U.S. and European economies and construction outlooks; the Company’s estimates of access equipment demand which, among other factors, is influenced by historical customer buying patterns and rental company fleet replacement strategies; the Company's ability to predict the level and timing of orders and costs on the U.S. Postal Service contract; the Company's ability to increase production rates in its municipal fire apparatus and delivery vehicle businesses; risks that trade wars and related tariffs could further reduce demand for or competitiveness of the Company’s products or cause inefficiencies in the Company's supply chain; the Company’s ability to increase prices to raise margins or to offset higher input costs; the Company's ability to achieve its projected material and manufacturing efficiency savings; the Company's ability to accurately predict future input costs associated with U.S. Department of Defense contracts; the Company’s ability to attract and retain production labor in a timely manner; the strength of the U.S. dollar and its impact on Company exports, translation of foreign sales and the cost of purchased materials; the impact of severe weather, war, natural disasters or pandemics that may affect the Company, its suppliers or its customers; budget uncertainty for the U.S. federal government, including risks of future budget cuts, the impact of continuing resolution funding mechanisms or a prolonged federal government shutdown; the impact of any U.S. Department of Defense solicitation for competition for future contracts to produce military vehicles; risks related to the collectability of receivables, particularly for those businesses with exposure to construction markets; the cost of any warranty campaigns related to the Company’s products; risks associated with international operations and sales, including compliance with the Foreign Corrupt Practices Act; the Company’s ability to comply with complex laws and regulations applicable to U.S. government contractors; cybersecurity risks and costs of defending against, mitigating and responding to data security threats and breaches impacting the Company; the Company’s ability to successfully identify, complete and integrate acquisitions and to realize the anticipated benefits associated with the same; and risks related to the Company’s ability to successfully execute on its strategic road map and meet its long-term financial goals. Additional information concerning these and other factors is contained in the Company’s filings with the Securities and Exchange Commission, including its most recent Form 10-K. All forward-looking statements speak only as of the date of this news release. The Company assumes no obligation, and disclaims any obligation, to update information contained in this news release. Investors should be aware that the Company may not update such information until the Company’s next quarterly earnings conference call, if at all.
About Oshkosh Corporation
At Oshkosh (NYSE: OSK), we make innovative, purpose-built equipment to help everyday heroes advance communities around the world. Headquartered in Wisconsin, Oshkosh Corporation employs over 18,000 team members worldwide, all united behind a common purpose: to make a difference in people’s lives. Oshkosh products can be found in more than 150 countries under the brands of JLG®, Pierce®, MAXIMETAL, Oshkosh® S-Series™, McNeilus®, IMT®, Jerr-Dan®, Frontline™ Communications, Oshkosh® Airport Products, Oshkosh AeroTech™, Oshkosh® Defense and Pratt Miller. For more information, visit oshkoshcorp.com.
| 1 This news release refers to GAAP (U.S. generally accepted accounting principles) and non-GAAP financial measures. Oshkosh Corporation believes that the non-GAAP measures provide investors a useful comparison of the Company’s performance to prior period results. These non-GAAP measures may not be comparable to similarly-titled measures disclosed by other companies. A reconciliation of the Company’s presented non-GAAP measures to the most directly comparable GAAP measures can be found under the caption “Non-GAAP Financial Measures” in this news release. |
| ®, ™ All brand names referred to in this news release are trademarks of Oshkosh Corporation or its subsidiary companies. |
| OSHKOSH CORPORATION |
| CONDENSED CONSOLIDATED STATEMENTS OF INCOME |
| (In millions, except share and per share amounts; unaudited) |
| | Three Months Ended September 30, | | Nine Months Ended September 30, |
| | 2026 | | 2025 | | 2026 | | 2025 |
| Net sales | $ | 2,841.6 | | | $ | 2,688.6 | | | $ | 8,074.5 | | | $ | 7,733.5 | |
| Cost of sales | | 2,401.3 | | | | 2,218.1 | | | | 6,842.0 | | | | 6,338.6 | |
| Gross income | | 440.3 | | | | 470.5 | | | | 1,232.5 | | | | 1,394.9 | |
| | | | | | | | | | | | |
| Operating expenses: | | | | | | | | | | | |
| Selling, general and administrative | | 228.9 | | | | 196.2 | | | | 667.2 | | | | 620.5 | |
| Amortization of purchased intangibles | | 14.3 | | | | 13.9 | | | | 43.0 | | | | 41.2 | |
| Intangible asset impairment | | — | | | | — | | | | — | | | | 5.7 | |
| Total operating expenses | | 243.2 | | | | 210.1 | | | | 710.2 | | | | 667.4 | |
| Operating income | | 197.1 | | | | 260.4 | | | | 522.3 | | | | 727.5 | |
| | | | | | | | | | | | |
| Other income (expense): | | | | | | | | | | | |
| Interest expense | | (30.9 | ) | | | (30.6 | ) | | | (91.4 | ) | | | (87.7 | ) |
| Interest income | | 5.9 | | | | 2.5 | | | | 13.9 | | | | 6.5 | |
| Miscellaneous, net | | 5.8 | | | | 6.1 | | | | 7.5 | | | | 13.9 | |
| Income before income taxes and earnings (losses) of unconsolidated affiliates | | 177.9 | | | | 238.4 | | | | 452.3 | | | | 660.2 | |
| Provision for income taxes | | 40.5 | | | | 41.7 | | | | 88.2 | | | | 143.7 | |
| Income before earnings (losses) of unconsolidated affiliates | | 137.4 | | | | 196.7 | | | | 364.1 | | | | 516.5 | |
| Equity in earnings (losses) of unconsolidated affiliates | | 1.0 | | | | (0.5 | ) | | | 0.6 | | | | (3.3 | ) |
| Net income | $ | 138.4 | | | $ | 196.2 | | | $ | 364.7 | | | $ | 513.2 | |
| | | | | | | | | | | | |
| Earnings per share: | | | | | | | | | | | |
| Basic | $ | 2.24 | | | $ | 3.06 | | | $ | 5.85 | | | $ | 7.96 | |
| Diluted | | 2.22 | | | | 3.04 | | | | 5.81 | | | | 7.92 | |
| | | | | | | | | | | | |
| Basic weighted-average shares outstanding | | 61,851,946 | | | | 64,123,621 | | | | 62,367,550 | | | | 64,481,466 | |
| Dilutive equity-based compensation awards | | 392,654 | | | | 469,920 | | | | 392,708 | | | | 329,495 | |
| Diluted weighted-average shares outstanding | | 62,244,600 | | | | 64,593,541 | | | | 62,760,258 | | | | 64,810,961 | |
| OSHKOSH CORPORATION |
| CONDENSED CONSOLIDATED BALANCE SHEETS |
| (In millions; unaudited) |
| | September 30, | | December 31, |
| | 2026 | | 2025 |
| Assets | | | | | |
| Current assets: | | | | | |
| Cash and cash equivalents | $ | 558.0 | | | $ | 479.8 | |
| Receivables, net | | 1,639.0 | | | | 1,456.1 | |
| Unbilled receivables, net | | 807.6 | | | | 702.7 | |
| Inventories | | 2,280.2 | | | | 2,375.0 | |
| Income taxes receivable | | 44.2 | | | | 52.4 | |
| Other current assets | | 105.4 | | | | 102.5 | |
| Total current assets | | 5,434.4 | | | | 5,168.5 | |
| Property, plant and equipment: | | | | | |
| Property, plant and equipment | | 2,581.4 | | | | 2,571.7 | |
| Accumulated depreciation | | (1,337.4 | ) | | | (1,300.5 | ) |
| Property, plant and equipment, net | | 1,244.0 | | | | 1,271.2 | |
| Goodwill | | 1,436.0 | | | | 1,448.1 | |
| Purchased intangible assets, net | | 689.1 | | | | 734.8 | |
| Deferred income taxes | | 182.3 | | | | 201.0 | |
| Deferred contract costs | | 783.2 | | | | 825.5 | |
| Other non-current assets | | 486.5 | | | | 423.3 | |
| Total assets | $ | 10,255.5 | | | $ | 10,072.4 | |
| | | | | | |
| Liabilities and Shareholders’ Equity | | | | | |
| Current liabilities: | | | | | |
| Revolving credit facilities and current maturities of long-term debt | $ | 500.4 | | | $ | 0.6 | |
| Accounts payable | | 1,077.1 | | | | 1,074.2 | |
| Customer advances | | 750.2 | | | | 737.1 | |
| Payroll-related obligations | | 209.3 | | | | 218.4 | |
| Income taxes payable | | 87.7 | | | | 141.3 | |
| Other current liabilities | | 528.1 | | | | 492.8 | |
| Total current liabilities | | 3,152.8 | | | | 2,664.4 | |
| Long-term debt | | 600.7 | | | | 1,100.3 | |
| Non-current customer advances | | 1,332.6 | | | | 1,222.7 | |
| Deferred income taxes | | 22.3 | | | | 25.7 | |
| Other non-current liabilities | | 595.7 | | | | 528.8 | |
| Commitments and contingencies | | | | | |
| Shareholders’ equity | | 4,551.4 | | | | 4,530.5 | |
| Total liabilities and shareholders’ equity | $ | 10,255.5 | | | $ | 10,072.4 | |
| OSHKOSH CORPORATION |
| CONDENSED CONSOLIDATED STATEMENTS OF CASH FLOWS |
| (In millions; unaudited) |
| | Nine Months Ended September 30, |
| | 2026 | | 2025 |
| Operating activities: | | | | | |
| Net income | $ | 364.7 | | | $ | 513.2 | |
| Depreciation and amortization | | 185.6 | | | | 165.8 | |
| Intangible asset impairment | | — | | | | 5.7 | |
| Stock-based incentive compensation | | 33.4 | | | | 29.5 | |
| Deferred income taxes | | 17.1 | | | | 55.0 | |
| Other non-cash adjustments | | 11.7 | | | | (2.2 | ) |
| Changes in operating assets and liabilities | | (79.3 | ) | | | (583.7 | ) |
| Net cash provided by operating activities | | 533.2 | | | | 183.3 | |
| | | | | | |
| Investing activities: | | | | | |
| Additions to property, plant and equipment | | (100.0 | ) | | | (105.6 | ) |
| Additions to equipment held for rental | | (17.3 | ) | | | (32.3 | ) |
| Proceeds from sale of equipment held for rental | | 44.6 | | | | 4.2 | |
| Other investing activities | | (7.3 | ) | | | (2.6 | ) |
| Net cash used in investing activities | | (80.0 | ) | | | (136.3 | ) |
| | | | | | |
| Financing activities: | | | | | |
| Proceeds from issuance of debt | | 600.8 | | | | 3,636.5 | |
| Repayments of debt | | (601.1 | ) | | | (3,392.8 | ) |
| Repurchases of Common Stock | | (221.3 | ) | | | (159.3 | ) |
| Dividends paid | | (106.2 | ) | | | (98.3 | ) |
| Other financing activities | | (44.1 | ) | | | (37.7 | ) |
| Net cash used in financing activities | | (371.9 | ) | | | (51.6 | ) |
| | | | | | |
| Effect of exchange rate changes on cash and cash equivalents | | (3.1 | ) | | | 11.5 | |
| Increase in cash and cash equivalents | | 78.2 | | | | 6.9 | |
| Cash and cash equivalents at beginning of period | | 479.8 | | | | 204.9 | |
| Cash and cash equivalents at end of period | $ | 558.0 | | | $ | 211.8 | |
| OSHKOSH CORPORATION |
| SEGMENT INFORMATION |
| (In millions; unaudited) |
| | Three Months Ended September 30, | | Nine Months Ended September 30, |
| | 2026 | | 2025 | | 2026 | | 2025 |
| Net Sales | | | | | | | | | | | |
| Access | | | | | | | | | | | |
| Aerial work platforms | $ | 658.3 | | | $ | 556.5 | | | $ | 1,824.4 | | | $ | 1,645.3 | |
| Telehandlers | | 320.0 | | | | 260.8 | | | | 791.5 | | | | 830.4 | |
| Other | | 361.3 | | | | 292.4 | | | | 1,040.9 | | | | 847.1 | |
| Total Access | | 1,339.6 | | | | 1,109.7 | | | | 3,656.8 | | | | 3,322.8 | |
| Vocational | | | | | | | | | | | |
| Municipal fire apparatus | | 362.1 | | | | 405.5 | | | | 1,117.5 | | | | 1,133.3 | |
| Airport products | | 269.1 | | | | 251.2 | | | | 753.7 | | | | 722.6 | |
| Refuse and recycling vehicles | | 162.5 | | | | 185.3 | | | | 476.9 | | | | 587.8 | |
| Other | | 106.2 | | | | 126.0 | | | | 343.6 | | | | 360.8 | |
| Total Vocational | | 899.9 | | | | 968.0 | | | | 2,691.7 | | | | 2,804.5 | |
| Transport | | | | | | | | | | | |
| Defense | | 301.2 | | | | 441.6 | | | | 871.9 | | | | 1,226.3 | |
| Delivery vehicles | | 260.8 | | | | 146.3 | | | | 739.0 | | | | 303.7 | |
| Total Transport | | 562.0 | | | | 587.9 | | | | 1,610.9 | | | | 1,530.0 | |
| Corporate and other | | 40.1 | | | | 23.0 | | | | 115.1 | | | | 76.2 | |
| Consolidated | $ | 2,841.6 | | | $ | 2,688.6 | | | $ | 8,074.5 | | | $ | 7,733.5 | |
| | Three Months Ended September 30, | | Nine Months Ended September 30, |
| | 2026 | | 2025 | | 2026 | | 2025 |
| Operating Income (Loss) | | | | | | | | | | | |
| Access | $ | 145.7 | | | $ | 118.0 | | | $ | 332.0 | | | $ | 402.7 | |
| Vocational | | 87.6 | | | | 141.7 | | | | 293.4 | | | | 406.8 | |
| Transport | | 8.2 | | | | 36.6 | | | | 28.2 | | | | 55.0 | |
| Corporate and other | | (44.4 | ) | | | (35.9 | ) | | | (131.3 | ) | | | (137.0 | ) |
| Consolidated | $ | 197.1 | | | $ | 260.4 | | | $ | 522.3 | | | $ | 727.5 | |
| | September 30, |
| | 2026 | | 2025 |
| Period-end backlog: | | | | | |
| Access | $ | 2,655.6 | | | $ | 721.2 | |
| Vocational | | 6,737.8 | | | | 6,400.8 | |
| Transport | | 5,639.5 | | | | 6,470.2 | |
| Corporate and other | | 113.9 | | | | 97.8 | |
| Consolidated | $ | 15,146.8 | | | $ | 13,690.0 | |
Non-GAAP Financial Measures
The Company reports its financial results in accordance with generally accepted accounting principles in the United States of America (GAAP). The Company is presenting various operating results both on a GAAP basis and on a basis excluding items that affect comparability of results. When the Company excludes certain items as described below, they are considered non-GAAP financial measures. The Company believes excluding the impact of these items is useful to investors in comparing the Company’s performance to prior period results. However, while adjusted operating income, adjusted net income and adjusted earnings per share exclude amortization of purchased intangibles, revenue and earnings of acquired companies are reflected in adjusted operating income, adjusted net income and adjusted earnings per share and intangible assets contribute to the generation of revenue and earnings. Non-GAAP financial measures should be viewed in addition to, and not as an alternative for, the Company’s results prepared in accordance with GAAP. The table below presents a reconciliation of the Company’s presented non-GAAP measures to the most directly comparable GAAP measures (in millions, except per share amounts):
| | Three Months Ended September 30, | | Nine Months Ended September 30, |
| | 2026 | | 2025 | | 2026 | | 2025 |
| Access segment operating income (GAAP) | $ | 145.7 | | | $ | 118.0 | | | $ | 332.0 | | | $ | 402.7 | |
| Amortization of purchased intangibles | | 4.2 | | | | 3.8 | | | | 12.5 | | | | 12.6 | |
| Adjusted Access segment operating income (non-GAAP) | $ | 149.9 | | | $ | 121.8 | | | $ | 344.5 | | | $ | 415.3 | |
| | | | | | | | | | | | |
| Vocational segment operating income (GAAP) | $ | 87.6 | | | $ | 141.7 | | | $ | 293.4 | | | $ | 406.8 | |
| Amortization of purchased intangibles | | 9.3 | | | | 9.4 | | | | 28.1 | | | | 31.0 | |
| Reserve on prior divestiture-related note receivable | | 5.5 | | | | — | | | | 5.5 | | | | — | |
| Adjusted Vocational segment operating income (non-GAAP) | $ | 102.4 | | | $ | 151.1 | | | $ | 327.0 | | | $ | 437.8 | |
| | | | | | | | | | | | |
| Corporate and other operating loss (GAAP) | $ | (44.4 | ) | | $ | (35.9 | ) | | $ | (131.3 | ) | | $ | (137.0 | ) |
| Amortization of purchased intangibles | | 0.8 | | | | 0.7 | | | | 2.4 | | | | 2.2 | |
| Intangible asset impairment | | — | | | | — | | | | — | | | | 5.7 | |
| Adjusted corporate and other operating loss (non-GAAP) | $ | (43.6 | ) | | $ | (35.2 | ) | | $ | (128.9 | ) | | $ | (129.1 | ) |
| | | | | | | | | | | | |
| Consolidated operating income (GAAP) | $ | 197.1 | | | $ | 260.4 | | | $ | 522.3 | | | $ | 727.5 | |
| Amortization of purchased intangibles | | 14.3 | | | | 13.9 | | | | 43.0 | | | | 45.8 | |
| Intangible asset impairment | | — | | | | — | | | | — | | | | 5.7 | |
| Reserve on prior divestiture-related note receivable | | 5.5 | | | | — | | | | 5.5 | | | | — | |
| Adjusted consolidated operating income (non-GAAP) | $ | 216.9 | | | $ | 274.3 | | | $ | 570.8 | | | $ | 779.0 | |
| | Three Months Ended September 30, | | Nine Months Ended September 30, |
| | 2026 | | 2025 | | 2026 | | 2025 |
| Provision for income taxes (GAAP) | $ | 40.5 | | | $ | 41.7 | | | $ | 88.2 | | | $ | 143.7 | |
| Income tax effects of adjustments | | 4.8 | | | | 3.5 | | | | 12.0 | | | | 12.7 | |
| Expiration of foreign anti-hybrid tax matter | | 3.3 | | | | — | | | | 17.2 | | | | — | |
| Adjusted provision for income taxes (non-GAAP) | $ | 48.6 | | | $ | 45.2 | | | $ | 117.4 | | | $ | 156.4 | |
| | | | | | | | | | | | |
| Net income (GAAP) | $ | 138.4 | | | $ | 196.2 | | | $ | 364.7 | | | $ | 513.2 | |
| Amortization of purchased intangibles | | 14.3 | | | | 13.9 | | | | 43.0 | | | | 45.8 | |
| Intangible asset impairment | | — | | | | — | | | | — | | | | 5.7 | |
| Reserve on prior divestiture-related note receivable | | 5.5 | | | | — | | | | 5.5 | | | | — | |
| Income tax effects of adjustments | | (4.8 | ) | | | (3.5 | ) | | | (12.0 | ) | | | (12.7 | ) |
| Expiration of foreign anti-hybrid tax matter | | (3.3 | ) | | | — | | | | (17.2 | ) | | | — | |
| Adjusted net income (non-GAAP) | $ | 150.1 | | | $ | 206.6 | | | $ | 384.0 | | | $ | 552.0 | |
| | | | | | | | | | | | |
| Earnings per share-diluted (GAAP) | $ | 2.22 | | | $ | 3.04 | | | $ | 5.81 | | | $ | 7.92 | |
| Amortization of purchased intangibles | | 0.23 | | | | 0.21 | | | | 0.69 | | | | 0.71 | |
| Intangible asset impairment | | — | | | | — | | | | — | | | | 0.09 | |
| Reserve on prior divestiture-related note receivable | | 0.09 | | | | — | | | | 0.09 | | | | — | |
| Income tax effects of adjustments | | (0.08 | ) | | | (0.05 | ) | | | (0.20 | ) | | | (0.20 | ) |
| Expiration of foreign anti-hybrid tax matter | | (0.05 | ) | | | — | | | | (0.27 | ) | | | — | |
| Adjusted earnings per share-diluted (non-GAAP) | $ | 2.41 | | | $ | 3.20 | | | $ | 6.12 | | | $ | 8.52 | |
| | 2026 Expectations |
| | Low | | High |
| Earnings per share-diluted (GAAP) | $ | 8.00 | | | $ | 9.00 | |
| Amortization of purchased intangibles, net of tax | | 0.70 | | | | 0.70 | |
| Reserve on prior divestiture-related note receivable, net of tax | | 0.07 | | | | 0.07 | |
| Expiration of foreign anti-hybrid tax matter | | (0.27 | ) | | | (0.27 | ) |
| Adjusted earnings per share-diluted (non-GAAP) | $ | 8.50 | | | $ | 9.50 | |

View source version on businesswire.com: https://www.businesswire.com/news/home/20261028591347/en/