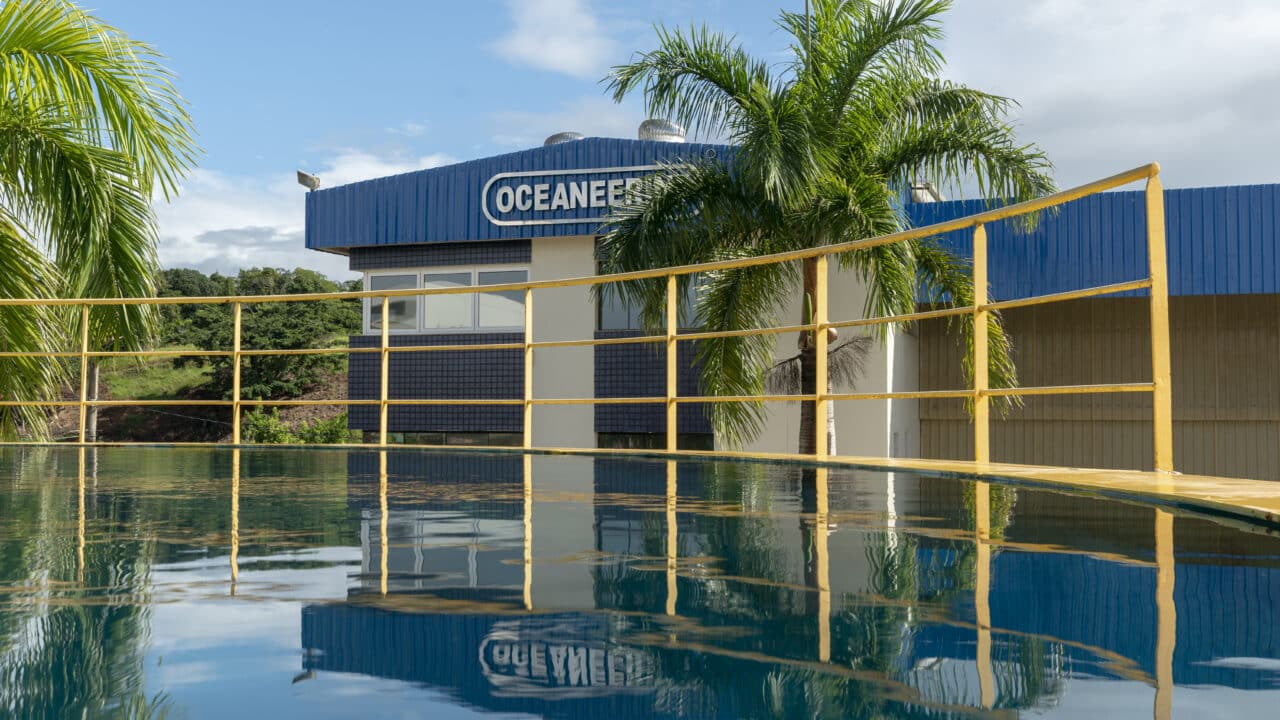
An investor handout that will be used during institutional investor meetings will be available for interested parties to view and download from the Investor Relations page of Oceaneering's website, at www.oceaneering.com, beginning on November 5, 2026, after market close.
|
Oceaneering International, Inc. is a technology company providing engineered services, products, and robotic solutions to the offshore energy, defense, aerospace, and manufacturing industries. Founded in 1969, the company operates through five business segments: Subsea Robotics, Manufactured Products, Offshore Projects Group, Integrity Management & Digital Solutions, and Aerospace and Defense Technologies. Its core offerings include work-class remotely operated vehicles (ROVs), autonomous underwater vehicles (AUVs), subsea umbilicals, specialty subsea hardware, and survey and positioning services. The company serves customers in the oil and gas, power generation, petrochemical, defense, and space exploration sectors, with significant operations in the U.S. Gulf, offshore Africa, the U.K., Norway, Brazil, and Asia. Notable products include the Isurus work-class ROV, the Liberty electric ROV, the Freedom hybrid AUV/ROV, and the Momentum electric work-class ROV. Oceaneering also provides digital and software solutions through its acquisition of Global Design Innovation Ltd. and offers material handling and logistics automation services. Summarised from the company's own disclosures, fiscal year ended Feb 2026 |
Industry Oil & Gas Equipment & Services | Homepage oceaneering.com |
| Sector Energy | IR page investors.oceaneering.com/overview/default.aspx | |
|
Tags
subsea robotics, remotely operated vehicles, autonomous underwater vehicles, subsea umbilicals, offshore energy, defense technology, aerospace engineering, material handling, integrity management, non-destructive testing, survey services, positioning services, Isurus, Liberty, Freedom, Momentum, C-Nav, Grayloc, MaxMover, Global Design Innovation Ltd., Umbilical Solutions, Offshore Projects Group, Integrity Management & Digital Solutions, Aerospace and Defense Technologies, Manufactured Products
|
Press page — |
Metrics
| Valuation | |
|---|---|
| Market cap | $ 4.374B |
| Market cap (USD) | $ 4.374B |
| P/E | 13.41 |
| PEG | 0.10 |
| P/BV | 3.58 |
| P/S | 1.58 |
| P/OCF | 11.50 |
| P/FCF | 15.18 |
| Dividend yield | 1.0% |
| Turnover / mcap | — |
| Returns | |
|---|---|
| ROE | 39.6% |
| ROI | 22.7% |
| ROIC | 19.5% |
| Profit margin | 13.4% |
| Growth | |
|---|---|
| Revenue growing | Yes |
| Profits growing | Yes |
| Revenue up 3y | Yes |
| Revenue up 5y | No |
| Earnings growth 3y (net profit CAGR) | 138.9% |
| Quality | |
|---|---|
| Profitable | Yes |
| Margin expanding | Yes |
| Buying back stock | Yes |
| Diluting (TTM) | No |
| Debt/Equity | 40.2% |
| Podcast bulls (TTM) | Sign up |
| Podcast bears (TTM) | Sign up |
| Podcast sentiment (TTM) | Sign up |
| Podcast sentiment % (TTM) | Sign up |
| News sentiment (TTM) | 49 |
| Quality score | 47.4% |
| Insiders | |
|---|---|
| Buys, 1w | Sign up |
| Buys, 1m | Sign up |
| Buys, 1y | Sign up |
| Sells, 1w | Sign up |
| Sells, 1m | Sign up |
| Sells, 1y | Sign up |
Sign up to see this company's insider trades
| Figure | FY 2025 | FY 2024 | FY 2023 | FY 2022 | FY 2021 | FY 2020 | FY 2019 | FY 2018 | FY 2017 | FY 2016 | FY 2015 | FY 2014 | FY 2013 | FY 2012 | FY 2011 | FY 2010 | FY 2009 | FY 2008 | FY 2007 | FY 2006 | FY 2005 | FY 2004 | FY 2003 | FY 2002 | FY 2001 | FY 1999 |
|---|---|---|---|---|---|---|---|---|---|---|---|---|---|---|---|---|---|---|---|---|---|---|---|---|---|---|
| Revenue | 2.643B | 2.54B | 2.328B | 1.984B | 1.825B | 1.828B | 2B | 1.9B | 1.922B | 2.272B | 3.063B | 3.66B | 3.287B | 2.783B | 2.193B | 1.917B | 1.822B | 1.977B | 1.743B | 1.28B | 998.543M | 780.181M | 639.249M | 524.66M | — | 416.82M |
| Net profit | 353.761M | 147.468M | 97.403M | 25.941M | -49.307M | -496.751M | -348.444M | -212.327M | 166.398M | 24.586M | 231.011M | 428.329M | 371.5M | 289.017M | 235.658M | 200.531M | 188.353M | 199.386M | 180.374M | 124.494M | 62.68M | 40.3M | 29.301M | 31.322M | — | 16.784M |
| Free cash flow | 207.846M | 96.078M | 109.229M | 39.84M | 175.115M | 75.96M | 9.885M | -72.9M | 42.798M | 228.13M | 360.438M | 334.879M | 146.34M | 138.296M | 53.544M | 256.588M | 243.213M | 38.613M | 179K | -41.107M | -2.132M | 15.74M | 52.255M | 2.451M | — | -27.69M |
| Figure | FY 2025 | FY 2024 | FY 2023 | FY 2022 | FY 2021 | FY 2020 | FY 2019 | FY 2018 | FY 2017 | FY 2016 | FY 2015 | FY 2014 | FY 2013 | FY 2012 | FY 2011 | FY 2010 | FY 2009 | FY 2008 | FY 2007 | FY 2006 | FY 2005 | FY 2004 | FY 2003 | FY 2002 | FY 2001 | FY 1999 |
|---|---|---|---|---|---|---|---|---|---|---|---|---|---|---|---|---|---|---|---|---|---|---|---|---|---|---|
| Share price | 24.03 | 26.08 | 21.28 | 17.49 | 11.31 | 7.95 | 14.91 | 12.1 | 21.14 | 28.21 | 37.52 | 58.81 | 78.88 | 53.79 | 46.15 | 73.64 | 58.51 | 63.28 | 72.7 | 43.62 | — | — | — | — | — | — |
| Price performance 12m | -0.08 | 0.23 | 0.22 | 0.55 | 0.42 | -0.47 | 0.23 | -0.43 | -0.25 | -0.25 | -0.36 | -0.25 | 0.47 | 0.17 | -0.37 | 0.26 | -0.08 | -0.13 | 0.67 | — | — | — | — | — | — | — |
Filed figures
Lines the statements and their notes report beside the headline figures, read from the filings' XBRL as filed (no restatement applied), with figures computed from one filing's own lines. Cash-flow lines carry their cash direction: an outflow is negative. Each period links to its filing; a figure's period, report date and tag are in its tooltip.
| Figure | Dec 2016 | Dec 2017 | Dec 2018 | Dec 2019 | Dec 2020 | Dec 2021 | Dec 2022 | Dec 2023 | Dec 2024 | Dec 2025 |
|---|---|---|---|---|---|---|---|---|---|---|
| Balance sheet detail | ||||||||||
| Trade receivables (USD) | 490M | 477M | 369M | 421M | 296M | 263M | 297M | 331M | 304M | 308M |
| ↳ YoY growth | -20.1% | -2.6% | -22.6% | +14.2% | -29.7% | -11.2% | +12.8% | +11.7% | -8.4% | +1.6% |
| ↳ 5y CAGR | -2.3% | -6.5% | -13.7% | -11.6% | -13.5% | -11.7% | -9.1% | -2.1% | -6.3% | +0.8% |
| Borrowings, current (USD) | — | — | — | — | — | — | 0.00 | — | — | — |
| Borrowings, non-current (USD) | 793M | 792M | 787M | 797M | 805M | 702M | 701M | 477M | 482M | 487M |
| Lease liabilities (USD) | — | — | 170M | 181M | 175M | 159M | 171M | 293M | 238M | 386M |
| Cash and deposits (USD) | 450M | 430M | 354M | 374M | 452M | 538M | 569M | 462M | 498M | 689M |
| Intangible assets (USD) | 87.8M | 85.3M | 80M | 25.8M | 14.3M | 12.6M | 11.5M | 21.2M | 33.3M | 30.3M |
| Right-of-use assets (USD) | — | — | 185M | 163M | 141M | 146M | 140M | 338M | 335M | 350M |
| Net debt (borrowings + leases - cash) (USD) | 343M | 362M | 432M | 604M | 528M | 322M | 304M | 309M | 223M | 184M |
| Cash flow detail | ||||||||||
| Operating cash flow (USD) | 341M | 136M | 36.6M | 158M | 137M | 225M | 121M | 210M | 203M | 319M |
| Purchases of property, plant and equipment (USD) | -112M | -93.7M | -109M | -148M | -60.7M | -50.2M | -81M | -101M | -107M | -111M |
| Change in receivables (cash effect) (USD) | 123M | 13.1M | -86.7M | -17.6M | -126M | -41.1M | -50.7M | -83.1M | -8M | 53.9M |
| Change in inventories (cash effect) (USD) | 17.8M | 65.5M | -12.5M | -11.8M | -26.5M | -7.31M | -30.7M | -25.4M | -13.1M | 5.82M |
| Change in payables (cash effect) (USD) | -117M | -76.3M | 28.5M | 76.6M | 8.93M | 6,000 | 417,000 | 3.25M | -14.7M | 72,000 |
| Dividends paid (cash effect) (USD) | — | -44.2M | 0.00 | 0.00 | — | — | — | — | — | — |
| Share buybacks (cash effect) (USD) | 0.00 | 0.00 | — | — | — | — | — | — | -20M | -40.3M |
| Interest paid (cash effect) (USD) | -29.2M | -32.4M | -37.5M | -46M | -44M | -39M | -38M | -34M | -32M | -32M |
| Income taxes paid (cash effect) (USD) | -75.8M | -43.3M | -29.7M | -29.8M | -26.3M | -29.2M | -45M | -44M | -94.7M | -102M |
| Share-based compensation (USD) | 14.7M | 11.5M | 11.6M | 11.4M | 8.68M | 11M | 10.4M | 12.1M | 12.8M | 14.8M |
| Operating cash flow before change in receivables (USD) | 217M | 123M | 123M | 175M | 262M | 266M | 172M | 293M | 211M | 265M |
| Free cash flow (OCF - PPE - intangibles) (USD) | 228M | 42.8M | -72.9M | 9.89M | 76M | 175M | 39.8M | 109M | 96.1M | 208M |
| Income detail | ||||||||||
| Total comprehensive income (USD) | 22.3M | 177M | -260M | -343M | -522M | -56.5M | 6.27M | 101M | 100M | 387M |
| Reported | Feb 24, 2017 | Feb 27, 2020 | Feb 27, 2020 | Feb 27, 2020 | Feb 26, 2021 | Feb 25, 2022 | Oct 27, 2023 | Feb 23, 2024 | Feb 24, 2025 | Feb 20, 2026 |
Sign up to see institutional holdings
Sign UpPodcast Mentions
Sign up to see podcast mentions and sentiment
Sign UpMaterial events reported to the SEC on Form 8-K or 6-K, newest first. The link opens the filing itself on EDGAR. Press releases from the company's own website, newest first.
10/21/2026
Download (opens in new window) PDF 71 KB
HOUSTON--(BUSINESS WIRE)-- Oceaneering International, Inc. ("Oceaneering") (NYSE:OII) today reported third quarter 2026 results.
Third Quarter 2026 Results
-
As compared to the third quarter of 2025:
- Revenue increased 6% to $785 million.
- Operating income increased 7% to $92.2 million.
- Net income attributable to Oceaneering decreased 26% to $52.6 million.
- Adjusted EBITDA increased 7% to $119 million.
-
Cash Generation
- Cash flow provided by operating activities was $163 million.
- Free cash flow was $142 million.
-
Balance Sheet and Capital Allocation
- Quarter-end cash and cash equivalents totaled $735 million, compared to $506 million at the end of the same period last year.
- Shares repurchased were 101,038 for approximately $5.0 million.
Rod Larson, Oceaneering's President and Chief Executive Officer, commented, “Our third-quarter results were in line with our guidance and consensus estimates. Subsea Robotics (SSR) delivered improved year-over-year results, while Offshore Projects Group (OPG) continued to perform well. We generated significant free cash flow during the quarter as a result of improved operational cash and lower tax payments and capital spend. We expect free cash flow generation to moderate in the fourth quarter, but we remain on track to achieve the top end of our full-year guidance.
“As we look ahead, we expect to see typical seasonality and changes in geographic and project mix in the fourth quarter. Beyond the fourth quarter, we expect improved performance in 2027, with EBITDA increasing compared to 2026.
“Third-quarter bookings included meaningful awards across SSR, Manufactured Products, and Aerospace and Defense Technologies (ADTech). Together with our existing backlog and sales opportunities across our businesses, this provides a solid foundation as we enter 2027. Based on our current expectations, we are initiating full-year 2027 EBITDA guidance in the range of $430 million to $480 million.”
Third Quarter 2026 Segment Results
As compared to the third quarter of 2025:
- SSR revenue increased to $233 million, operating income rose 16% to $75.4 million, and EBITDA margin expanded to 39%. Higher ROV revenue per day utilized, increased Survey activity, and improved margins in ROV operations and in Survey contributed to the year-over-year improvements. ROV revenue per day utilized increased to $11,781, while ROV fleet utilization remained at 65%. Increased ROV activity in Europe, Guyana, and West Africa largely offset lower activity in the U.S. Gulf.
- Manufactured Products revenue increased 8%, while operating income was relatively flat at $25.1 million and margin decreased to 15%. Umbilical manufacturing activity was relatively stable compared with the prior year. Increased revenue was primarily attributable to the final resolution of a legacy mobility solutions contract, while lower activity and profitability in Grayloc Products affected operating results. As of September 30, 2026, backlog was $435 million. The book-to-bill ratio was 0.77 for the 12-month period ending on September 30, 2026.
- OPG revenue, operating income, and margin remained relatively flat. Results benefited from a favorable mix of installation projects, which more than offset lower activity in West Africa and a less favorable project mix in the U.S. Gulf.
- Integrity Management and Digital Solutions (IMDS) revenue increased 7% while operating income was relatively flat. Increased activity in the Middle East, Europe, and the U.S. Gulf was partially offset by lower activity in West Africa, a shift in project mix, and increased costs in the Middle East.
- ADTech revenue increased 7% to $135 million, operating income decreased to $14.7 million, and margin declined to 11%. The lower operating results reflect increases in pass-through activities and certain program costs.
- At the corporate level, Unallocated Expenses increased to $50.0 million, consistent with expectations.
Fourth Quarter 2026 Guidance
As compared to the fourth quarter of 2025:
Consolidated fourth quarter 2026 revenue is expected to increase and EBITDA is expected to be in the range of $85 million to $95 million.
At the segment level, for the fourth quarter of 2026:
- SSR revenue is expected to increase and operating income is expected to decrease, reflecting lower ROV utilization as certain rigs transit from the U.S. Gulf to other regions, a shift in ROV geographic mix, and increased mobilization costs.
- Manufactured Products revenue and operating income are expected to increase.
- OPG revenue is expected to remain relatively flat and operating income is expected to decrease on changes in project mix.
- IMDS revenue and operating income are expected to increase.
- ADTech revenue and operating income are expected to increase.
- Unallocated Expenses are expected to be in the $50 million range.
Initial Full-Year 2027 Guidance
- Consolidated EBITDA is expected to be in the range of $430 million to $480 million.
- Free cash flow generation is expected to exceed the level forecasted for 2026.
- Share repurchase activity is expected to continue.
Oceaneering will provide more specific guidance on its expectations for 2027 in its fourth quarter 2026 earnings release and conference call.
Liquidity
During the third quarter, Oceaneering completed a series of financing transactions that strengthened its capital structure, including the issuance of $500 million aggregate principal amount of 6.875% Senior Notes due 2034 and the amendment and extension of its revolving credit facility, which increased commitments to $345 million and extended maturity to July 2031. These actions significantly extended Oceaneering's debt maturity profile, reduced refinancing risk, and enhanced long-term financial flexibility. As of September 30, 2026, Oceaneering held approximately $735 million of cash and, together with available borrowing capacity under its revolving credit facility, had more than $1.0 billion of liquidity to support ongoing operations, strategic investments, and future growth initiatives.
Non-GAAP Financial Measures
Adjusted net income (loss) and earnings (loss) per share; EBITDA and adjusted EBITDA on a consolidated and on a segment basis (as well as EBITDA and adjusted EBITDA margins); and free cash flow are non-GAAP measures that exclude the impacts of certain identified items. Reconciliations to the corresponding GAAP measures are shown in the tables Adjusted Net Income (Loss) and Diluted Earnings (Loss) per Share (EPS), EBITDA and Adjusted EBITDA and Margins, Free Cash Flow, 2026 Consolidated EBITDA Estimate, 2026 Free Cash Flow Estimate, and EBITDA and Adjusted EBITDA and Margins by Segment. These tables are included below under the caption Reconciliations of Non-GAAP to GAAP Financial Information.
Conference Call Details
Oceaneering has scheduled a conference call and webcast on Thursday, October 22, 2026 at 10:00 a.m. Central Time (11:00 a.m. Eastern Time), to discuss its results for the third quarter of 2026, guidance for the fourth quarter of 2026, and initial guidance for the full year of 2027. A link to the webcast is posted on Oceaneering's Investor Relations website. A replay of the conference call will be made available on the website approximately two hours following the conclusion of the live call.
Forward-Looking Statements
This release contains "forward-looking statements," as defined in the Private Securities Litigation Reform Act of 1995, including, without limitation, statements as to the expectations, beliefs, future expected business, and financial performance and prospects of Oceaneering. More specifically, the forward-looking statements in this press release include the statements concerning Oceaneering’s: expectation that full-year free cash flow generation will be in line with prior guidance; fourth quarter 2026 guidance for consolidated revenue, consolidated EBITDA, revenue and operating income by segment, and Unallocated Expenses; implied full-year 2026 guidance for consolidated adjusted EBITDA; initial full-year 2027 guidance for consolidated EBITDA and free cash flow; the expectation that share repurchase activity will continue in 2027; and the characterization, whether positive or otherwise, of market fundamentals, conditions, and dynamics, robotics markets, offshore energy activity levels (including by geographic location), pricing levels, day rates, ROV days utilized, average ROV revenue per day utilized, vessel utilization, growth, bidding activity, outlook, performance, opportunities, and future financials, including as increasing, favorable, positive, encouraging, improving, seasonal, strong, supportive, robust, meaningful, considerable, healthy, or significant (which is used herein to indicate a change of 20% or greater).
The forward-looking statements included in this release are based on Oceaneering's current expectations and are subject to certain risks, assumptions, trends, and uncertainties that could cause actual results to differ materially from those indicated by the forward-looking statements. Factors that could cause actual results to differ materially include: factors affecting the level of activity in the oil and gas industry, including worldwide demand for and prices of oil and natural gas, oil and natural gas production growth, and the supply and demand of offshore drilling rigs; the indirect consequences of climate change and climate-related business trends; actions by members of OPEC and other oil exporting countries; decisions about offshore developments to be made by oil and gas exploration, development, and production companies; the use of subsea completions and our ability to capture associated market share; future budgetary and fiscal constraints imposed by the United States government, including the risk of government shutdowns; general economic and business conditions and industry trends and uncertainty, including those related to tariffs and retaliatory tariffs; the strength of the industry segments in which we are involved; cancellations of contracts, customer contract disputes, change orders, and other contractual modifications, force majeure declarations, and the exercise of contractual suspension rights and the resulting adjustments to our backlog; collections from our customers; our future financial performance, including as a result of the availability, terms, and deployment of capital; the consequences of significant changes in currency exchange rates; the volatility and uncertainties of credit markets; changes in data privacy and security laws, regulations, and standards; changes in tax laws, regulations, and interpretation by taxing authorities; changes in, or our ability to comply with, other laws and governmental regulations, including those relating to the environment; the continued availability of qualified personnel; our ability to obtain raw materials and parts on a timely basis and, in some cases, from limited sources; operating risks normally incident to offshore exploration, development, and production operations; hurricanes and other adverse weather and sea conditions; cost and time associated with drydocking of our vessels; the highly competitive nature of our businesses; adverse outcomes from legal or regulatory proceedings; the risks associated with integrating businesses we acquire; rapid technological changes; and social, political, military, and economic situations in foreign countries where we do business and the possibilities of civil disturbances, war, other armed conflicts, or terrorist attacks. For a more complete discussion of these and other risk factors, please see Oceaneering’s latest annual report on Form 10-K and subsequent quarterly reports on Form 10-Q filed with the Securities and Exchange Commission. You should not place undue reliance on forward-looking statements. Except to the extent required by applicable law, Oceaneering undertakes no obligation to update or revise any forward-looking statement.
About Oceaneering
Oceaneering is a global technology company delivering engineered services and products and robotic solutions to the offshore energy, defense, aerospace, and manufacturing industries.

10/01/2026
Download (opens in new window) PDF 118 KB
HOUSTON--(BUSINESS WIRE)-- Oceaneering International, Inc. (“Oceaneering”) (NYSE:OII) announced today that its Aerospace and Defense Technologies (“ADTech”) segment has been awarded a follow-on U.S. Navy contract to provide Dry Deck Shelter maintenance, overhaul, engineering, and field change services. This five-year contract, consisting of one base year and four option years, has a potential value of $154 million and supports the safe and reliable deployment of special operations forces and undersea vehicles.
David Pest, Vice President and General Manager of Oceaneering’s ADTech Marine Services Division (“MSD”), stated: “MSD has supported the Navy’s Dry Deck Shelter program since 2002. Built on disciplined execution and technical excellence, MSD’s commitment to Dry Deck Shelter safety and reliability is unwavering. These mission‑sensitive operations run on tight schedules and demand a specialized, highly proficient workforce trusted by the operators. I’m exceedingly proud of our team.”
Bill Merz, Senior Vice President of Oceaneering’s ADTech segment, stated: “We are proud to continue our long-standing support of the undersea enterprise and special operations community. This award reflects the Navy’s confidence in Oceaneering and the strength of MSD in growing our nation’s undersea advantage.”
Oceaneering’s ADTech segment is a trusted provider of engineered solutions for the U.S. Navy’s undersea programs, leveraging decades of experience in building and sustaining manned and unmanned subsea systems.
Statements in this press release that express a belief, expectation, or intention, as well as those that are not historical fact, are forward-looking. The forward-looking statements in this press release include statements concerning Oceaneering’s scope of work, potential contract value, and contract duration. These forward-looking statements are made pursuant to the safe harbor provisions of the Private Securities Litigation Reform Act of 1995 and are based on current information and expectations of Oceaneering that involve a number of risks, uncertainties, and assumptions, including risks and uncertainties related to counterparty performance under contracts and market conditions and other economic factors affecting Oceaneering’s business. Should one or more of these risks or uncertainties materialize, or should the assumptions underlying the forward-looking statements prove incorrect, actual outcomes could vary materially from those indicated. These and other risks are more fully described in Oceaneering’s latest annual report on Form 10-K and its other periodic filings with the Securities and Exchange Commission.
About Oceaneering
Oceaneering is a global technology company delivering engineered services and products and robotic solutions to the offshore energy, defense, aerospace, and manufacturing industries.
Prompts
Click prompts to add them under the company line, click again to take one out, then copy the result into your AI chat. Shared by Asian Century Stocks and Uncovered Thai Stocks. Thank you.
ETFs Holding Oceaneering International, Inc.
Exchange-traded funds whose newest published daily portfolio holds one of the company's listings, largest weight first.
| ETF | Weight in ETF | Shares | Market value | As of |
|---|---|---|---|---|
| KEAT | 3.97% | 136,470 | $ 4.65M | Nov 18, 2026 |
| SAWS | 1.60% | 2,565 | $ 125.121K | Jul 31, 2026 |
| CCNR | 0.54% | 47,731 | $ 2.328M | Jul 31, 2026 |
| JSMD | 0.53% | 114,002 | $ 5.561M | Jul 31, 2026 |
| IQM | 0.44% | 12,801 | $ 518.697K | Jun 30, 2026 |
| AVUV | 0.40% | 3,722,904 | $ 127.361M | Nov 16, 2026 |
| GVLU | 0.34% | 26,356 | $ 901.639K | Nov 17, 2026 |
| MMSC | 0.33% | 4,883 | $ 167.047K | Nov 16, 2026 |
| VFQY | 0.23% | 22,706 | $ 1.175M | Aug 31, 2026 |
| AVSC | 0.21% | 192,446 | $ 6.584M | Nov 16, 2026 |
| RUSC | 0.21% | 4,074 | $ 165.078K | Jun 30, 2026 |
| FESM | 0.21% | 293,950 | $ 11.911M | Jun 30, 2026 |
| PSC | 0.18% | 105,178 | $ 4.262M | Jun 30, 2026 |
| RESM | 0.16% | 143 | $ 5,794.36 | Jun 30, 2026 |
| IDEF | 0.15% | 114,780 | $ 3.927M | Nov 16, 2026 |
| FSML | 0.12% | 3,811 | $ 154.422K | Jun 30, 2026 |
| EBI | 0.12% | 16,082 | $ 832.404K | Aug 31, 2026 |
| AVIE | 0.11% | 525 | $ 17.96K | Nov 16, 2026 |
| JMEE | 0.11% | 94,752 | $ 3.229M | Nov 17, 2026 |
| DFAS | 0.08% | 758,494 | $ 26.38M | Nov 12, 2026 |
| MKTN | 0.07% | 1,824 | $ 73.908K | Jun 30, 2026 |
| DFAT | 0.07% | 624,946 | $ 21.736M | Nov 12, 2026 |
| VFMO | 0.06% | 23,491 | $ 1.216M | Aug 31, 2026 |
| FSEG | 0.06% | 84 | $ 3,403.68 | Jun 30, 2026 |
| AVUQ | 0.05% | 6,114 | $ 209.16K | Nov 16, 2026 |
| DXUV | 0.04% | 66,075 | $ 2.298M | Nov 12, 2026 |
| MSSM | 0.03% | 3,703 | $ 191.667K | Aug 31, 2026 |
| DFSU | 0.02% | 16,319 | $ 567.575K | Nov 12, 2026 |
| AVUS | 0.02% | 103,409 | $ 3.538M | Nov 16, 2026 |
| DFUV | 0.02% | 71,577 | $ 2.489M | Nov 12, 2026 |
| DFAC | 0.02% | 393,533 | $ 13.687M | Nov 12, 2026 |
| DCOR | 0.01% | 137,638 | $ 4.787M | Nov 12, 2026 |
| SMDX | 0.01% | 362 | $ 12.384K | Nov 17, 2026 |
| DFAU | 0.01% | 22,533 | $ 783.698K | Nov 12, 2026 |
| DFUS | 0.00% | 30,631 | $ 1.065M | Nov 12, 2026 |


Ty Sydnor is a Contracts Manager with Oceaneering Space Systems (OSS) in Houston, TX. His role centers on leading the negotiation, strategy, and administration of a broad portfolio of government contracts, including Indefinite Delivery, Indefinite Quantity (IDIQ; Cost Plus Fixed Fee (CPFF); Firm Fixed Price (FFP); and Time and Materials (T&M) agreements.