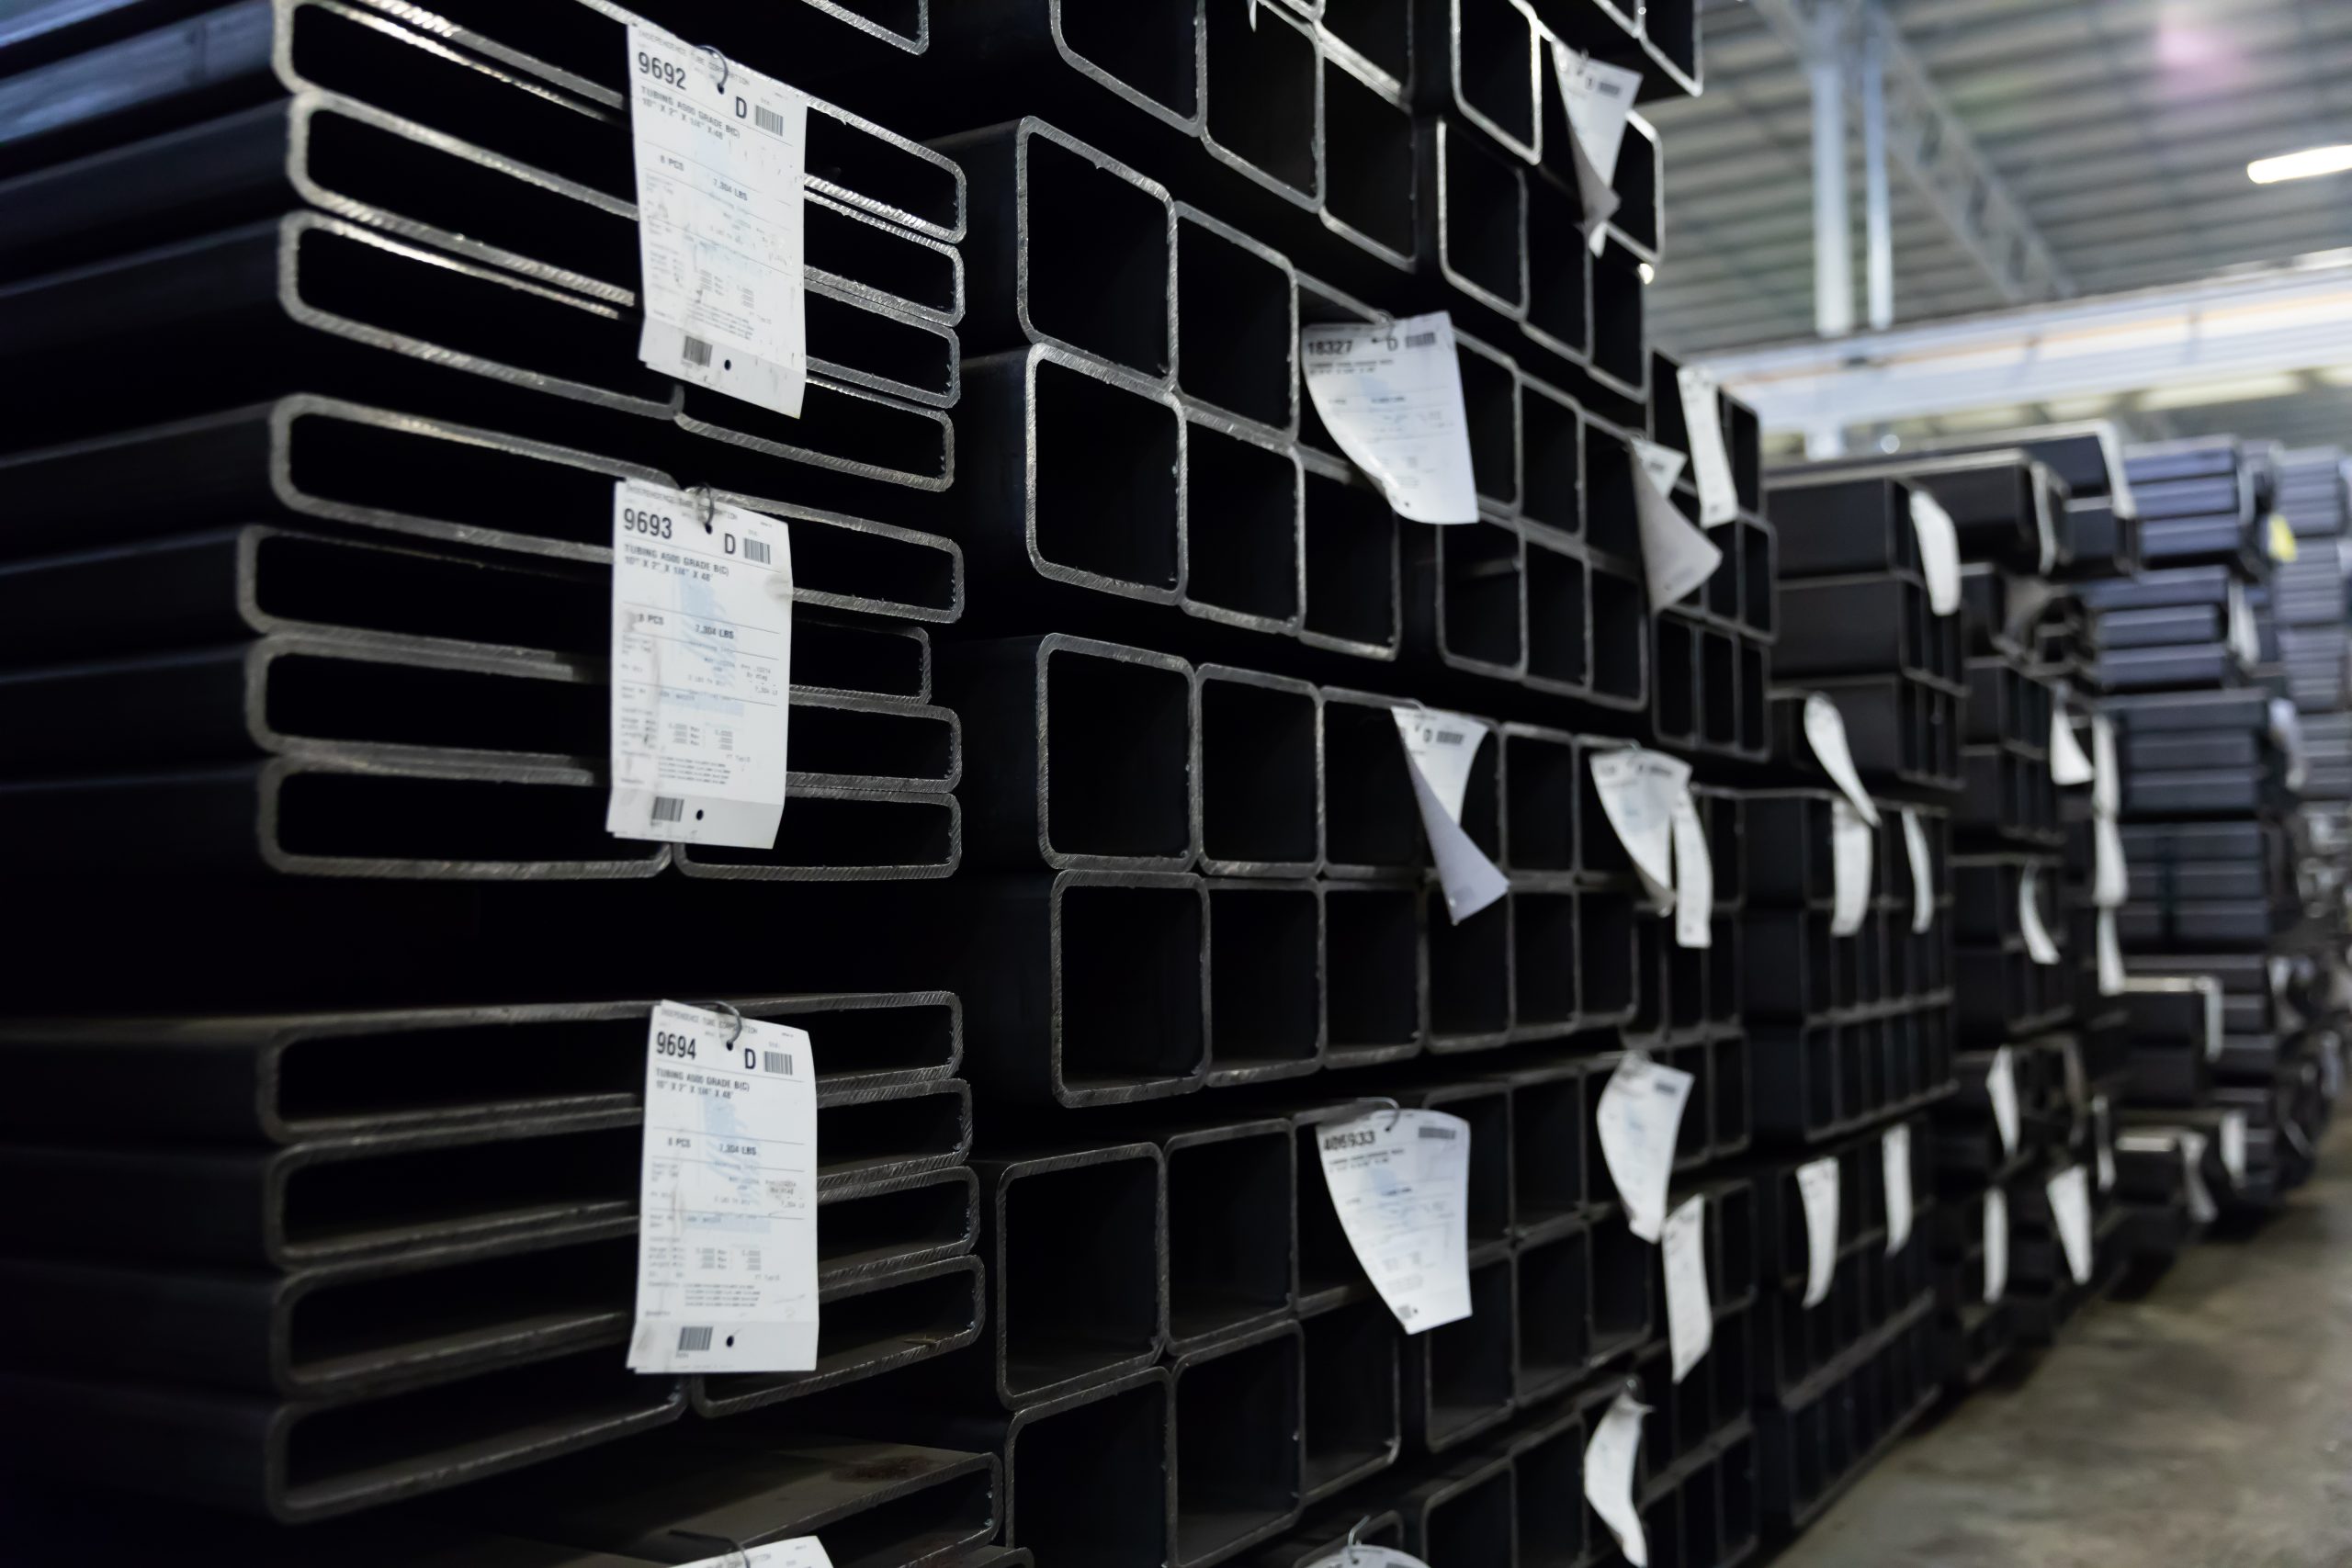
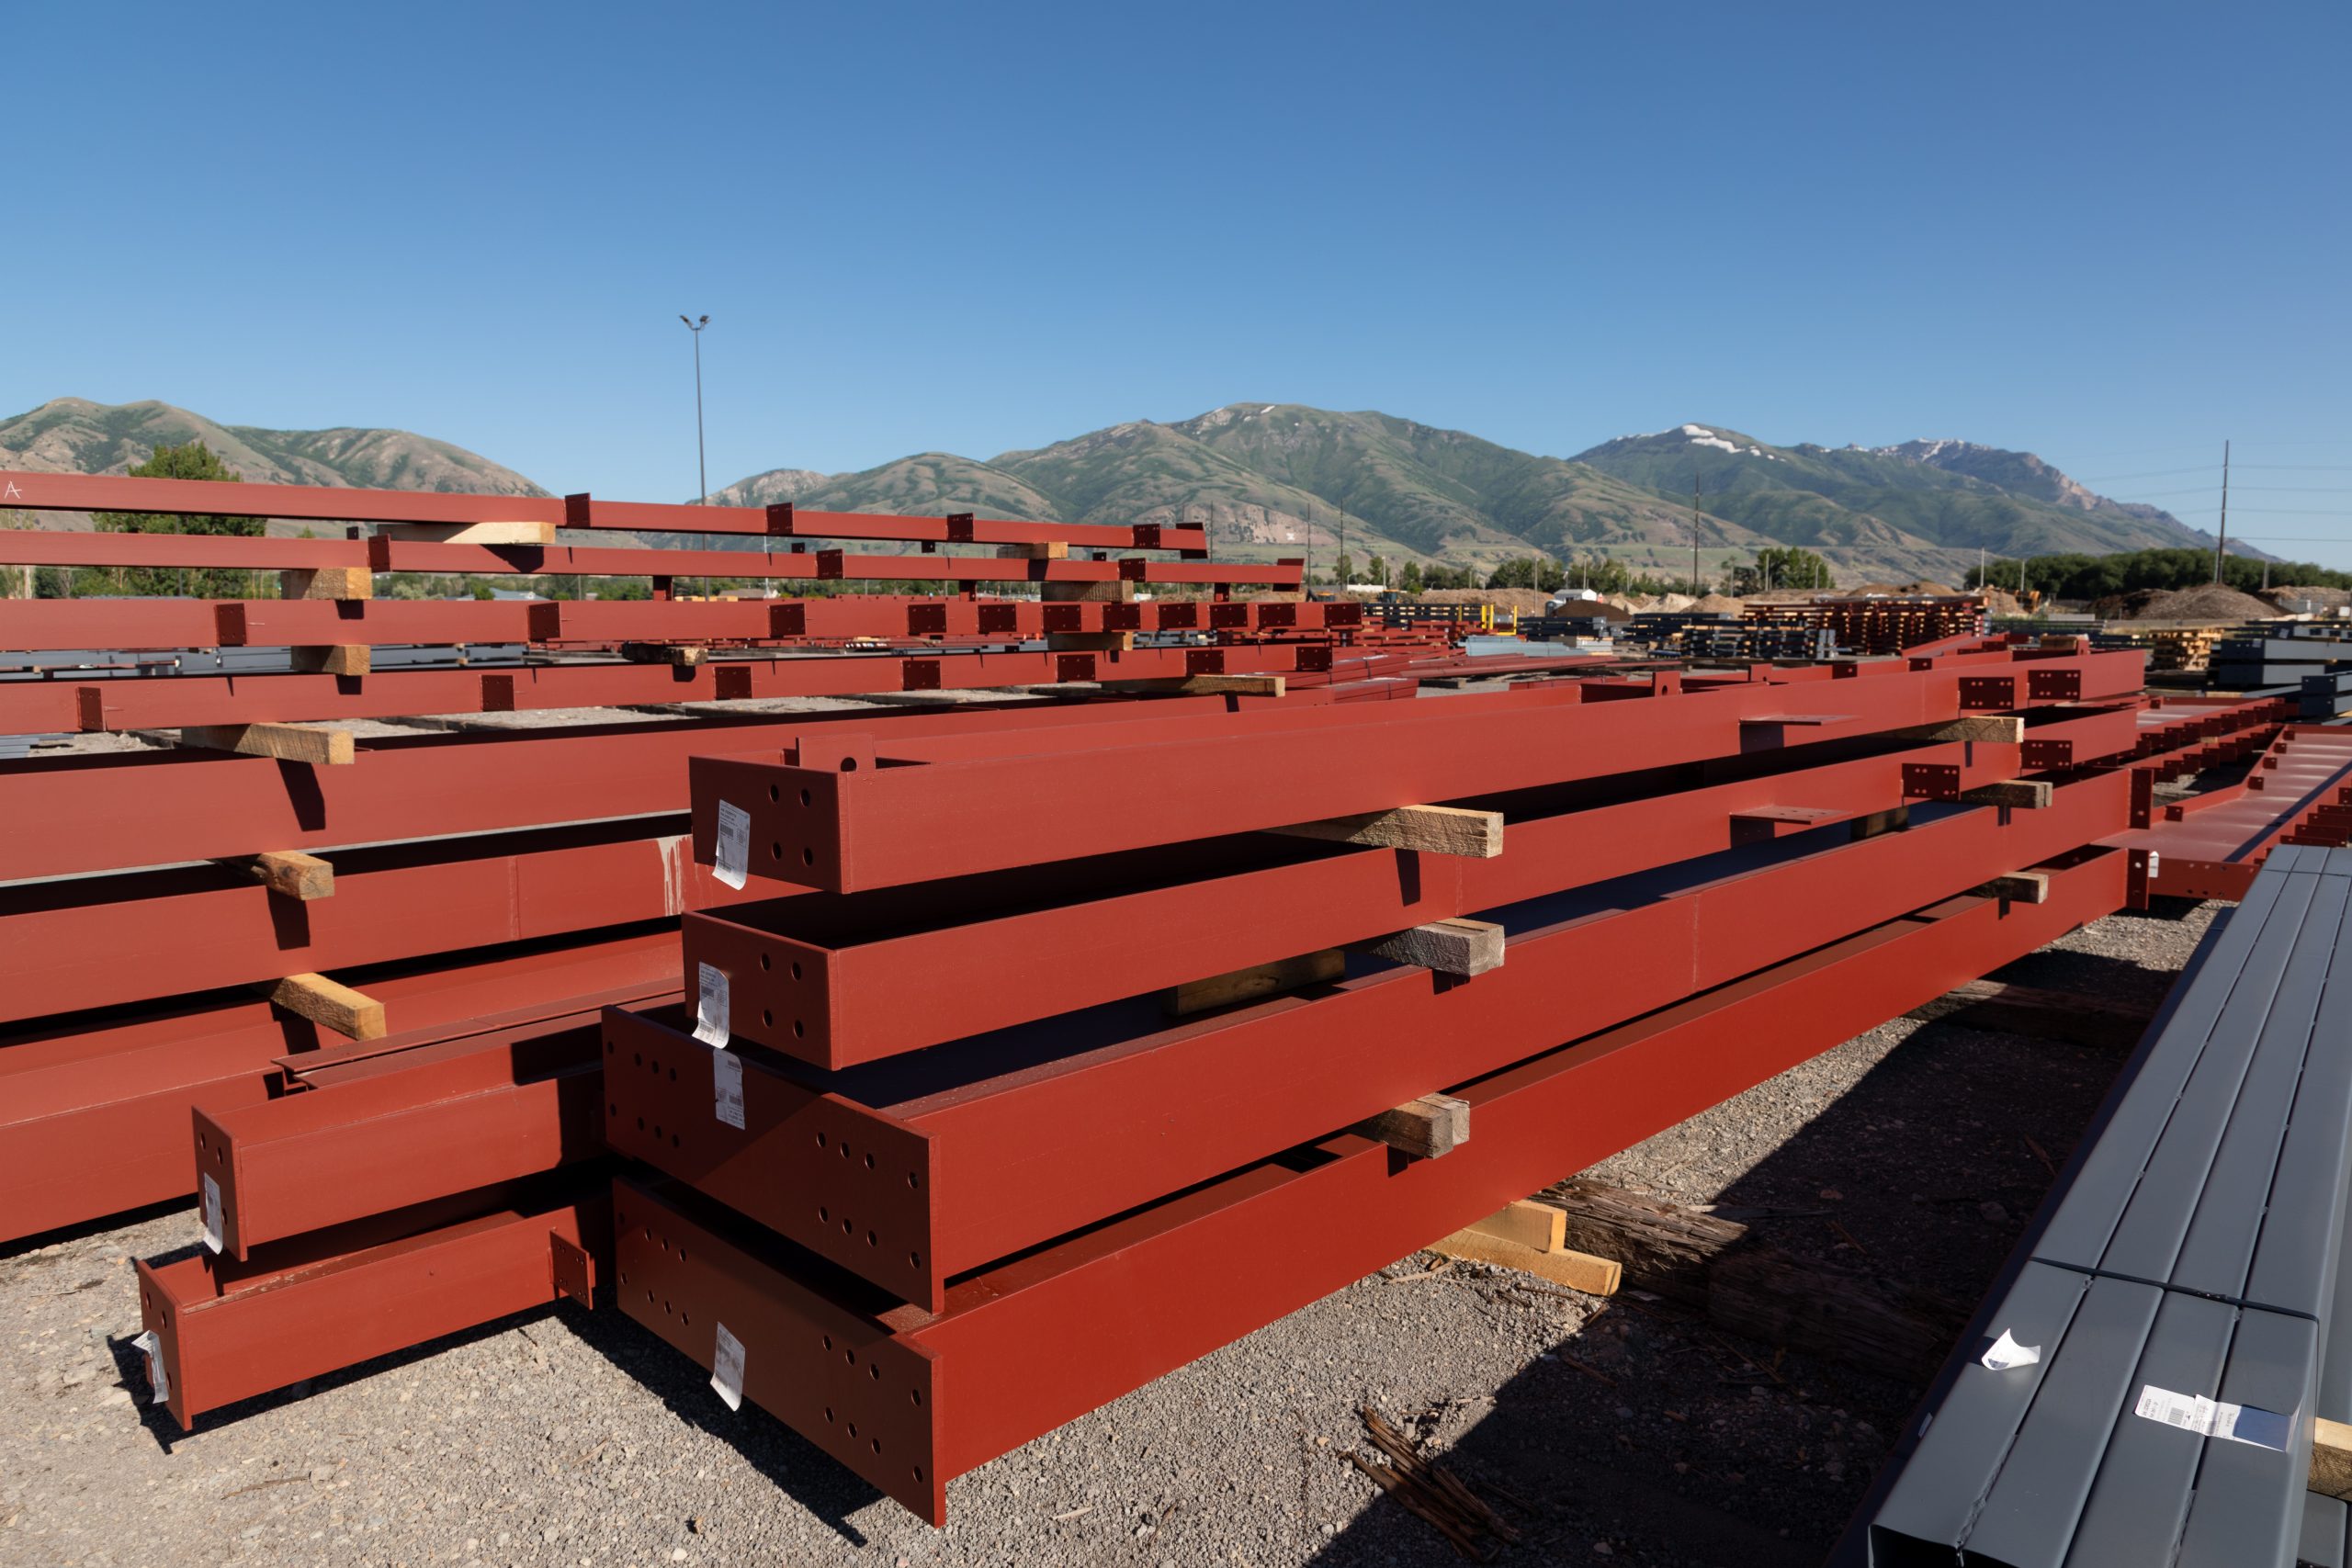
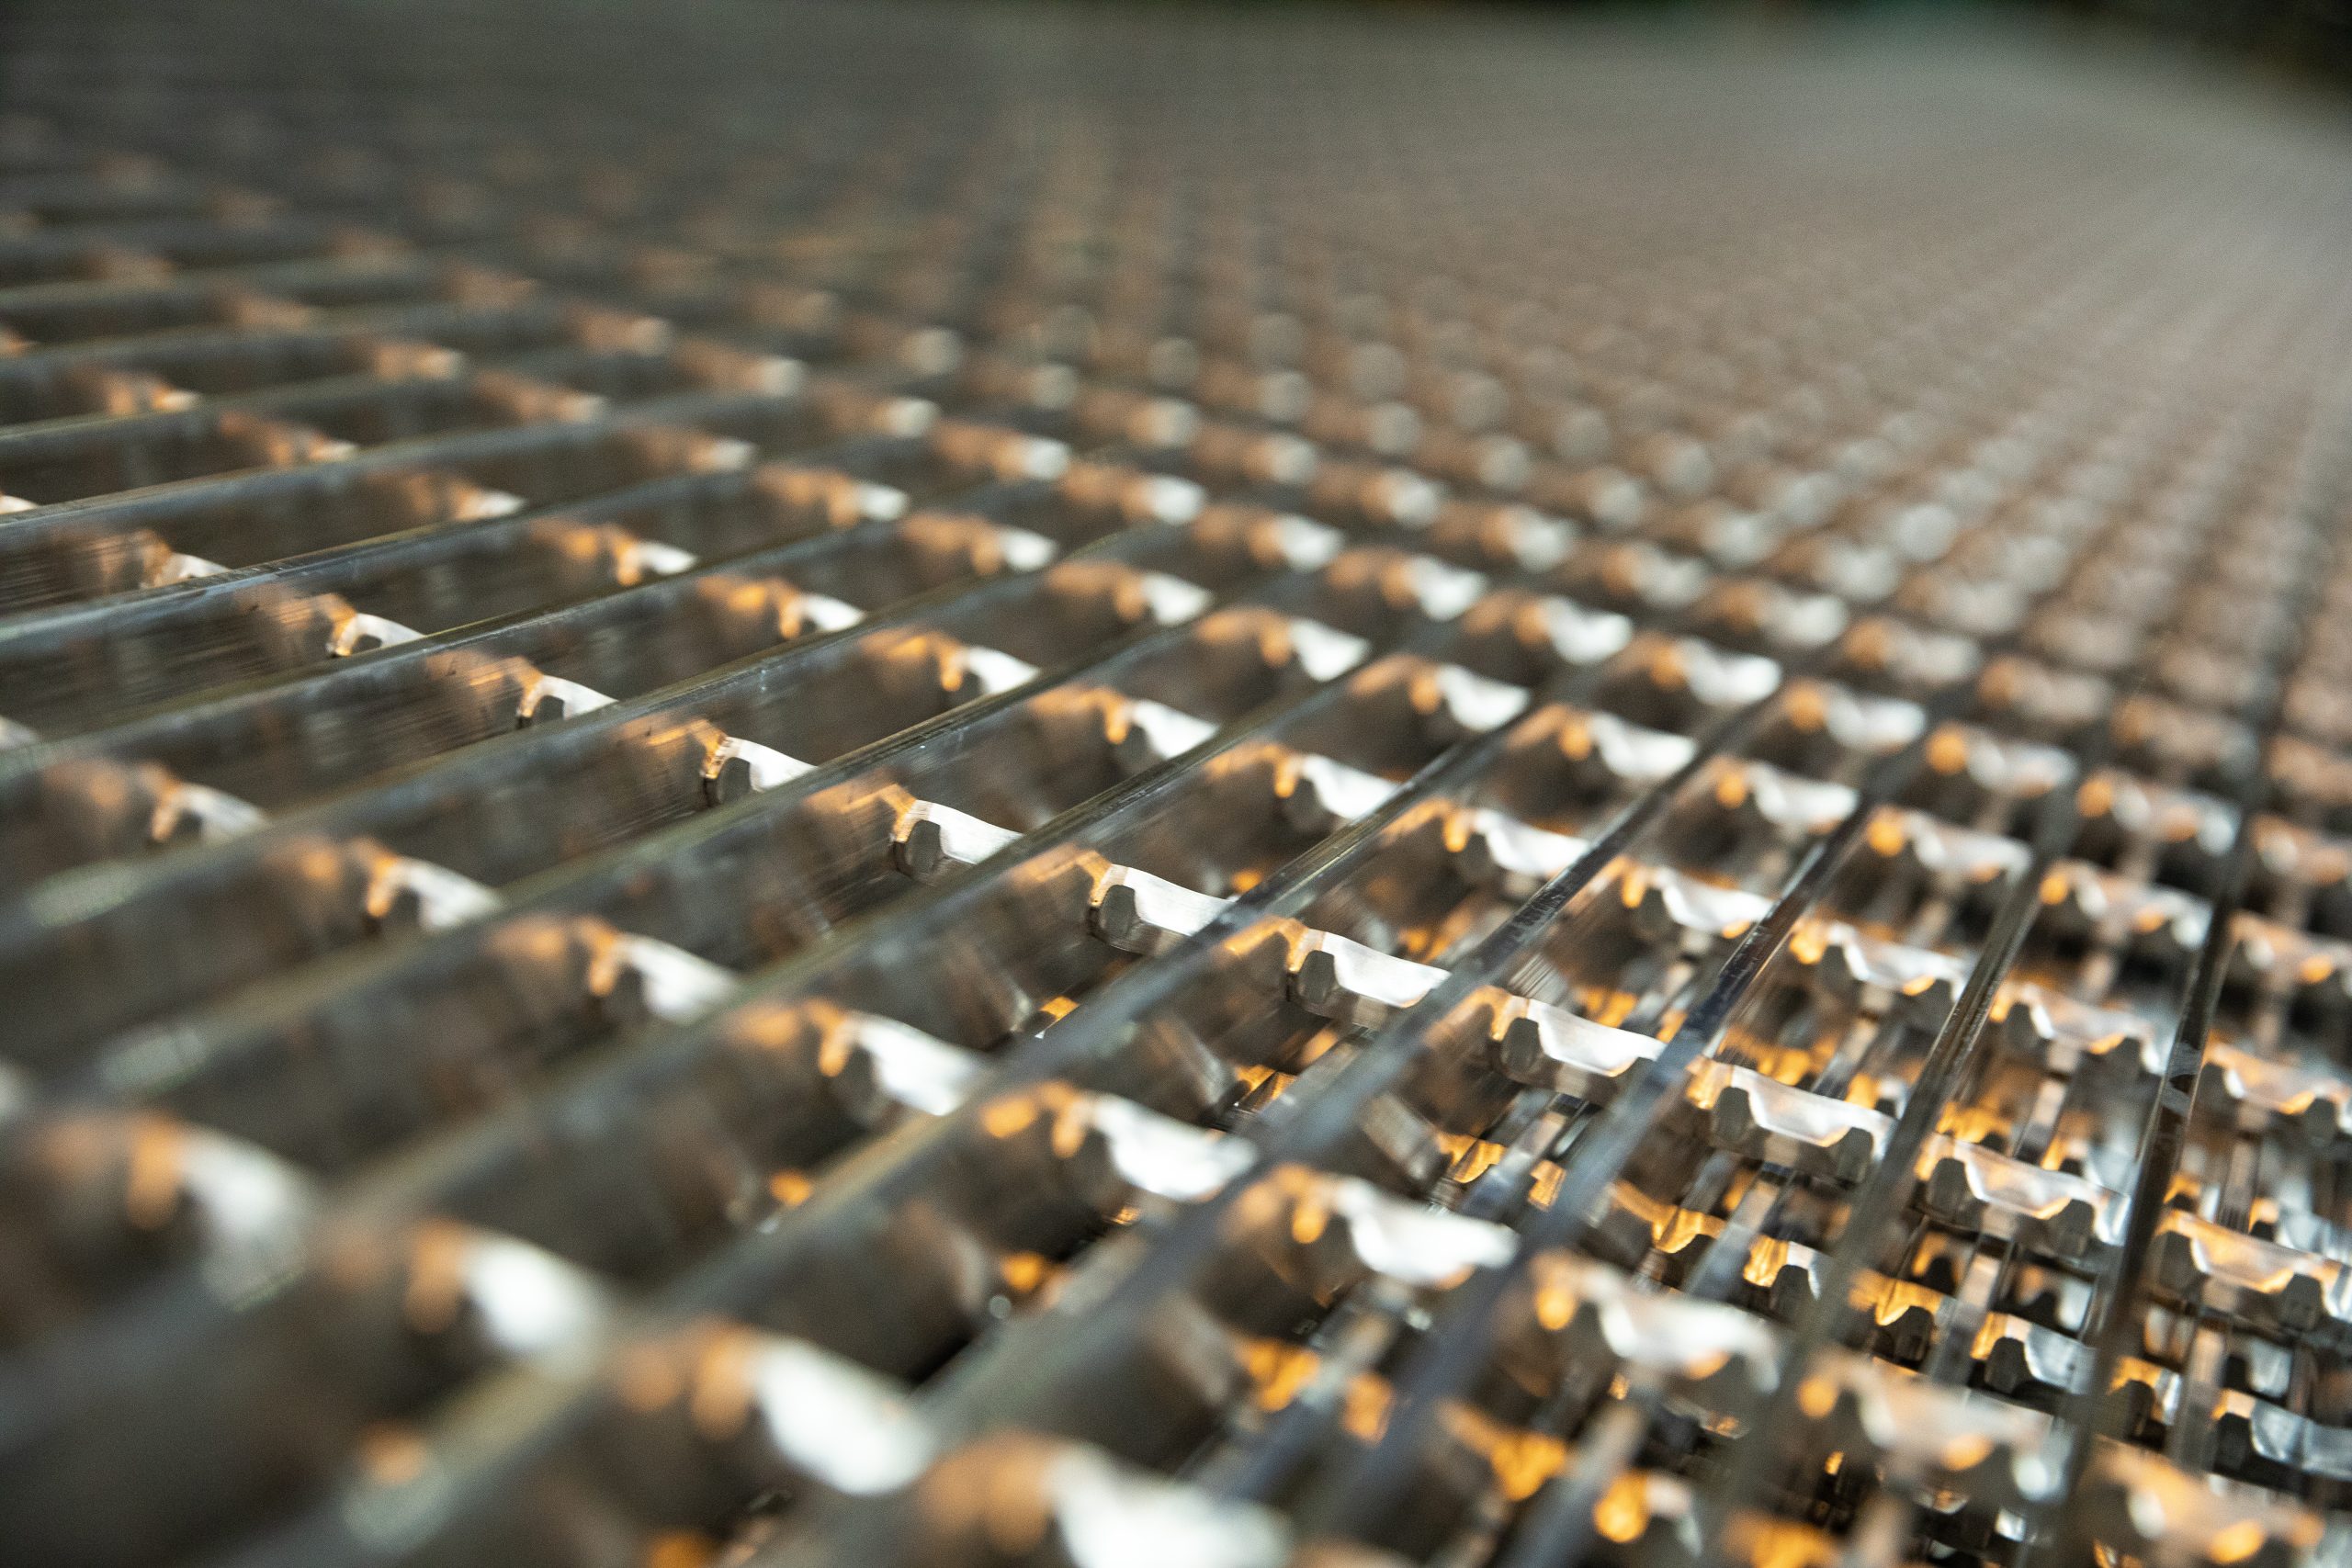
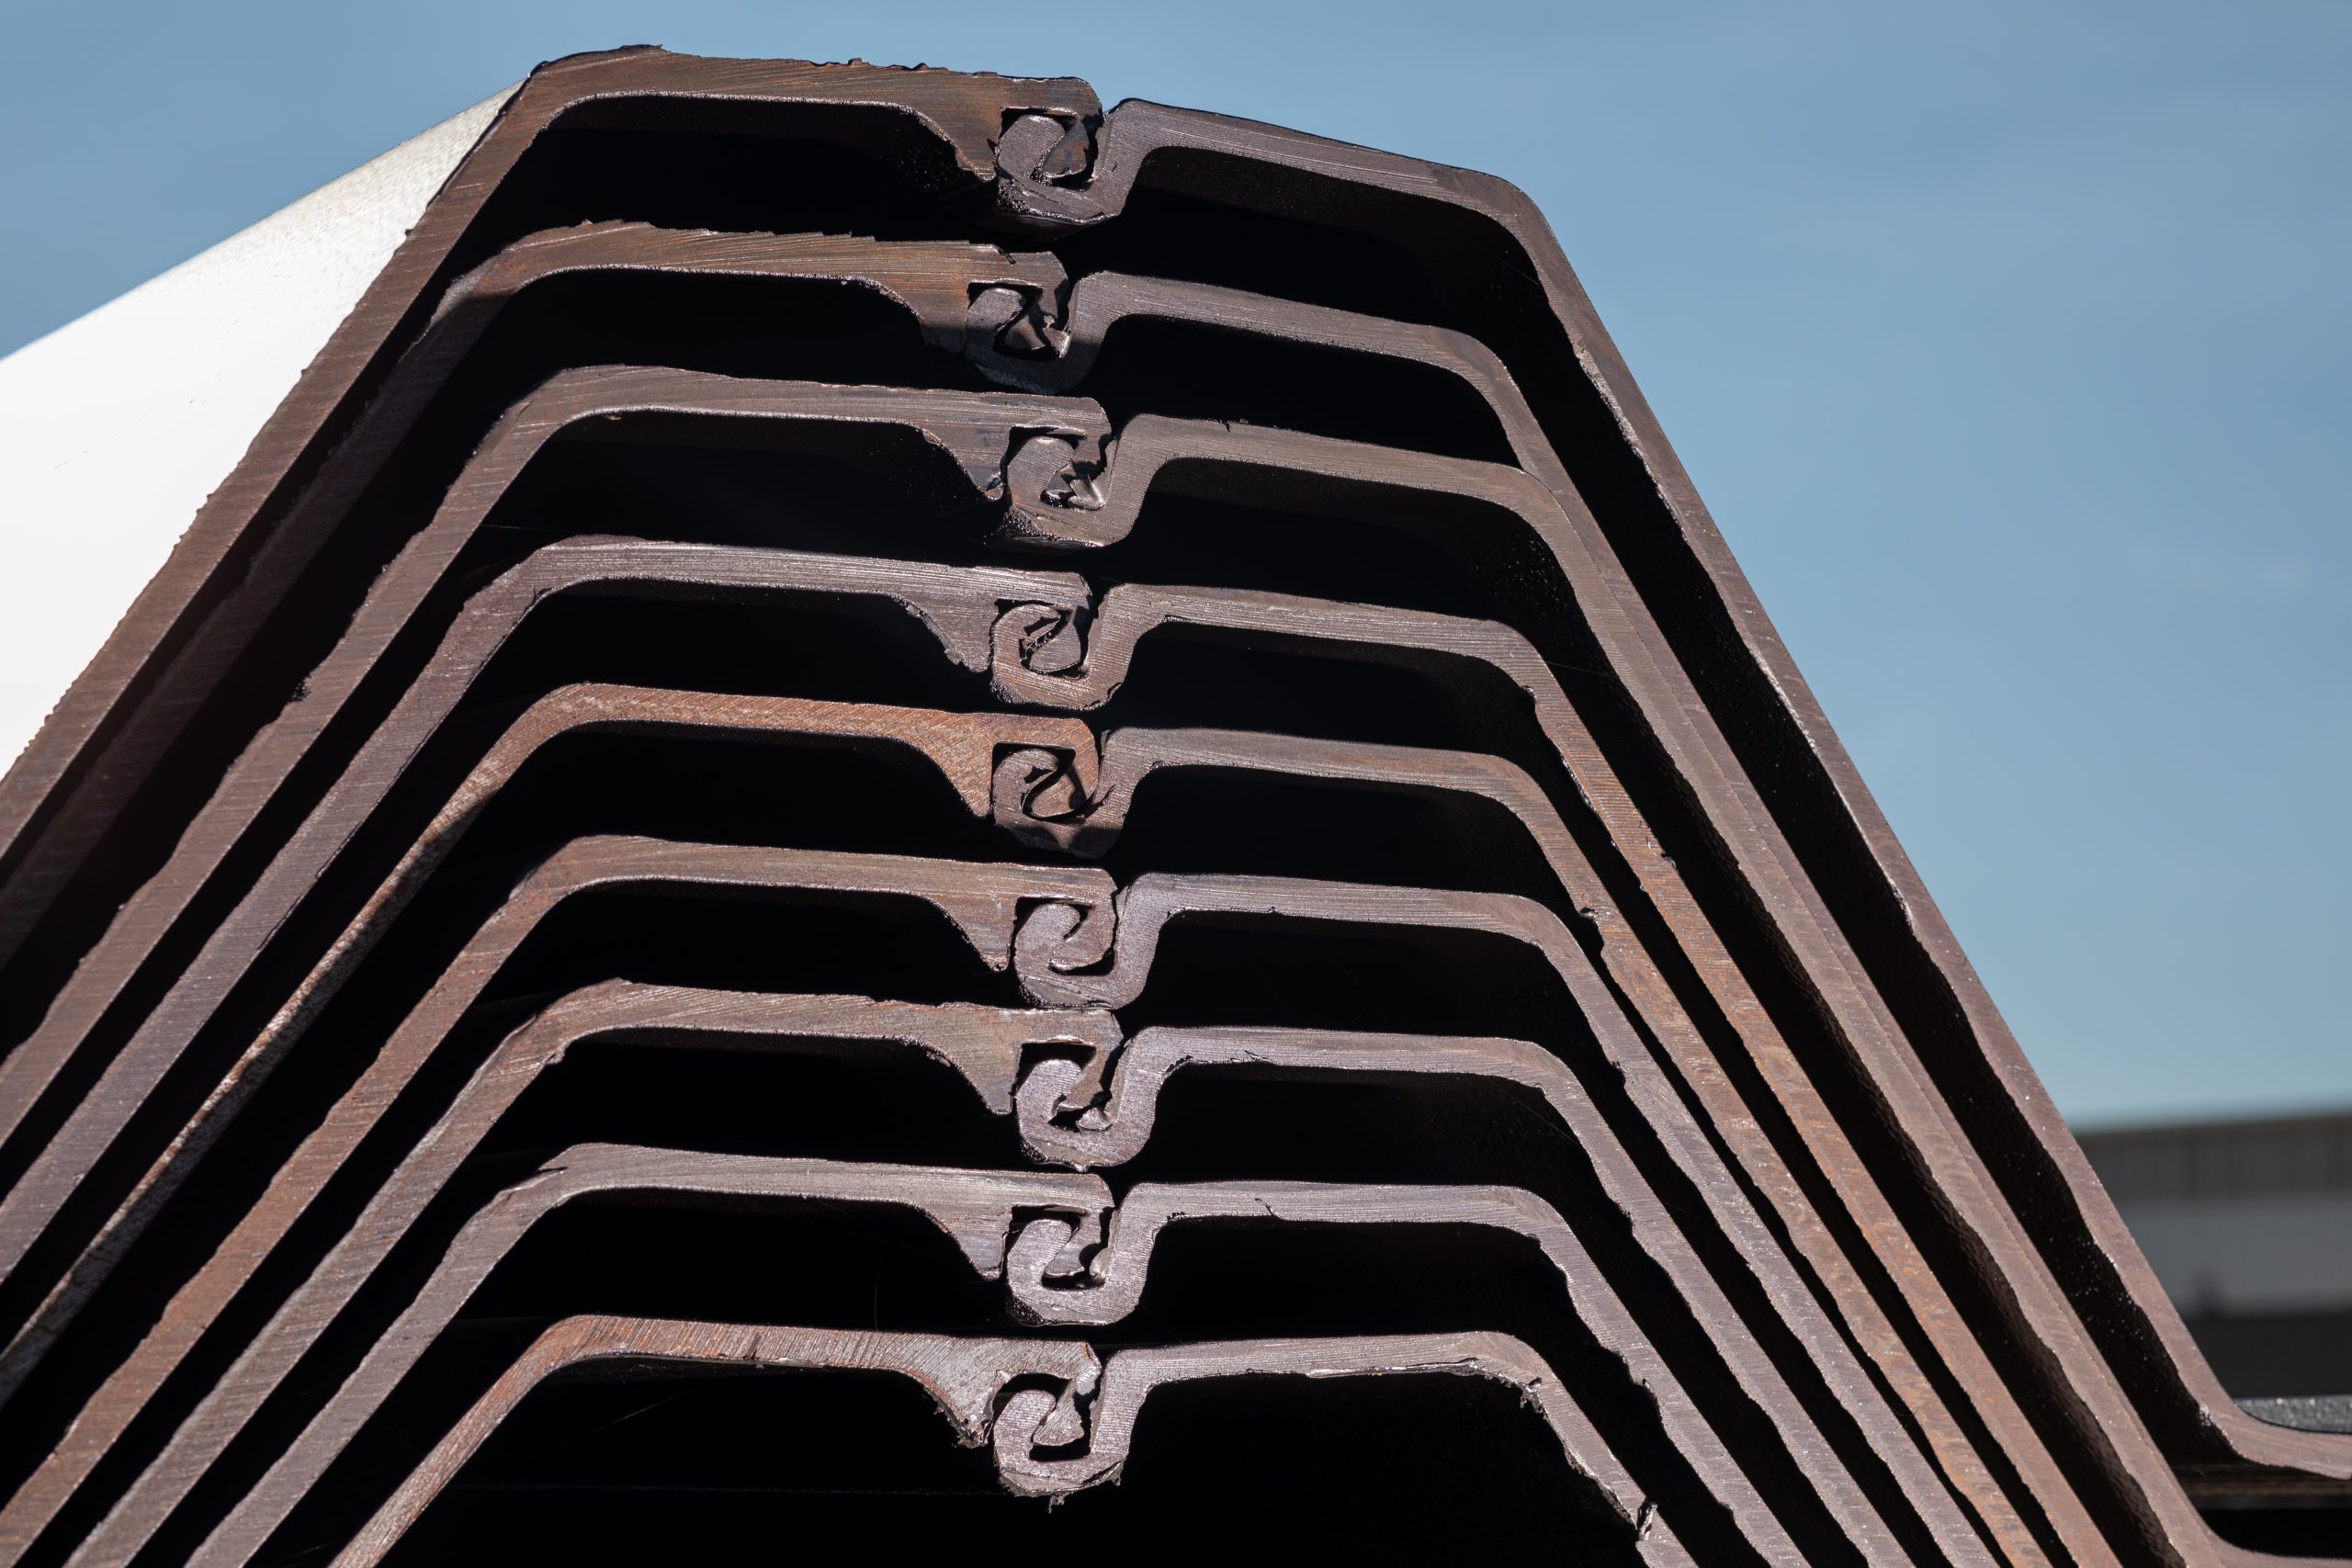
NEWS RELEASE Nucor Reports Results for the Third Quarter of 2026 2026-10-26 Third Quarter of 2026 Highlights Net earnings attributable to Nucor stockholders of $1.32 billion, or $5.80 per diluted share Net sales of $11.25 billion Net earnings…
NEWS RELEASE
Nucor Reports Results for the Third Quarter of 2026
2026-10-26
Third Quarter of 2026 Highlights
Net earnings attributable to Nucor stockholders of $1.32 billion, or $5.80 per diluted share
Net sales of $11.25 billion
Net earnings before noncontrolling interests of $1.47 billion; EBITDA of $2.28 billion
CHARLOTTE, N.C., Oct. 26, 2026 /PRNewswire/ -- Nucor Corporation (NYSE: NUE) today announced consolidated net
earnings attributable to Nucor stockholders of $1.32 billion, or $5.80 per diluted share, for the third quarter of
2026. By comparison, Nucor reported consolidated net earnings attributable to Nucor stockholders of $1.16 billion,
or $5.04 per diluted share, and adjusted net earnings attributable to Nucor stockholders of $1.11 billion, or $4.84
per diluted share, for the second quarter of 2026. Nucor reported consolidated net earnings attributable to Nucor
stockholders of $607 million, or $2.63 per diluted share, for the third quarter of 2025.
Second quarter of 2026 results included a non-cash, pre-tax bene t of $61 million ($0.20 per diluted share) related
to the increase in the valuation of our investment in Helion, a fusion energy company.
"I want to thank our teammates for delivering another strong quarter and making 2026 the safest summer in Nucor
history," said Leon Topalian, Nucor's Chair and Chief Executive O cer. "Supported by robust demand across key
end markets, Nucor has generated approximately $2.7 billion of free cash ow and returned nearly $1.4 billion to
shareholders through the rst nine months of the year. We also achieved important milestones in advancing our
growth strategy, including the rst heat at our West Virginia sheet mill in September and the recent start-up of our
second galvanizing line at Nucor Steel Berkeley. These projects, together with other recent investments, are
expanding Nucor's capabilities and strengthening our position in attractive markets. With our diversi ed portfolio,
strong balance sheet and disciplined approach to capital allocation, Nucor is well positioned to deliver long-term
shareholder value."
Earnings Before Income Taxes and Noncontrolling Interests by Segment (In millions)
Steel mills
Steel products
Raw materials
Corporate/eliminations
Three Months (13 Weeks) Ended
October 3, 2026
July 4, 2026
October 4, 2025
$
1,788
$
1,556
$
793
465
353
319
105
146
43
(491)
(430)
(272)
$
1,867
$
1,625
$
883
Nine Months (39 Weeks) Ended
October 3, 2026
October 4, 2025
$
4,472
$
1,867
1,094
999
296
129
(1,274)
(928)
$
4,588
$
2,067
1
Analysis of Third Quarter of 2026 Results Compared to the Second Quarter of 2026
Third quarter earnings increased in the steel mills and steel products segments, while decreasing in the raw
materials segment. The increase in the steel mills segment was due to higher average selling prices and increased
volumes, partially o set by higher costs of products sold. Second quarter steel mills segment cost of products sold
was reduced by $130 million in cash refunds associated with prior periods' raw material procurement costs, which
did not recur in the third quarter of 2026. The increase in earnings in the steel products segment was due to higher
volumes and higher average realized pricing. Raw materials segment earnings decreased due to lower pricing and
shipments.
Corporate/eliminations expense in the third quarter increased due primarily to the absence of the Helion valuation
adjustment.
Financial Strength
At the end of the third quarter of 2026, Nucor had $3.64 billion in cash and cash equivalents and short-term
investments on hand. The Company's $2.25 billion revolving credit facility remains undrawn and does not expire
until March 2030. The Company continues to have the strongest credit ratings in the North American steel sector
(A-/A-/A3) with stable outlooks at Standard & Poor's, Fitch Ratings and Moody's, respectively.
Commitment to Returning Capital to Stockholders
During the third quarter of 2026, Nucor repurchased approximately 2.03 million shares of its common stock at an
average price of $247.04 per share. Nucor returned approximately $629 million to stockholders in the third quarter
of 2026 in the form of share repurchases and dividend payments, and approximately $1.36 billion in the rst nine
months of 2026.
On September 18, 2026, Nucor's Board of Directors declared a cash dividend of $0.56 per share. This cash dividend
is payable on November 10, 2026, to stockholders of record as of September 30, 2026 and is Nucor's
214th consecutive quarterly cash dividend.
Fourth Quarter of 2026 Outlook Compared to the Third Quarter of 2026
We expect earnings in the fourth quarter of 2026 to be generally in-line with or modestly higher than the third
quarter. In the steel mills segment, we expect stable earnings due to higher realized pricing o set by seasonally
lower volumes and higher costs. In the steel products segment, we expect stable earnings on higher realized
pricing and seasonally lower volumes. The raw materials segment is expected to have slightly lower earnings due to
lower realized DRI pricing. Intersegment pro t eliminations are expected to decrease in the fourth quarter.
Earnings Conference Call
An earnings call is scheduled for October 27, 2026 at 10:00 a.m. Eastern Time to review Nucor's third quarter of
2026 nancial results and provide a business update. The call can be accessed via webcast from the Investor
Relations section of Nucor's website (nucor.com/investors). A presentation with supplemental information to
accompany the call has been posted to Nucor's Investor Relations website. A playback of the webcast will be posted
to the same site within one day of the live event.
About Nucor
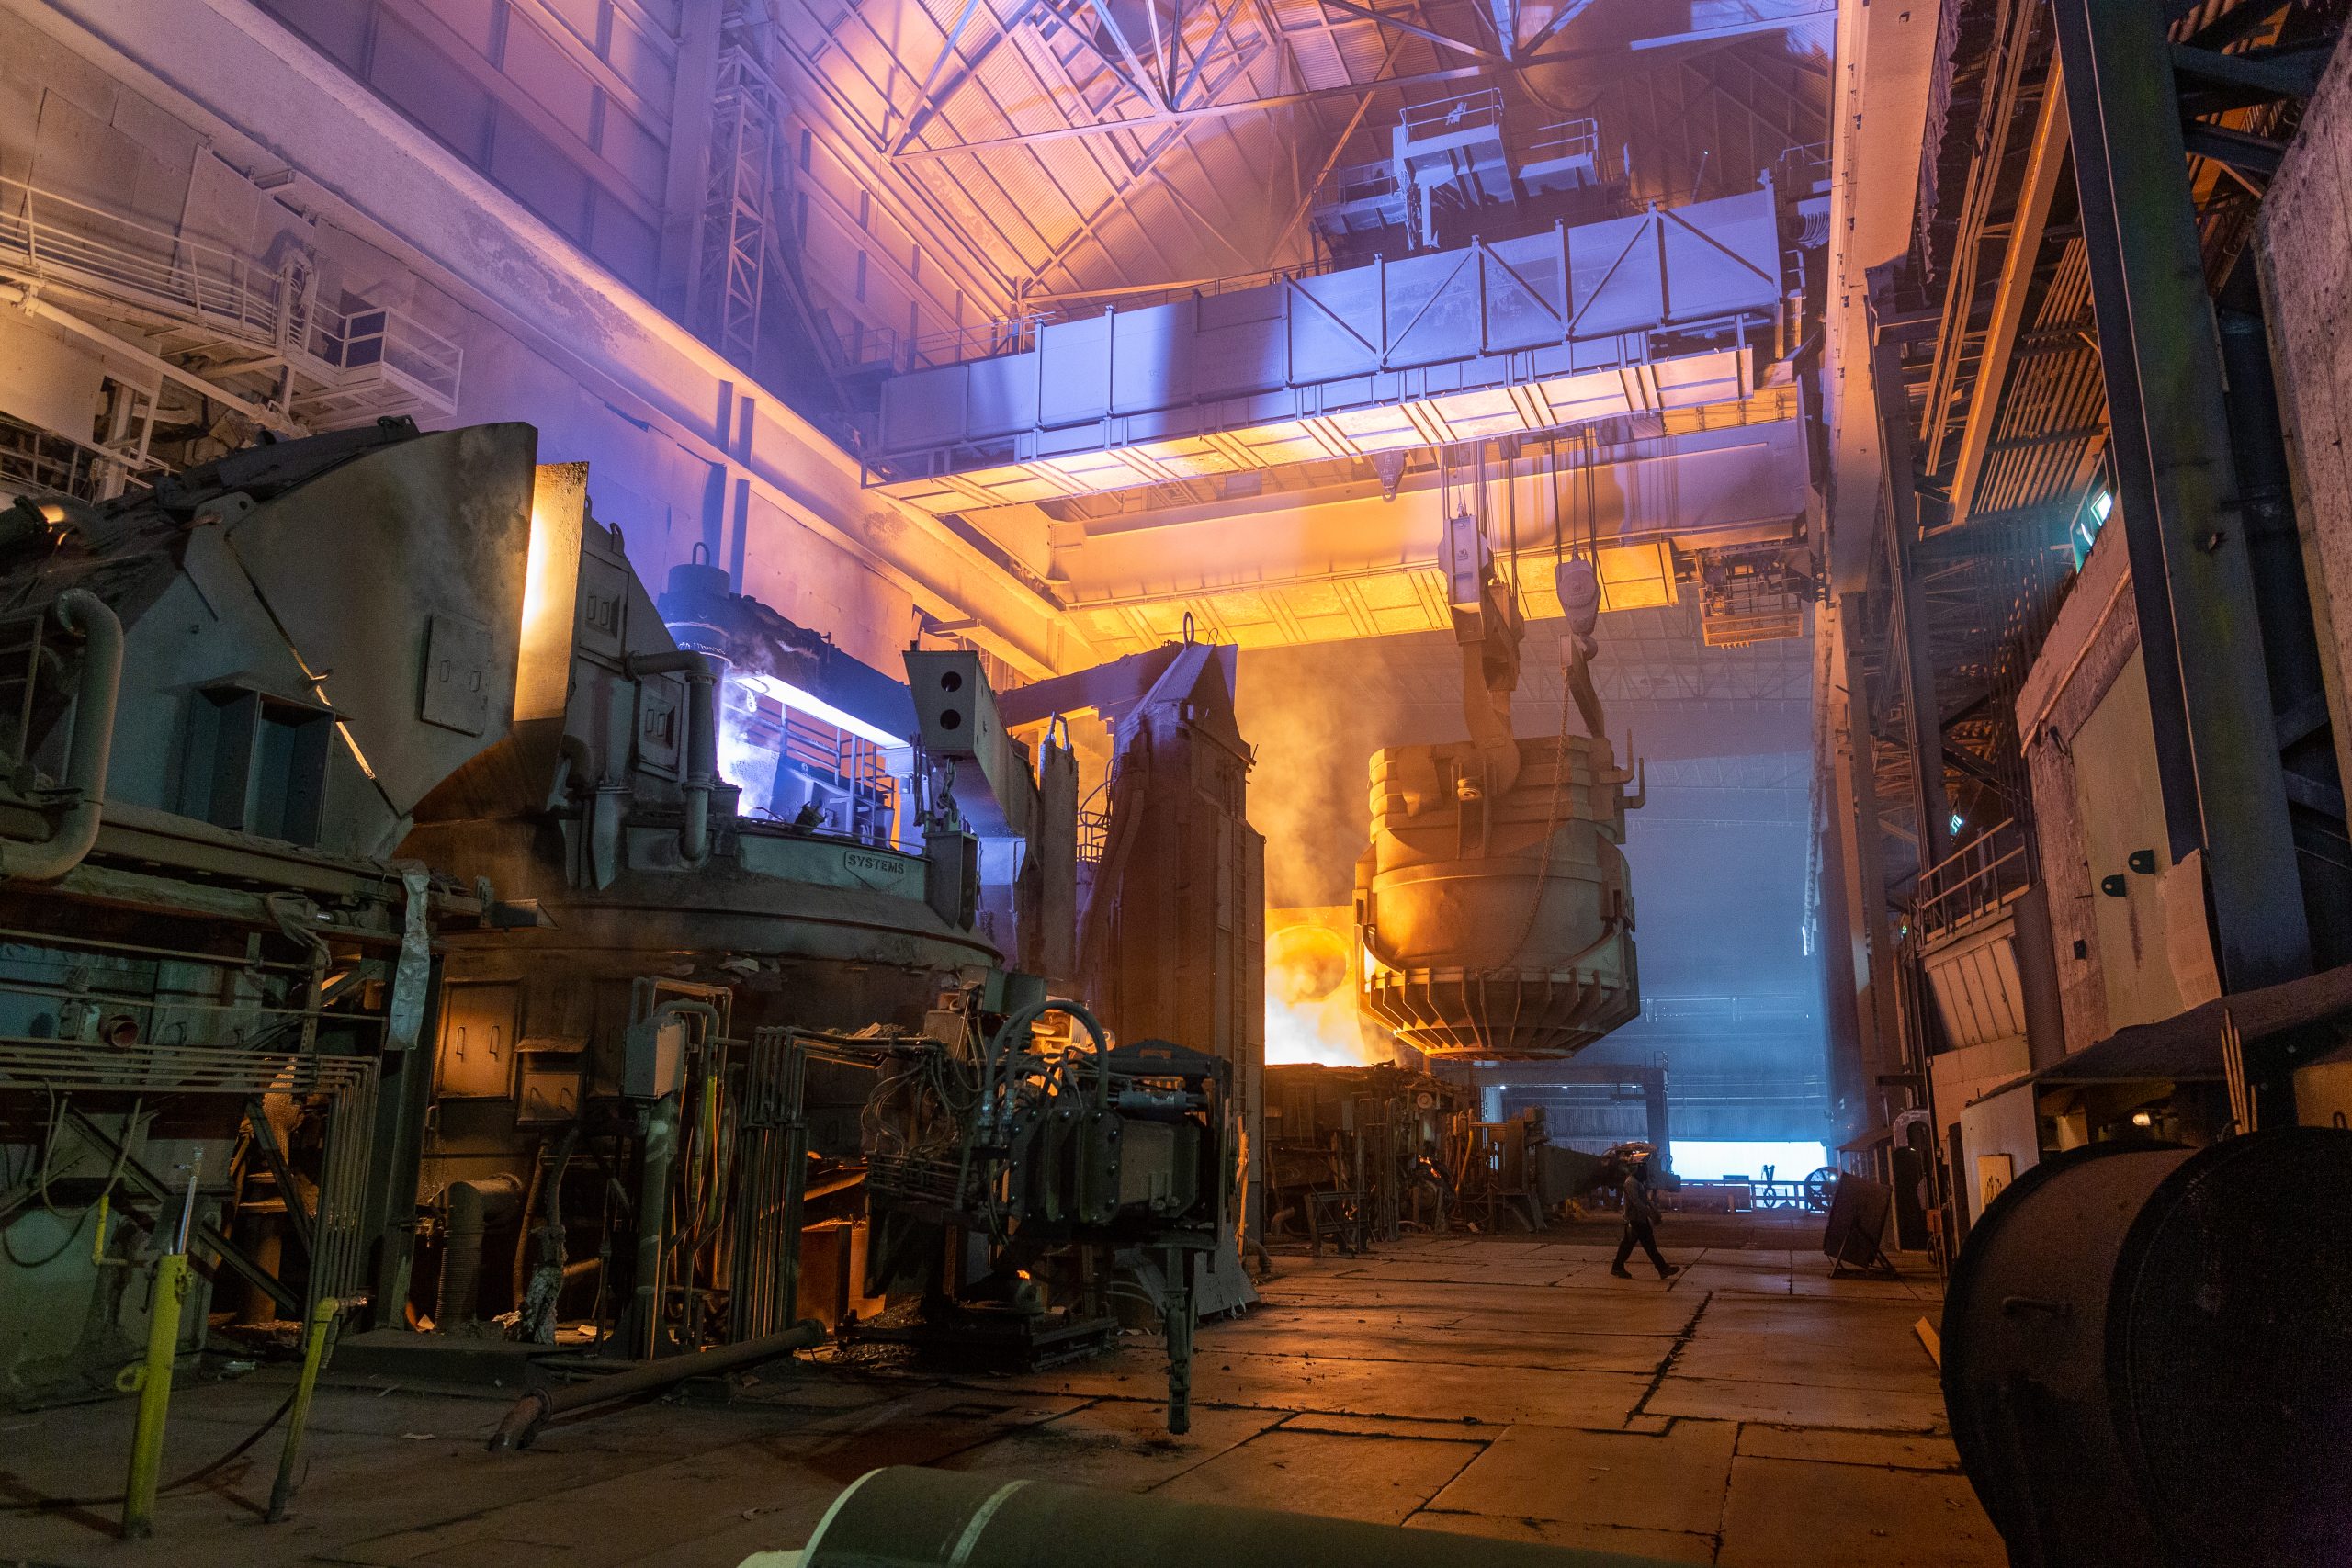
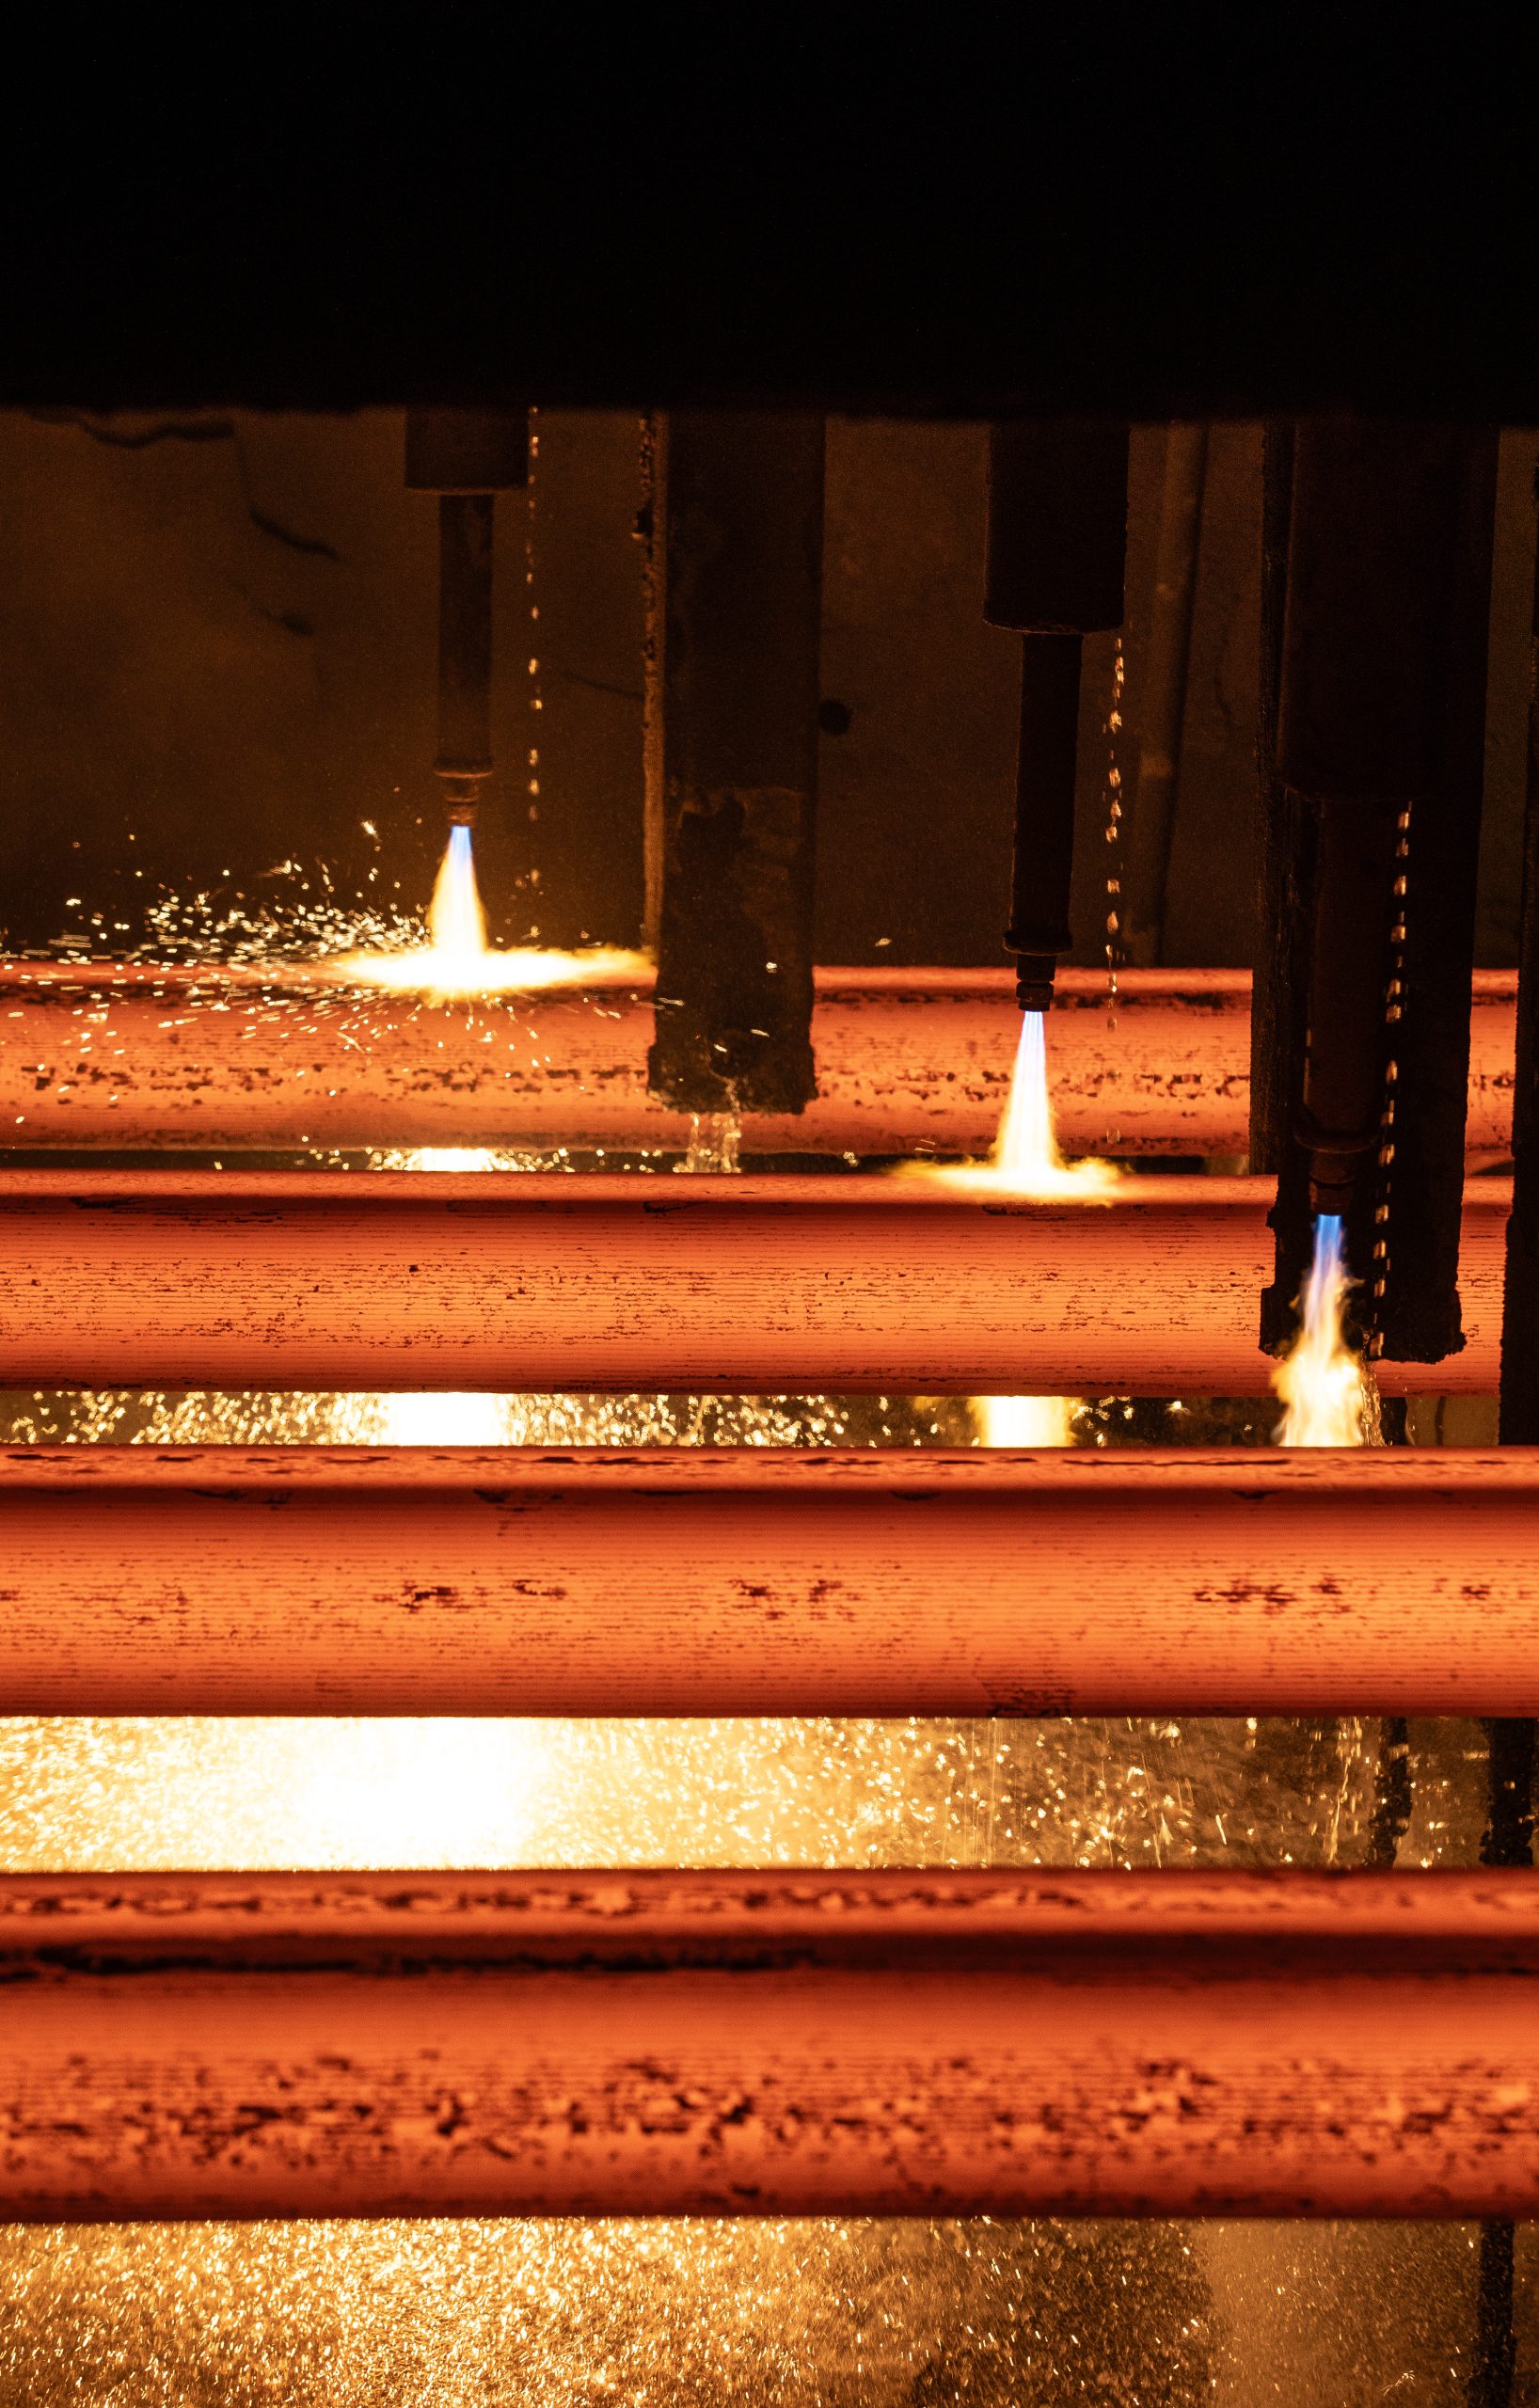
Nucor and its a liates are manufacturers of steel and steel products, with operating facilities in the United States,
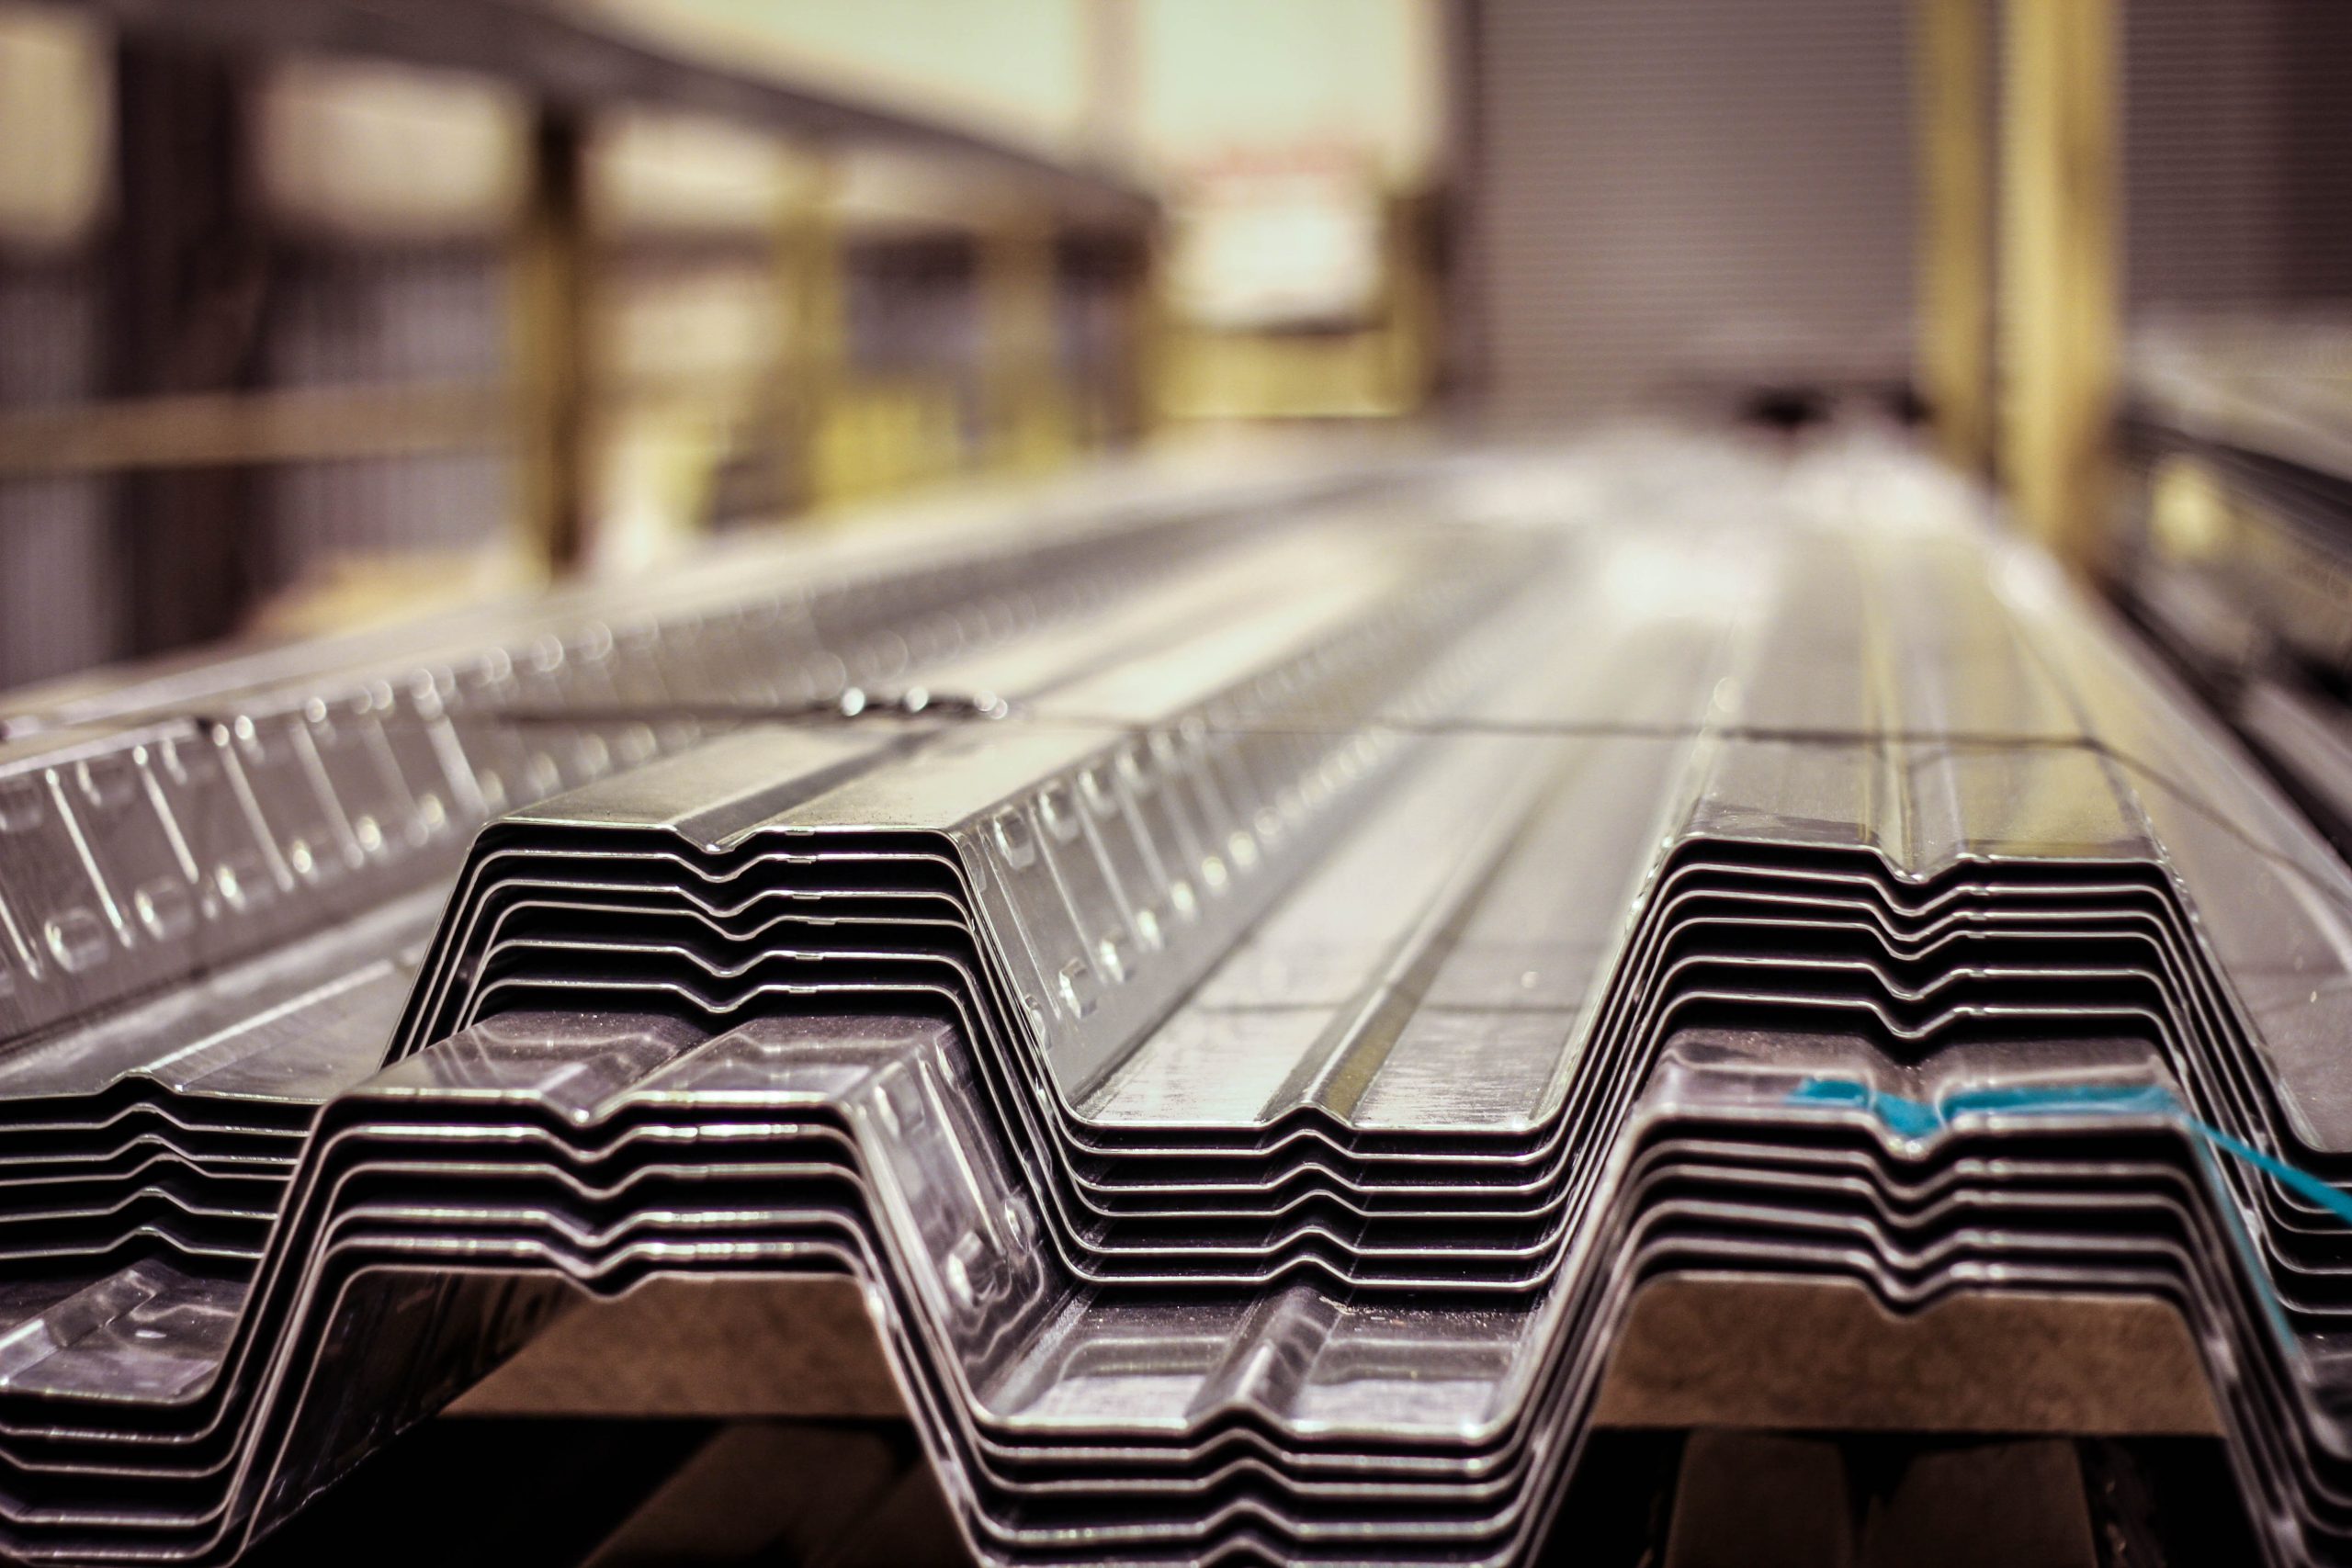
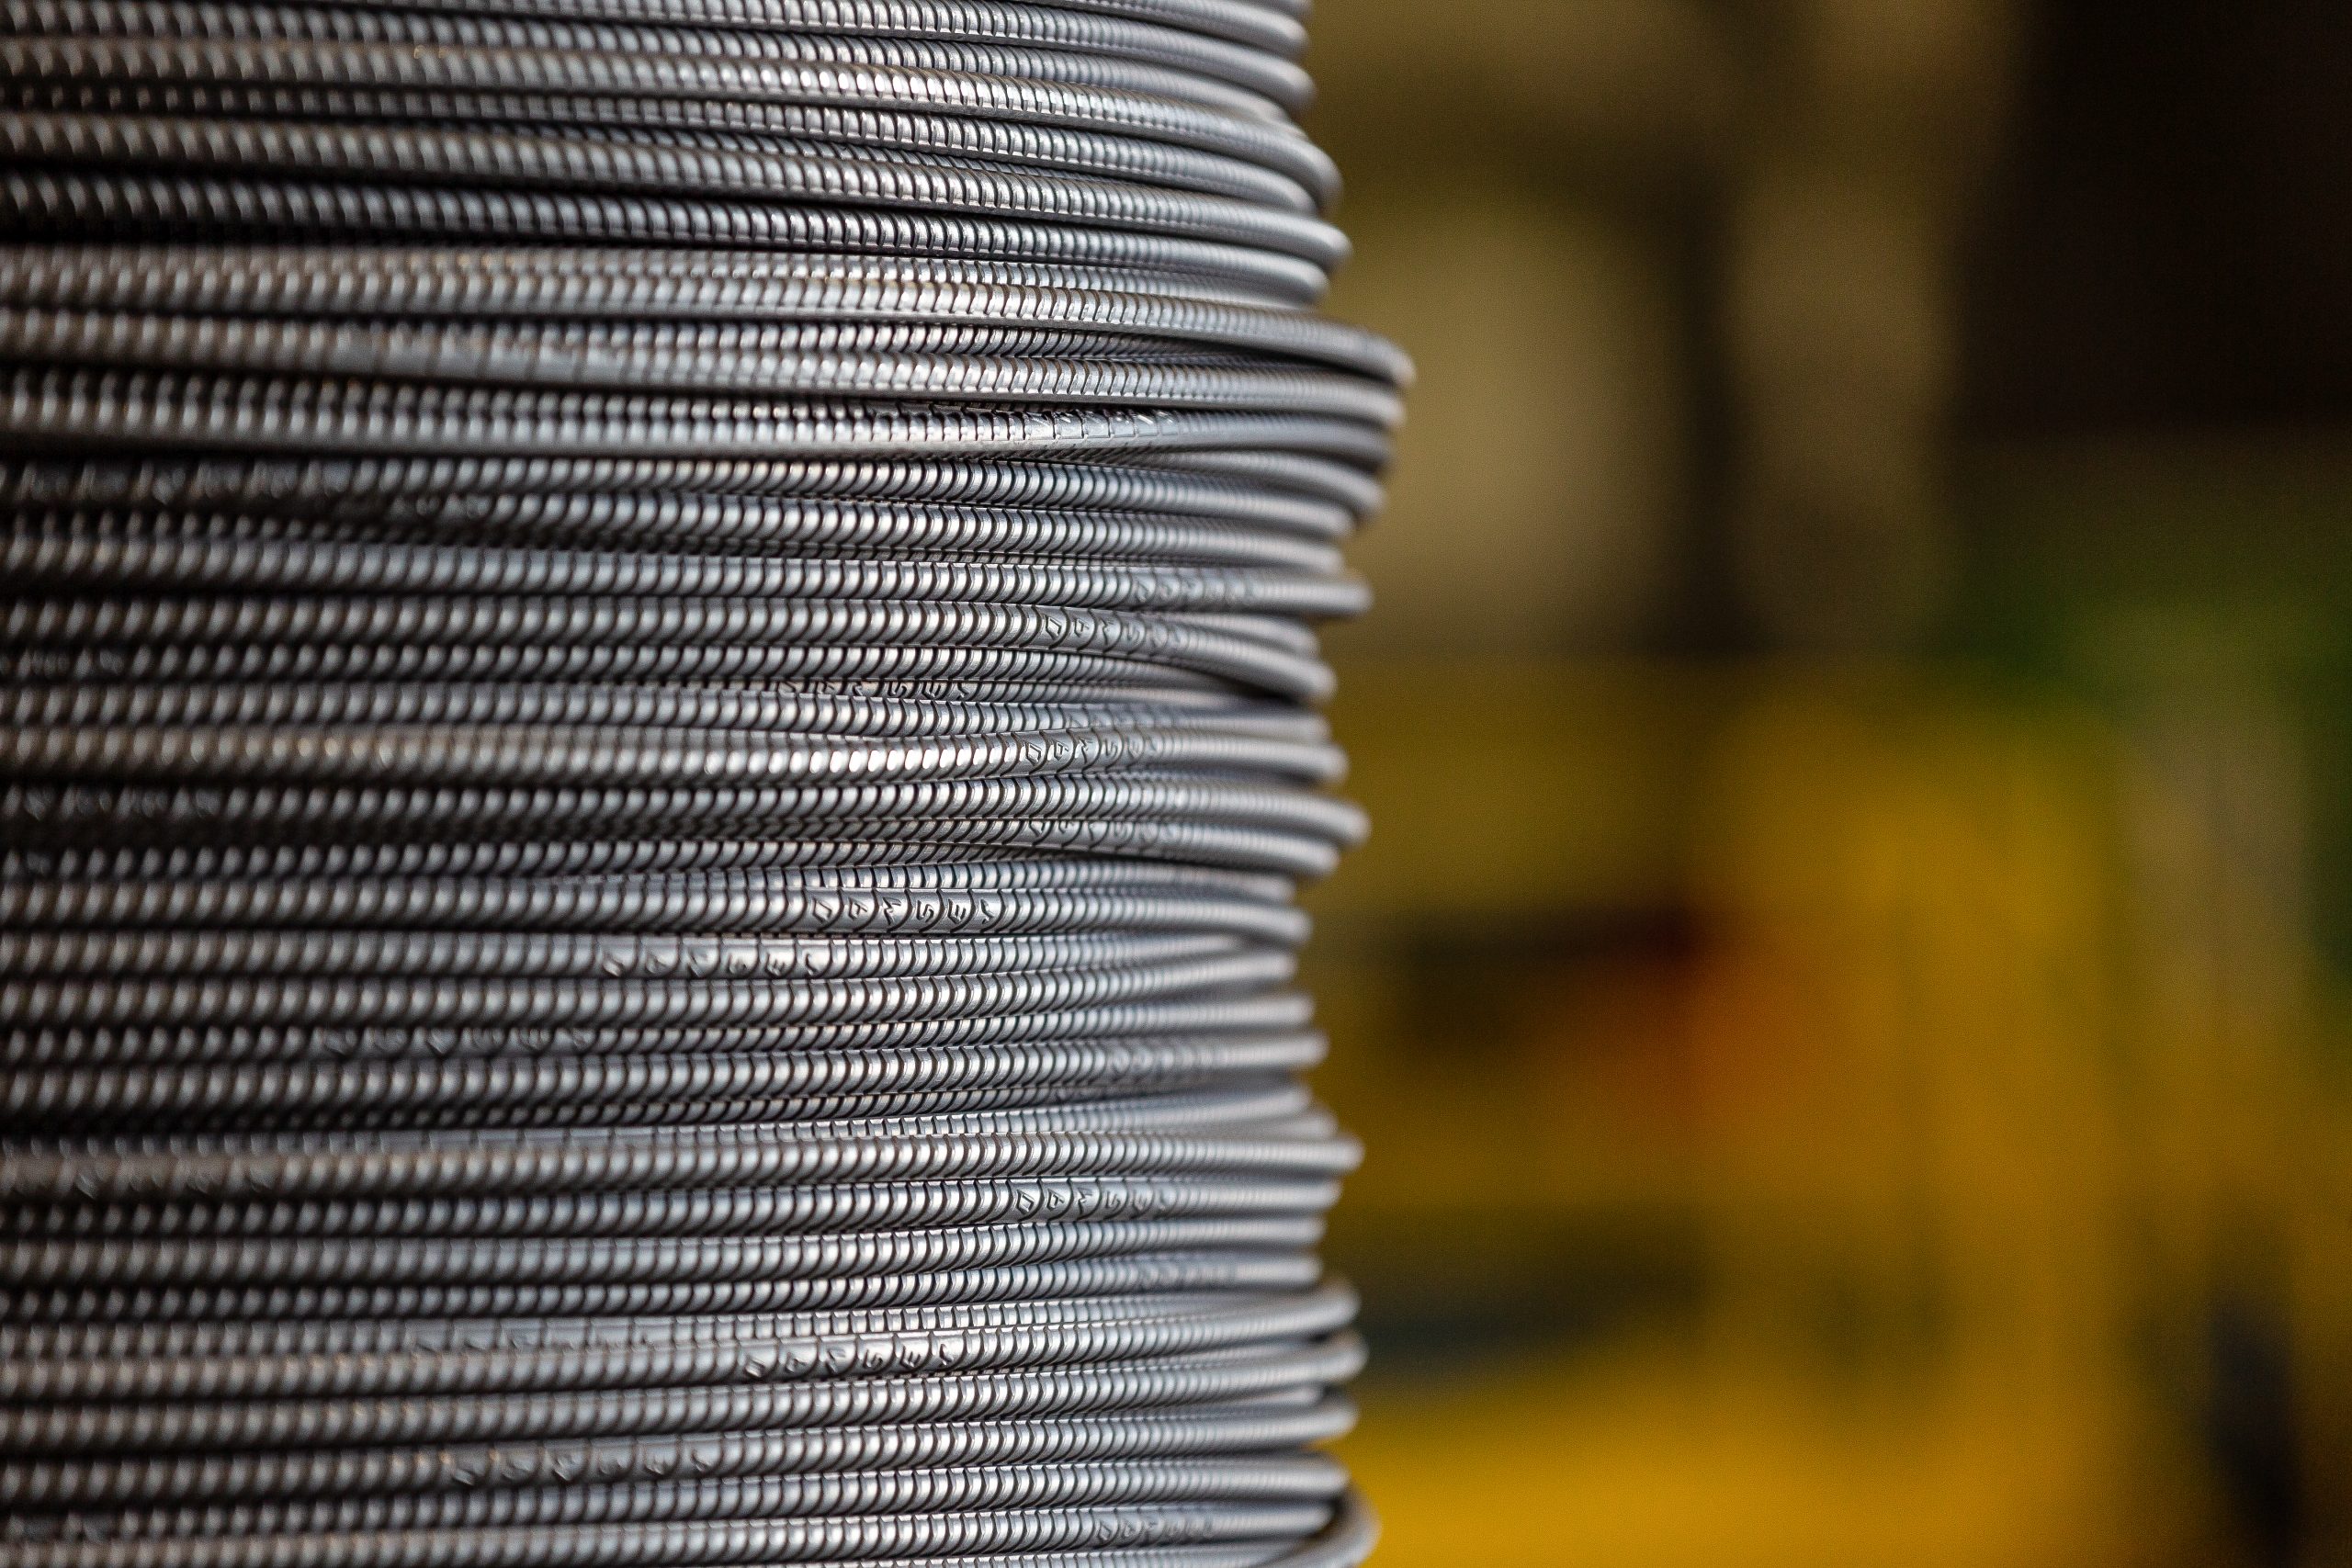
Canada and Mexico. Products produced include: carbon and alloy steel -- in bars, beams, sheet and plate; hollow
structural section tubing; electrical conduit; steel racking; steel piling; steel joists and joist girders; steel deck;
fabricated concrete reinforcing steel; cold nished steel; precision castings; steel fasteners; metal building systems;
insulated metal panels; overhead doors; steel grating; wire and wire mesh; and utility structures. Nucor, through
2
The David J. Joseph Company and its a liates, also brokers ferrous and nonferrous metals, pig iron and hot
briquetted iron / direct reduced iron; supplies ferro-alloys; and processes ferrous and nonferrous scrap. Nucor is
North America's largest recycler.
Non-GAAP Financial Measures
The Company uses certain non-GAAP (Generally Accepted Accounting Principles) nancial measures in this news
release, including EBITDA, adjusted net earnings attributable to Nucor stockholders, adjusted net earnings per
diluted share and, beginning in the third quarter of 2026, free cash ow. Generally, a non-GAAP nancial measure is
a numerical measure of a company's performance or nancial position that either excludes or includes amounts
that are not normally excluded or included in the most directly comparable nancial measure calculated and
presented in accordance with GAAP.
We de ne EBITDA as net earnings before noncontrolling interests, adding back the following items: interest
expense (income), net; provision for income taxes; losses and impairments of assets; depreciation; and
amortization. For the second quarter of 2026, we de ned adjusted net earnings attributable to Nucor stockholders
as net earnings attributable to Nucor stockholders subtracting certain non-cash bene ts (in this case, the increase
in the value of our investment in Helion), net of tax. We de ne adjusted net earnings per diluted share as net
earnings per diluted share subtracting certain non-cash bene ts (in this case, the per diluted share impact of the
increase in the value of our investment in Helion), net of tax. We de ne free cash ow as cash provided by
operating activities less capital expenditures. Please note that other companies might de ne their nonGAAP nancial measures di erently than we do.
Management presents the non-GAAP nancial measures of EBITDA, adjusted net earnings attributable to Nucor
stockholders, adjusted net earnings per diluted share and free cash ow in this news release because it considers
them to be important supplemental measures of performance. Management believes that these nonGAAP nancial measures provide additional insight for analysts and investors evaluating the Company's nancial
and operational performance by providing a consistent basis of comparison across periods.
Forward-Looking Statements
Certain statements contained in this news release are "forward-looking statements" that involve risks and
uncertainties which we expect will or may occur in the future and may impact our business, nancial condition and
results of operations. The words "anticipate," "believe," "expect," "intend," "project," "may," "will," "should," "could"
and similar expressions are intended to identify those forward-looking statements. These forward-looking
statements re ect the Company's best judgment based on current information, and, although we base these
statements on circumstances that we believe to be reasonable when made, there can be no assurance that future
events will not a ect the accuracy of such forward-looking information. As such, the forward-looking statements
are not guarantees of future performance, and actual results may vary materially from the projected results and
expectations discussed in this news release. Factors that might cause the Company's actual results to di er
materially from those anticipated in forward-looking statements include, but are not limited to: (1) competitive
pressure on sales and pricing, including pressure from imports and substitute materials; (2) U.S. and foreign trade
policies a ecting steel imports or exports; (3) the sensitivity of the results of our operations to general market
conditions, and in particular, prevailing market steel prices and changes in the supply and cost of raw materials,
including pig iron, iron ore and scrap steel; (4) the availability and cost of electricity and natural gas, which could
negatively a ect our cost of steel production or result in a delay or cancellation of existing or future drilling within
our natural gas drilling programs; (5) critical equipment failures and business interruptions; (6) market demand for
steel products, which, in the case of many of our products, is driven by the level of nonresidential construction
activity in the United States; (7) impairment in the recorded value of inventory, equity investments, xed assets,
goodwill or other long-lived assets; (8) uncertainties and volatility surrounding the global economy, including excess
3
world capacity for steel production, in ation and interest rate changes; (9) uctuations in currency conversion rates;
(10) signi cant changes in laws or government regulations a ecting environmental compliance, including legislation
and regulations that result in greater regulation of greenhouse gas emissions that could increase our energy costs,
capital expenditures and operating costs or cause one or more of our permits to be revoked or make it more
di cult to obtain permit modi cations; (11) the cyclical nature of the steel industry; (12) capital investments and
their impact on our performance; (13) our safety performance; (14) our ability to integrate businesses we acquire;
and (15) the impact of any pandemic or public health situation. These and other factors are discussed in Nucor's
regulatory lings with the United States Securities and Exchange Commission, including those in "Item 1A. Risk
Factors" of Nucor's Annual Report on Form 10-K for the year ended December 31, 2025. The forward-looking
statements contained in this news release speak only as of this date, and Nucor does not assume any obligation to
update them, except as may be required by applicable law.
Consolidated Financial Statements
Nucor Corporation Condensed Consolidated Statements of Earnings (Unaudited)
(In millions, except per share amounts)
Three Months (13 Weeks) Ended
October 3,
October 4,
2026
July 4, 2026
2025
$ 11,249
$ 10,397
$ 8,521
Net sales
Costs, expenses and other:
Cost of products sold
Marketing, administrative and other expenses
Equity in earnings of unconsolidated affiliates
Losses and impairments of assets
Interest expense (income), net
Earnings before income taxes and noncontrolling
interests
Provision for income taxes
Net earnings before noncontrolling interests
Earnings attributable to noncontrolling interests
Net earnings attributable to Nucor stockholders
Net earnings per share:
Basic
Diluted
Average shares outstanding:
Basic
Diluted
Nine Months (39 Weeks) Ended
October 3,
October 4,
2026
2025
$
31,142
$
24,807
8,923
444
(9)
17
7
9,382
8,363
405
(8)
12
8,772
7,333
300
(10)
15
7,638
25,281
1,227
(24)
32
38
26,554
21,791
885
(24)
40
48
22,740
$
1,867
394
1,473
154
1,319
$
1,625
345
1,280
124
1,156
$
883
200
683
76
607
$
4,588
965
3,623
405
3,218
$
2,067
452
1,615
249
1,366
$
$
5.81
5.80
$
$
5.05
5.04
$
$
2.63
2.63
$
$
14.08
14.06
$
$
5.89
5.88
226.4
226.7
228.2
228.5
229.9
230.2
227.8
228.2
231.1
231.4
Nucor Corporation Condensed Consolidated Balance Sheets (Unaudited)
(In millions)
ASSETS
Current assets:
Cash and cash equivalents
Short-term investments
Accounts receivable, net
Inventories, net
Other current assets
Total current assets
Property, plant and equipment, net
Goodwill
Other intangible assets, net
Other assets
Total assets
LIABILITIES
Current liabilities:
Short-term debt
C
t
ti
fl
t
d bt
October 3, 2026
December 31, 2025
$
3,467
173
4,296
6,020
398
14,354
16,103
4,290
2,693
924
38,364
$
130
579
$
$
d fi
l
bli
ti
$
$
2,260
439
3,105
5,462
499
11,765
15,306
4,297
2,880
856
35,104
122
90
4
Current portion of long-term debt and finance lease obligations
Accounts payable
Salaries, wages and related accruals
Accrued expenses and other current liabilities
Total current liabilities
Long-term debt and finance lease obligations due after one year
Deferred credits and other liabilities
Total liabilities
Commitments and contingencies
EQUITY
Nucor stockholders' equity:
Common stock
Additional paid-in capital
Retained earnings
Accumulated other comprehensive loss,
net of income taxes
Treasury stock
Total Nucor stockholders' equity
Noncontrolling interests
Total equity
Total liabilities and equity
$
579
2,380
1,335
1,406
5,830
6,384
2,059
14,273
90
1,890
882
1,020
4,004
6,909
2,067
12,980
152
2,221
34,338
152
2,253
31,504
(222)
(13,678)
22,811
1,280
24,091
38,364
(194)
(12,779)
20,936
1,188
22,124
35,104
$
Nucor Corporation Condensed Consolidated Statements of Cash Flows (Unaudited)
(In millions)
Nine Months (39 Weeks) Ended
October 3, 2026
October 4, 2025
Operating activities:
Net earnings before noncontrolling interests
$
3,623
$
1,615
Adjustments:
Depreciation
967
910
Amortization
188
191
Impairment of assets
32
20
Stock-based compensation
129
102
Deferred income taxes
(71)
2
Distributions from affiliates
7
6
Equity in earnings of unconsolidated affiliates
(24)
(24)
Changes in assets and liabilities (exclusive of acquisitions and dispositions):
Accounts receivable
(1,203)
(614)
Inventories
(560)
(295)
Accounts payable
485
296
Federal income taxes
167
177
Salaries, wages and related accruals
458
20
Other operating activities
324
29
Cash provided by operating activities
4,522
2,435
Investing activities:
Capital expenditures
(1,861)
(2,620)
Investment in and advances to affiliates
(2)
(1)
Disposition of plant and equipment
34
42
Purchases of investments
(165)
(872)
Proceeds from the sale of investments
432
938
Divestiture of affiliate
4
Other investing activities
23
4
Cash used in investing activities
(1,535)
(2,509)
Financing activities:
Net change in short-term debt
8
(89)
Repayment of long-term debt
(42)
(1,012)
Proceeds from issuance of long-term debt, net of discount
15
997
Bond issuance costs
(1)
(9)
Proceeds from exercise of stock options
19
1
Payment of tax withholdings on certain stock-based compensation
(82)
(32)
Distributions to noncontrolling interests
(314)
(231)
Cash dividends
(386)
(385)
Acquisition of treasury stock
(976)
(600)
Proceeds from government incentives
77
Other financing activities
(14)
14
Cash used in financing activities
(1,773)
(1,269)
Effect of exchange rate changes on cash
(7)
6
Increase (decrease) in cash and cash equivalents
1,207
(1,337)
Cash and cash equivalents - beginning of year
2,260
3,558
$
3,467
$
2,221
Cash and cash equivalents - end of nine months
Non-cash investing activity:
$
6
$
14
Change in accrued plant and equipment purchases
5
Select Financial and Operational Data
(Dollars in millions, tons in thousands, per unit amounts as noted)
Three Months (13 Weeks) Ended
Nine Months (39 Weeks) Ended
October
July 4,
October
Year Ago
October 3,
October 4,
3, 2026
2026
% Change
4, 2025
% Change
2026
2025
% Change
Consolidated Financial & Operational
Data
Net Sales
$ 11,249
$ 10,397
8 % $ 8,521
32 % $ 31,142
$ 24,807
26 %
External Average Sales Price per Ton $ 1,493
$ 1,367
9 % $ 1,258
19 % $
1,380
$
1,215
14 %
Sales Tons to External Customers
7,533
7,605
-1 %
6,774
11 %
22,565
20,424
10 %
Pre-Operating & Start-Up Costs
$
124
$
120
3 % $
103
20 % $
352
$
408
-14 %
Pre-Operating & Start-Up Costs per
Diluted Share
$
0.42
$
0.40
$ 0.34
$
1.17
$
1.34
Number of Days in Period
91
91
91
276
277
Steel Mills Segment Data
Total Shipments
7,231
7,100
2 %
6,428
12 %
21,377
19,365
10 %
Sales Tons to External Customers
5,662
5,659
0 %
4,976
14 %
16,940
15,246
11 %
Percentage of Sales to Internal
Customers
22 %
20 %
23 %
21 %
21 %
External Average Sales Price per Ton $ 1,233
$ 1,145
8 % $ 1,038
19 % $
1,151
$
1,005
15 %
Average Scrap/Scrap Substitute Cost
per Gross Ton
$
421
$
422
0 % $
391
8 % $
416
$
396
5 %
Utilization
89 %
91 %
85 %
89 %
83 %
Steel Products Segment Data
Sales Tons to External Customers
1,363
1,285
6 %
1,183
15 %
3,807
3,372
13 %
Average Sales Price per Ton
$ 2,576
$ 2,415
7 % $ 2,358
9 % $
2,470
$
2,329
6 %
Tonnage Data (in thousands)
Steel mills total shipments:
Sheet
Bars
Structural
Plate
Other
October 3,
2026
Sales tons to outside customers:
Steel mills
Joist and deck
Rebar fabrication products
Tubular products
Building Systems
Other steel products
Raw materials
Three Months (13 Weeks) Ended
July 4,
%
October 4,
2026
Change
2025
Year Ago
% Change
Nine Months (39 Weeks) Ended
October 3, October 4,
%
2026
2025
Change
3,259
2,497
667
782
26
7,231
3,291
2,387
628
757
37
7,100
-1 %
5 %
6 %
3 %
-30 %
2 %
3,030
2,190
595
594
19
6,428
8 %
14 %
12 %
32 %
37 %
12 %
9,944
7,192
1,944
2,186
111
21,377
9,068
6,628
1,807
1,777
85
19,365
10 %
9 %
8 %
23 %
31 %
10 %
5,662
237
341
375
74
336
508
7,533
5,659
198
344
338
59
346
661
7,605
0 %
20 %
-1 %
11 %
25 %
-3 %
-23 %
-1 %
4,976
254
356
206
62
305
615
6,774
14 %
-7 %
-4 %
82 %
19 %
10 %
-17 %
11 %
16,940
620
976
1,031
188
992
1,818
22,565
15,246
653
909
719
174
917
1,806
20,424
11 %
-5 %
7 %
43 %
8 %
8 %
1 %
10 %
Non-GAAP Financial Measures
Reconciliation of EBITDA (Unaudited)
(In millions)
Net earnings before noncontrolling
interests
Depreciation
Amortization
Losses and impairments of assets
I t
t
(i
)
t
Three Months (13 Weeks) Ended
October 3, 2026 July 4, 2026 October 4, 2025
$
1,473
326
62
17
7
$
1,280
320
63
12
$
683
304
63
15
Nine Months (39 Weeks) Ended
October 3, 2026 October 4, 2025
$
3,623
967
188
32
38
$
1,615
910
191
40
48
6
Interest expense (income), net
Provision for income taxes
EBITDA
$
7
394
2,279
$
12
345
2,020
15
200
1,265
$
$
38
965
5,813
48
452
3,256
$
Reconciliation of Adjusted Net Earnings Attributable to Nucor Stockholders (Unaudited)
(In millions, except per share data)
Net earnings attributable to Nucor stockholders
Subtract non-cash benefit, net of tax
Adjusted net earnings attributable to Nucor stockholders
$
$
Three Months (13 Weeks) Ended
July 4, 2026
Diluted EPS
1,156
$
5.04
46
0.20
1,110
$
4.84
Reconciliation of Free Cash Flow (Unaudited)
(In millions)
Nine Months
(39 Weeks Ended)
October 3, 2026
Cash provided by operating activities
Subtract capital expenditures
Free cash flow
$
$
4,522
(1,861)
2,661
View original content to download multimedia:https://www.prnewswire.com/news-releases/nucor-reportsresults-for-the-third-quarter-of-2026-302919790.html
SOURCE Nucor Corporation
7