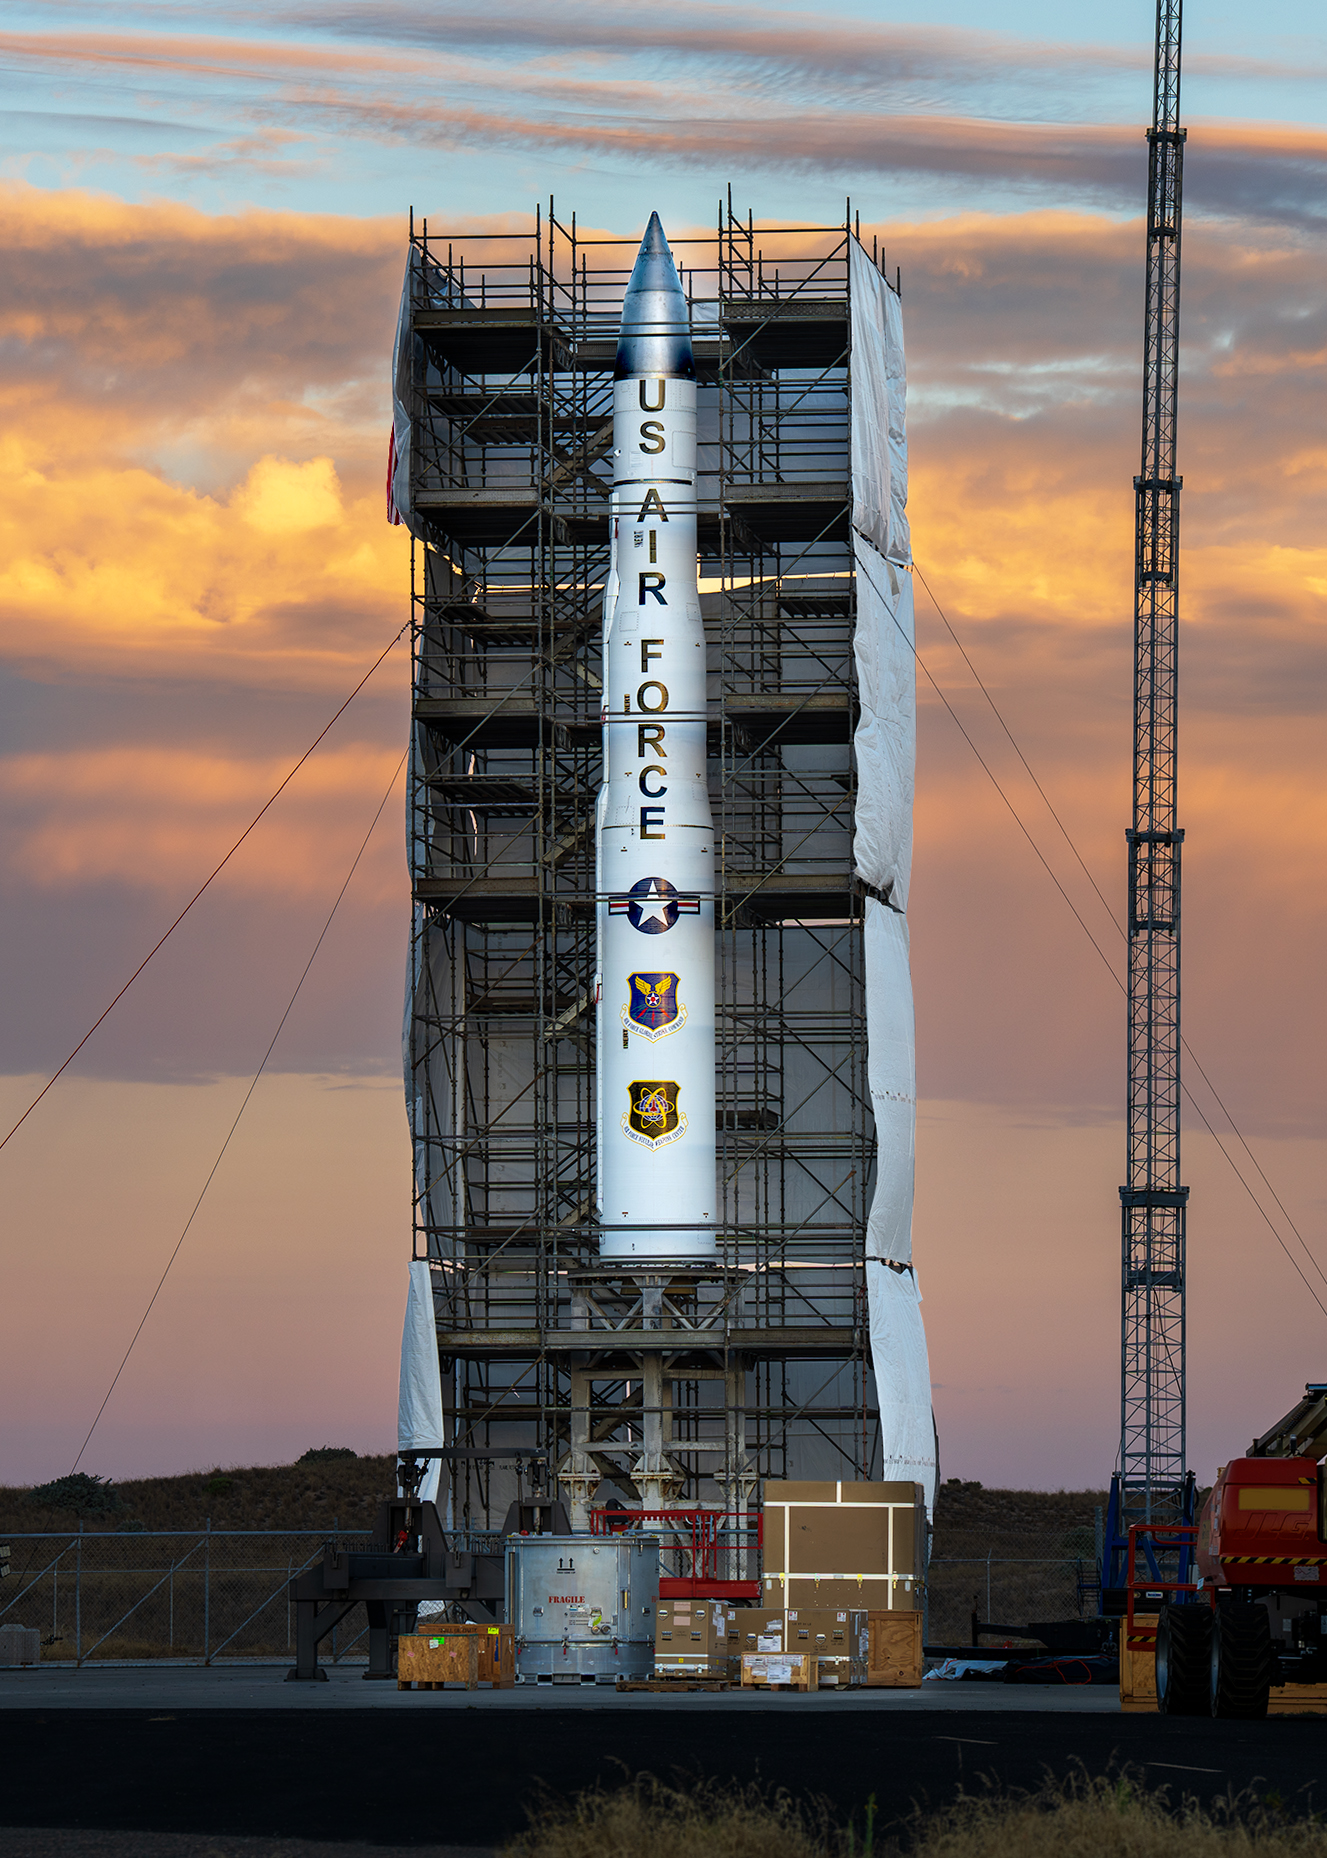
Northrop Grumman Corporation is an aerospace and defense technology company that designs, develops, and produces military aircraft, missile defense systems, advanced weapons, and space solutions. The company operates through four segments: Aeronautics Systems, Defense Systems, Mission Systems, and Space Systems. Key products include the B-21 Raider and B-2 Spirit stealth aircraft, the E-2D Advanced Hawkeye, MQ-4C Triton, and RQ-4 Global Hawk uncrewed aircraft. Defense Systems provides strategic deterrents like the Sentinel ICBM, precision strike weapons such as the AARGM and SiAW, and missile defense components. The third segment offers radar, electronic warfare, and cyber solutions, including the F-35 fire control radar and LAIRCM countermeasures. Space Systems delivers satellites, launch vehicles, and space infrastructure. The company serves the U.S. Department of Defense, the intelligence community, and international customers in the United States, Australia, the United Kingdom, Japan, South Korea, and the Middle East. Founded in 1939 as Northrop Aircraft Incorporated, the company formed its current name in 1994 following the acquisition of Grumman Corporation.

Summarised from the company's own disclosures, fiscal year ended Jan 2026

Industry Aerospace & Defense Homepage northropgrumman.com
Sector Industrials IR page investor.northropgrumman.com/corporate-governance/highlights
Tags
military aircraft, missile defense, strategic deterrence, uncrewed aircraft, radar systems, electronic warfare, cyber security, space systems, precision munitions, hypersonic weapons, command and control, nuclear triad, B-21 Raider, B-2 Spirit, E-130J Phoenix II, F-35 Lightning II, F/A-18 Super Hornet, E-2D Advanced Hawkeye, MQ-4C Triton, RQ-4 Global Hawk, Sentinel, Integrated Battle Command System, AARGM, SiAW, HACM, Precision Guidance Kit, PrSM, SM-3, LAIRCM, CIRCM, Distributed Aperture System, SABR, G/ATOR, SEWIP Block III, Manta Ray, NGInsight, Orbital ATK, Grumman Corporation, Litton Industries, Newport News Shipbuilding, TRW Inc., Westinghouse Electric Corporation
Press page —

Metrics

Valuation  
Market cap $ 78.91B
Market cap (USD) $ 78.91B
P/E 17.55
PEG —
P/BV 4.22
P/S 1.81
P/OCF 14.98
P/FCF 20.61
Dividend yield 1.7%
Turnover / mcap —
Returns  
ROE 26.2%
ROI 12.9%
ROIC 11.5%
Profit margin 10.0%
Growth  
Revenue growing Yes
Profits growing Yes
Revenue up 3y Yes
Revenue up 5y No
Earnings growth 3y (net profit CAGR) -5.1%
Quality  
Profitable Yes
Margin expanding Yes
Buying back stock Yes
Diluting (TTM) No
Debt/Equity 81.3%
Podcast bulls (TTM) Sign up
Podcast bears (TTM) Sign up
Podcast sentiment (TTM) Sign up
Podcast sentiment % (TTM) Sign up
News sentiment (TTM) 32
Quality score 36.8%
Insiders  
Buys, 1w Sign up
Buys, 1m Sign up
Buys, 1y Sign up
Sells, 1w Sign up
Sells, 1m Sign up
Sells, 1y Sign up

Sign up to see this company's insider trades

Figure FY 2025 FY 2024 FY 2023 FY 2022 FY 2021 FY 2020 FY 2019 FY 2018 FY 2017 FY 2016 FY 2015 FY 2014 FY 2013 FY 2012 FY 2011 FY 2010 FY 2009 FY 2008 FY 2007 FY 2006 FY 2005 FY 2004 FY 2003 FY 2002 FY 2001 FY 2000
Revenue 41.954B 41.033B 39.29B 36.602B 35.667B 36.799B 33.841B 30.095B 25.803B 24.508B 23.526B 23.979B 24.661B 25.218B 26.412B 34.757B 33.755B 33.887B 32.018B 30.148B 30.721B 29.853B 26.206B 17.206B 13.558B 7.618B
Net profit 4.182B 4.174B 2.056B 4.896B 7.005B 3.189B 2.248B 3.229B 2.015B 2.2B 1.99B 2.069B 1.952B 1.978B 2.118B 2.053B 1.686B -1.262B 1.79B 1.542B 1.4B 1.084B 866M 64M 427M 608M
Free cash flow 3.307B 2.621B 2.1B 1.466B 2.152B 2.885B 3.033B 2.578B 1.685B 1.893B 1.691B 2.032B 2.119B 2.309B 1.627B 1.683B 1.479B 2.53B 2.205B 1.019B 1.803B 1.264B 25.941B 17.929B 14.141B 8.209B

Figure FY 2025 FY 2024 FY 2023 FY 2022 FY 2021 FY 2020 FY 2019 FY 2018 FY 2017 FY 2016 FY 2015 FY 2014 FY 2013 FY 2012 FY 2011 FY 2010 FY 2009 FY 2008 FY 2007 FY 2006 FY 2005 FY 2004 FY 2003 FY 2002 FY 2001 FY 2000
Share price 570.21 469.29 468.14 545.61 387.07 304.72 343.97 244.9 306.91 232.58 188.81 147.39 114.61 67.58 58.48 64.78 55.83 45 — 67.42 — — — — — —
Price performance 12m 0.22 0 -0.14 0.41 0.27 -0.11 0.4 -0.2 0.32 0.23 0.28 0.29 0.7 0.16 -0.1 0.16 0.24 — — — — — — — — —

Filed figures

Figure Dec 2016 Dec 2017 Dec 2018 Dec 2019 Dec 2020 Dec 2021 Dec 2022 Dec 2023 Dec 2024 Dec 2025
Balance sheet detail
Trade receivables (USD) — 1.05B 1.45B 1.33B 1.5B 1.47B 1.51B 1.45B 1.27B 1.38B
↳ YoY growth +37.4% -8.4% +13.2% -2.3% +3.0% -3.8% -12.5% +8.1%
↳ 5y CAGR +7.5% +0.1% -0.8% -1.7%
Borrowings, current (USD) 12M 867M 517M 1.11B 742M 6M 1.07B 70M 1.58B 534M
Borrowings, non-current (USD) 7.06B 14.4B 13.9B 12.8B 14.3B 12.8B 11.8B 13.8B 14.7B 15.2B
Lease liabilities (USD) — — 0.00 1.57B 1.61B 1.87B 2.12B 2.19B 2.12B 2.19B
Cash and deposits (USD) 2.54B 11.2B 1.58B 2.25B 4.91B 3.53B 2.58B 3.11B 4.35B 4.4B
Intangible assets (USD) 61M 52M 1.37B 1.04B 783M 578M 384M 305M 254M 208M
Right-of-use assets (USD) — — 0.00 1.51B 1.53B 1.66B 1.81B 1.82B 1.77B 1.86B
Net debt (borrowings + leases - cash) (USD) 4.53B 4.04B 12.8B 13.2B 11.7B 11.1B 12.4B 12.9B 14B 13.5B
Cash flow detail
Operating cash flow (USD) 2.81B 2.61B 3.83B 4.3B 4.31B 3.57B 2.9B 3.88B 4.39B 4.76B
Purchases of property, plant and equipment (USD) -920M -928M -1.25B -1.26B -1.42B -1.42B -1.44B -1.78B -1.77B -1.45B
Change in receivables (cash effect) (USD) -461M -677M 202M 122M -285M -10M -44M 54M 182M -108M
Change in inventories (cash effect) (USD) -15M 36M -37M -135M 18M -52M -205M -220M -358M 97M
Change in payables (cash effect) (USD) 198M 539M 381M 617M 719M 376M 572M 519M -513M 646M
Dividends paid (cash effect) (USD) -640M -689M -821M -880M -953M -983M -1.05B -1.12B -1.19B -1.29B
Share buybacks (cash effect) (USD) -1.55B -393M -1.26B -744M -490M -3.71B -1.5B -1.5B -2.51B -1.62B
Income taxes paid (cash effect) (USD) -691M -517M -270M -324M -312M -1.3B -1.5B -1.2B -880M —
Share-based compensation (USD) 93M 94M 86M 127M 90M 94M 99M 87M 101M 119M
Operating cash flow before change in receivables (USD) 3.27B 3.29B 3.63B 4.18B 4.59B 3.58B 2.95B 3.82B 4.21B 4.87B
Free cash flow (OCF - PPE - intangibles) (USD) 1.89B 1.69B 2.58B 3.03B 2.89B 2.15B 1.47B 2.1B 2.62B 3.31B
Income detail
Research and development expense (USD) 705M 639M 764M 953M 1.1B 1.1B 1.2B 1.2B 1.1B 1.1B
↳ 5y CAGR +5.4% +4.2% +8.5% +10.9% +9.1% +9.3% +13.4% +9.5% +2.9% 0%
Total comprehensive income (USD) 1.97B 2.84B 3.16B 2.2B 3.16B 6.99B 4.89B 2.08B 4.15B 4.21B
Comprehensive income to owners (USD) 1.97B 2.84B 3.16B 2.2B 3.16B 6.99B 4.89B 2.08B 4.15B 4.21B
Reported Jan 30, 2017 Apr 25, 2018 Apr 24, 2019 Jan 30, 2020 Jan 28, 2021 Jan 27, 2022 Jan 26, 2023 Jan 25, 2024 Jan 30, 2025 Jan 27, 2026

Sign up to see institutional holdings

Sign Up

Podcast Mentions

Sign up to see podcast mentions and sentiment

Sign Up

Expanded production of the FMU-139D/B electronic bomb fuze helps strengthen the munitions supply for U.S. Navy and allied forces

2 MIN READ

October 29, 2026

TAGS: Armaments, U.S. Navy

Share on LinkedIn

Share on Twitter

Share on Facebook

Share on Reddit

Share via Email

Print this page

Summary

The U.S. Navy has increased the value of its contract with Northrop Grumman to continue production of the FMU-139D/B electronic bomb fuze, ensuring a reliable supply of its critical capability for U.S. forces and allies.

Key Takeaways

  • Contract ceiling increase helps meet rising U.S. and allied demand for combat-proven munitions and supports efforts to rebuild and sustain ready stockpiles.
  • Investments in modern manufacturing technologies at Allegany Ballistics Laboratory in West Virginia are helping Northrop Grumman increase production while maintaining quality and accelerating delivery timelines.

Northrop Grumman Increases Production of Combat-Proven Electronic Bomb FuzeNorthrop Grumman’s team in Rocket Center, West Virginia, supports the production and testing of advanced electronic fuzes, including the FMU-139D/B. (Photo Credit: Northrop Grumman)

ROCKET CENTER, W.Va. – Oct. 29, 2026 – The U.S. Navy is increasing the maximum value of an existing contract with Northrop Grumman (NYSE: NOC) by approximately $97 million to support continued production of the FMU-139D/B electronic bomb fuze.

The FMU-139D/B is an electronic bomb fuze — a key safety and timing device controlling when and how a munition performs — known for its adaptability and deployed on numerous U.S. and allied aircraft and various munitions. By helping ensure munitions safely function as intended, it plays a critical role supporting U.S. and allied forces in maintaining ready, reliable stockpiles as demand for munitions grows.

Manufactured at the Naval Industrial Reserve Ordnance Plant at Allegany Ballistics Laboratory (ABL) in Rocket Center, West Virginia , this award extends production for Northrop Grumman’s reliable and operationally proven capability that plays a critical role in the U.S. military’s inventory of air-delivered weapons.

Earlier this year, Northrop Grumman delivered its 200,000th FMU-139 D/B fuze , demonstrating the company’s long-standing production effort and ability to manufacture the system at scale. Through investments in automation and advanced manufacturing technologies, ABL can now produce as many as 85,000 fuzes annually. These improvements have increased efficiency, expanded capacity and strengthened the ability to respond quickly during periods of increased demand.

Northrop Grumman delivers advanced fuzing and warhead technologies across an expansive portfolio designed to provide precise, reliable and mission-tailorable effects across evolving operational environments. As the only company bringing metals, electronics, composites and energetics capabilities together on a single campus, Northrop Grumman offers integrated fuze and warhead design and develops adaptable solutions optimized for performance, survivability, manufacturability and scalable production to support today’s most critical missions.

Media Contact

Brandon Hartman

540-222-1883

[email protected]

Downloads

download

PHOTONorthrop Grumman Increases Production of Combat-Pr...

Related

Enter your email address to receive email updates from Northrop Grumman

Name

Email *

Phone Number

Subscribe

Northrop Grumman Corporation Logo

© 2026 Northrop Grumman. The Northrop Grumman name and logos are registered trademarks of Northrop Grumman.

Randy Sinclair (Investors) Bull 5 Bear 0 Results

571-835-5513

[email protected]

Northrop Grumman Reports Third Quarter 2026 Financial Results

•Book to bill ratio of 1.5x; Net awards of $16 billion

•Backlog increases to $110 billion

•Sales increase 7 percent to $11.1 billion

•Operating margin rate of 11.4 percent, Segment operating margin rate1 of 12.1 percent

•Diluted earnings per share (EPS) of $7.89

•Company raises 2026 guidance for key financial metrics:

◦Segment operating income1 increased by $65 million at the midpoint

◦MTM-adjusted EPS1 increased by $0.70 at the midpoint

FALLS CHURCH, Va. – October 20, 2026 – Northrop Grumman Corporation (NYSE: NOC) reported third quarter 2026 sales increased 7 percent to $11.1 billion, as compared with $10.4 billion in the third quarter of 2025. Third quarter sales reflect continued strong demand for our global capabilities. Third quarter 2026 net earnings totaled $1.1 billion, or $7.89 per diluted share, as compared with $1.1 billion, or $7.67 per diluted share, in the third quarter of 2025.

“In a complex world with the growing need for solutions that scale and perform, our customers continue to turn to Northrop Grumman, and we are delivering with urgency and innovation.

NOC - 09.30.2026 - Earnings Release EX-99 Bull 0 Bear 0 Not a release

Prompts

Northrop Grumman Corporation (ticker NOC), listed in United States.

Company History

Date Change Detail
— Predecessor Predecessor Northrop Grumman Corp (CIK 72945) filed under its own registration; its figures are on its own company page, not shown here.

ETFs Holding Northrop Grumman Corporation

ETF Weight in ETF Shares Market value As of
IDEF 4.11% 203,184 $ 110.867M Nov 16, 2026
DRES 3.55% 2,399 $ 1.295M Aug 31, 2026
GCAD 3.48% 2,986 $ 1.521M Jun 30, 2026
EASY 3.39% 3,808 $ 2.066M Jul 31, 2026
FMKT 2.10% 378 $ 206.256K Nov 17, 2026
ACEP 1.83% 3,261 $ 1.8M Nov 18, 2026
LOTI 1.83% 1,582 $ 858.203K Jul 31, 2026
PVAL 1.63% 425,912 $ 229.865M Aug 31, 2026
LOGO 1.59% 931 $ 508K Nov 17, 2026
SPCT 1.56% 1,928 $ 1.046M Jul 31, 2026
TCAL 1.39% 8,436 $ 4.603M Nov 17, 2026
THRO 1.20% 228,252 $ 124.546M Nov 16, 2026
TCAF 1.07% 212,073 $ 115.718M Nov 17, 2026
ARMY 1.07% 145 $ 78.257K Aug 31, 2026
ITAN 1.06% 2,367 $ 1.31M Nov 17, 2026
UPSD 0.85% 1,825 $ 990.026K Jul 31, 2026
GMOV 0.84% 1,670 $ 901.299K Aug 31, 2026
BAMD 0.81% 1,485 $ 801.455K Aug 31, 2026
CGDG 0.78% 85,671 $ 46.746M Nov 16, 2026
PY 0.72% 3,134 $ 1.596M Jun 30, 2026
BDVL 0.67% 21,895 $ 11.947M Nov 16, 2026
LCDS 0.65% 186 $ 102.906K Nov 17, 2026
DIVN 0.63% 3,561 $ 1.922M Aug 31, 2026
JOYT 0.62% 1,339 $ 740.815K Nov 17, 2026
GEW 0.58% 1,555 $ 839.234K Aug 31, 2026
WCEO 0.57% 105 $ 56.96K Jul 31, 2026
DFLV 0.55% 77,509 $ 42.563M Nov 12, 2026
NDOW 0.52% 707 $ 360.082K Jun 30, 2026
CGGE 0.50% 30,002 $ 16.371M Nov 16, 2026
CLSE 0.49% 8,123 $ 4.384M Aug 31, 2026
NANC 0.46% 2,261 $ 1.234M Nov 17, 2026
LVDS 0.44% 960 $ 531.13K Nov 17, 2026
PSTR 0.40% 500 $ 269.85K Aug 31, 2026
DFUV 0.36% 103,957 $ 57.086M Nov 12, 2026
BTAL 0.36% 2,024 $ 1.031M Jun 30, 2026
BALI 0.36% 10,164 $ 5.546M Nov 16, 2026
BAMG 0.35% 818 $ 441.475K Aug 31, 2026
FLCV 0.34% 866 $ 467.38K Aug 31, 2026
GSPY 0.29% 3,621 $ 1.976M Nov 17, 2026
TVAL 0.28% 5,809 $ 3.17M Nov 17, 2026
RGLO 0.26% 1,719 $ 875.504K Jun 30, 2026
FELV 0.25% 15,896 $ 8.096M Jun 30, 2026
IALT 0.25% 36,936 $ 20.154M Nov 16, 2026
DFVX 0.24% 2,475 $ 1.359M Nov 12, 2026
STOX 0.23% 962 $ 519.191K Aug 31, 2026
TACU 0.23% 77 $ 42.015K Nov 17, 2026
DFSU 0.22% 9,419 $ 5.172M Nov 12, 2026
SFTY 0.19% 2,822 $ 1.523M Aug 31, 2026
FTLS short -0.19% -8,857 $ 0.00 Nov 16, 2026
MPLY 0.18% 54 $ 29.294K Jul 31, 2026
XMAG 0.18% 699 $ 383.842K Nov 13, 2026
ACVF 0.16% 455 $ 246.828K Jul 31, 2026
ACIO 0.16% 6,831 $ 3.706M Jul 31, 2026
FELC 0.16% 24,271 $ 12.361M Jun 30, 2026
ADME 0.16% 845 $ 458.396K Jul 31, 2026
FYEE 0.15% 619 $ 335.795K Jul 31, 2026
DXUV 0.14% 16,138 $ 8.862M Nov 12, 2026
DFAU 0.14% 32,992 $ 18.117M Nov 12, 2026
GVLU 0.12% 588 $ 320.842K Nov 17, 2026
APUE 0.12% 5,380 $ 2.904M Aug 31, 2026
VOXP 0.11% 12 $ 6,509.76 Jul 31, 2026
VSLU 0.11% 1,181 $ 601.495K Jun 30, 2026
DYNF 0.11% 80,696 $ 44.032M Nov 16, 2026
DCOR 0.11% 89,807 $ 49.316M Nov 12, 2026
DFUS 0.11% 41,834 $ 22.972M Nov 12, 2026
GDE 0.10% 900 $ 485.73K Aug 31, 2026
ENHU 0.10% 17 $ 9,276.05 Nov 16, 2026
NTSX 0.10% 2,610 $ 1.329M Jun 30, 2026
DFAC 0.10% 155,055 $ 85.145M Nov 12, 2026
FHEQ 0.09% 1,612 $ 874.478K Jul 31, 2026
SFGV 0.09% 1,831 $ 1.01M Nov 18, 2026
HCMT 0.09% 928 $ 503.421K Jul 31, 2026
NTSD 0.09% 60 $ 30.559K Jun 30, 2026
YOKE 0.08% 329 $ 180K Nov 18, 2026
LGDX 0.07% 164 $ 89.487K Nov 17, 2026
MSLC 0.07% 5,237 $ 2.826M Aug 31, 2026
THEQ 0.07% 44 $ 24.009K Nov 17, 2026
EBI 0.06% 830 $ 447.951K Aug 31, 2026
VFMV 0.05% 417 $ 225.055K Aug 31, 2026
AVUS 0.04% 11,583 $ 6.32M Nov 16, 2026
CSHP 0.04% 277 $ 151.145K Nov 16, 2026
AVLC 0.04% 1,218 $ 664.602K Nov 16, 2026
AAUS 0.04% 400 $ 220K Nov 18, 2026
FLCC 0.03% 70 $ 37.779K Aug 31, 2026
VFVA 0.03% 490 $ 264.453K Aug 31, 2026
FELG 0.01% 1,424 $ 725.257K Jun 30, 2026
CORO 0.00% 84 $ 45.96K Nov 16, 2026