November 4, 2026
MAYFIELD HEIGHTS, Ohio--(BUSINESS WIRE)-- Materion Corporation (NYSE: MTRN) today reported record third-quarter 2026 financial results and raised its full-year outlook.
Financial Summary
- Net sales were $567.3 million versus $444.8 million in the prior year period; value-added sales 1 were $313.7 million versus $263.9 million in the prior year period
- Net income of $38.3 million, or $1.81 per share, diluted, versus $25.4 million, or $1.22 per share, in the prior year period; adjusted earnings of $1.93 per share versus $1.41 in the prior year period
- Operating profit of $50.4 million versus $34.9 million in the prior year period; adjusted EBITDA 2 of $70.7 million, or 22.5% of value-added sales, versus $55.5 million, or 21.0%, in the prior year period
- Strong free cash flow 3 generation of ~$46 million, with 120% conversion
- Raising full-year adjusted earnings per share outlook to $7.10 – $7.40, an increase of 33% year-over-year at the midpoint
Business Highlights
- Delivered:
- Record quarterly value-added sales and earnings
- Highest quarterly semiconductor sales in company history
- Double-digit year-over-year sales and earnings growth in each segment
- Fourth consecutive quarter of year-over-year adjusted EBITDA margin expansion
- Incoming orders and backlog reached all-time high, up ~25% and ~35% year-over-year respectively
- Making significant progress towards mid-term adjusted EBITDA margin target of 23%
“Our third quarter results demonstrate the power of our advanced materials portfolio and the strong momentum building across the company. The team’s commitment to delivering for our customers across diverse end markets drove double-digit growth in each business segment and resulted in another quarter of record sales and earnings,” said Jugal Vijayvargiya, President & CEO of Materion.
“As we enter the fourth quarter, the outlook is very strong. We expect a meaningful step up in sales supported by record backlog and robust demand across our end markets. Combined with continued strong execution across the business, we are well-positioned to deliver our strongest quarter yet, closing out an exciting record year for Materion."
THIRD QUARTER 2026 RESULTS
Net sales for the quarter were $567.3 million, compared to $444.8 million in the prior year period. Value-added sales were $313.7 million for the quarter, up 19% from the prior year period, driven by record quarterly semiconductor sales and significant growth across aerospace & defense and telecom & data center end markets.
Operating profit for the quarter was $50.4 million and net income was $38.3 million, or $1.81 per diluted share, compared to operating profit of $34.9 million and net income of $25.4 million, or $1.22 per share, in the prior year period.
Excluding special items4, adjusted EBITDA was a third quarter record at $70.7 million, or 22.5% of value-added sales, compared to $55.5 million or 21.0% of value-added sales in the prior year period. The strong adjusted EBITDA and margin were driven by higher volume and strong price/mix.
Adjusted net income was $40.8 million excluding acquisition amortization, or $1.93 per diluted share, compared to $1.41 per share in the prior year period.
OUTLOOK
Our strong year-to-date performance, record backlog and continued order rate momentum have further reinforced our confidence in delivering record results for 2026. We are raising our full-year adjusted earnings per share guidance to $7.10 to $7.40, representing a 33% increase over the prior year at the midpoint.
ADJUSTED EARNINGS GUIDANCE
It is not possible for the Company to identify the amount or significance of future adjustments associated with potential insurance and litigation claims, legacy environmental costs, acquisition and integration costs, certain income tax items, or other non-routine costs that the Company adjusts in the presentation of adjusted earnings guidance. These items are dependent on future events that are not reasonably estimable at this time. Accordingly, the Company is unable to reconcile without unreasonable effort the forecasted range of adjusted earnings guidance for the full year to a comparable GAAP range. However, items excluded from the Company's adjusted earnings guidance include the historical adjustments noted in Attachments 4 through 9 to this press release.
CONFERENCE CALL
Materion Corporation will host an investor conference call with analysts at 9:00 a.m. Eastern Time, November 4, 2026. The conference call will be available via webcast through the Company’s website at www.materion.com . By phone, please dial (888) 506-0062. Calls outside the U.S. can dial (973) 528-0011; please reference participant access code of 777356. A replay of the call will be available until November 18, 2026 by dialing (877) 481-4010 or (919) 882-2331 if international; please reference replay ID number 53276. The call will also be archived on the Company’s website.
FOOTNOTES
1 Value-added sales deducts the impact of pass-through metals from net sales
2 EBITDA represents earnings before interest, taxes, depreciation, depletion and amortization
3 See reconciliation of operating cash flow to free cash flow in Attachment 9
4 Details of the special items can be found in Attachments 4 through 8
ABOUT MATERION
Materion Corporation is a global leader in advanced materials solutions for high-performance industries including semiconductor, industrial, aerospace & defense, energy and automotive. With nearly 100 years of expertise in specialty engineered alloy systems, inorganic chemicals and powders, precious and non-precious metals, beryllium and beryllium composites, and precision filters and optical coatings, Materion partners with customers to enable breakthrough solutions that move the world forward. Headquartered in Mayfield Heights, Ohio, the Company employs more than 3,000 talented people worldwide, serving customers in more than 60 countries.
FORWARD-LOOKING STATEMENTS
Portions of the narrative set forth in this document that are not statements of historical or current facts are forward-looking statements. Our actual future performance may materially differ from that contemplated by the forward-looking statements as a result of a variety of factors. These factors include, in addition to those mentioned elsewhere herein: the global economy, including inflationary pressures, potential future recessionary conditions and the impact of tariffs and trade agreements; the impact of any U.S. Federal Government shutdowns or sequestrations; the condition of the markets which we serve, whether defined geographically or by segment; changes in product mix and the financial condition of customers; our success in developing and introducing new products and new product ramp-up rates; our success in passing through the costs of raw materials to customers or otherwise mitigating fluctuating prices for those materials, including the impact of fluctuating prices on inventory values; our success in identifying acquisition candidates and in acquiring and integrating such businesses; the impact of the results of acquisitions on our ability to fully achieve the strategic and financial objectives related to these acquisitions; our success in implementing our strategic plans and the timely and successful start-up and completion of any capital projects; other financial and economic factors, including the cost and availability of raw materials (both base and precious metals), physical inventory valuations, metal consignment fees, tax rates, exchange rates, interest rates, pension costs and required cash contributions and other employee benefit costs, energy costs, regulatory compliance costs, the cost and availability of insurance, credit availability, and the impact of the Company’s stock price on the cost of incentive compensation plans; the uncertainties related to the impact of war, terrorist activities, and acts of God; changes in government regulatory requirements and the enactment of new legislation that impacts our obligations and operations; the conclusion of pending litigation matters in accordance with our expectation that there will be no material adverse effects; the disruptions in operations from, and other effects of, catastrophic and other extraordinary events including outbreaks from infectious diseases and other extraordinary events including geopolitical conflicts such as the conflict between Russia and Ukraine and the conflict between the United States and Iran; realization of expected financial benefits expected from the Inflation Reduction Act of 2022; and the risk factors set forth in Part 1, Item 1A of the Company's 2025 Annual Report on Form 10-K and in other reports that we file with the SEC.
| Attachment 1Materion Corporation and SubsidiariesConsolidated Statements of Income(Unaudited) | |||||||||||||||
| Third Quarter Ended | Nine Months Ended | ||||||||||||||
| (In thousands except per share amounts) | October 2, 2026 | September 26, 2025 | October 2, 2026 | September 26, 2025 | |||||||||||
| Net sales | $ | 567,290 | $ | 444,808 | $ | 1,731,021 | $ | 1,296,796 | |||||||
| Cost of sales | 463,589 | 358,685 | 1,441,142 | 1,051,836 | |||||||||||
| Gross margin | 103,701 | 86,123 | 289,879 | 244,960 | |||||||||||
| Selling, general, and administrative expense | 42,525 | 38,256 | 121,047 | 108,740 | |||||||||||
| Research and development expense | 6,505 | 6,548 | 19,224 | 19,466 | |||||||||||
| Restructuring expense | 92 | 212 | 2,711 | 2,729 | |||||||||||
| Other — net | 4,172 | 6,164 | 16,605 | 15,068 | |||||||||||
| Operating profit | 50,407 | 34,943 | 130,292 | 98,957 | |||||||||||
| Other non-operating (income)—net | (370 | ) | (711 | ) | (997 | ) | (1,944 | ) | |||||||
| Interest expense — net | 6,605 | 7,544 | 21,709 | 22,691 | |||||||||||
| Income before income taxes | 44,172 | 28,110 | 109,580 | 78,210 | |||||||||||
| Income tax expense | 5,840 | 2,698 | 13,116 | 9,960 | |||||||||||
| Net income | $ | 38,332 | $ | 25,412 | $ | 96,464 | $ | 68,250 | |||||||
| Basic earnings per share: | |||||||||||||||
| Net income per share of common stock | $ | 1.84 | $ | 1.23 | $ | 4.64 | $ | 3.29 | |||||||
| Diluted earnings per share: | |||||||||||||||
| Net income per share of common stock | $ | 1.81 | $ | 1.22 | $ | 4.57 | $ | 3.27 | |||||||
| Weighted-average number of shares of common stock outstanding: | |||||||||||||||
| Basic | 20,848 | 20,731 | 20,810 | 20,763 | |||||||||||
| Diluted | 21,163 | 20,883 | 21,116 | 20,893 |
| Attachment 2Materion Corporation and SubsidiariesConsolidated Balance Sheets(Unaudited) | ||||||||
| (Thousands) | October 2, 2026 | December 31, 2025 | ||||||
| Assets | ||||||||
| Current assets | ||||||||
| Cash and cash equivalents | $ | 15,404 | $ | 13,681 | ||||
| Accounts receivable, net | 268,815 | 222,916 | ||||||
| Inventories, net | 485,943 | 461,231 | ||||||
| Prepaid and other current assets | 88,911 | 91,692 | ||||||
| Total current assets | 859,073 | 789,520 | ||||||
| Deferred income taxes | 9,640 | 7,727 | ||||||
| Property, plant, and equipment | 1,411,039 | 1,376,703 | ||||||
| Less allowances for depreciation, depletion, and amortization | (870,251 | ) | (841,245 | ) | ||||
| Property, plant, and equipment, net | 540,788 | 535,458 | ||||||
| Operating lease, right-of-use assets | 62,286 | 62,036 | ||||||
| Intangible assets, net | 96,887 | 105,874 | ||||||
| Other assets | 24,900 | 21,529 | ||||||
| Goodwill | 279,824 | 280,657 | ||||||
| Total Assets | $ | 1,873,398 | $ | 1,802,801 | ||||
| Liabilities and Shareholders’ Equity | ||||||||
| Current liabilities | ||||||||
| Short-term debt | $ | 19,609 | $ | 22,445 | ||||
| Accounts payable | 189,139 | 148,642 | ||||||
| Salaries and wages | 30,701 | 19,312 | ||||||
| Other liabilities and accrued items | 53,914 | 45,445 | ||||||
| Income taxes | 809 | 5,054 | ||||||
| Unearned revenue | 11,967 | 12,685 | ||||||
| Total current liabilities | 306,139 | 253,583 | ||||||
| Other long-term liabilities | 13,240 | 12,556 | ||||||
| Operating lease liabilities | 61,882 | 60,568 | ||||||
| Finance lease liabilities | 12,308 | 13,384 | ||||||
| Retirement and post-employment benefits | 22,609 | 23,931 | ||||||
| Unearned income | 47,766 | 55,862 | ||||||
| Long-term income taxes | 544 | 532 | ||||||
| Deferred income taxes | 2,150 | 2,760 | ||||||
| Long-term debt | 377,440 | 436,348 | ||||||
| Shareholders’ equity | 1,029,320 | 943,277 | ||||||
| Total Liabilities and Shareholders’ Equity | $ | 1,873,398 | $ | 1,802,801 |
| Attachment 3Materion Corporation and SubsidiariesConsolidated Statements of Cash Flows(Unaudited) | ||||||||
| Nine Months Ended | ||||||||
| (Thousands) | October 2, 2026 | September 26, 2025 | ||||||
| Cash flows from operating activities: | ||||||||
| Net income | $ | 96,464 | $ | 68,250 | ||||
| Adjustments to reconcile net income to net cash provided by operating activities: | ||||||||
| Depreciation, depletion, and amortization | 57,333 | 51,551 | ||||||
| Amortization of deferred financing costs in interest expense | 717 | 1,647 | ||||||
| Stock-based compensation expense (non-cash) | 12,506 | 8,520 | ||||||
| Deferred income tax expense (benefit) | (2,180 | ) | (43 | ) | ||||
| Changes in assets and liabilities: | ||||||||
| Accounts receivable | (46,747 | ) | 1,701 | |||||
| Inventory | (24,202 | ) | (21,980 | ) | ||||
| Prepaid and other current assets | 410 | (21,089 | ) | |||||
| Accounts payable and accrued expenses | 56,469 | 21,532 | ||||||
| Unearned revenue | (5,788 | ) | (13,142 | ) | ||||
| Interest and taxes payable | (2,387 | ) | (1,550 | ) | ||||
| Other-net | 98 | (11,673 | ) | |||||
| Net cash provided by operating activities | 142,693 | 83,724 | ||||||
| Cash flows from investing activities: | ||||||||
| Payments for purchase of property, plant, and equipment | (44,291 | ) | (38,741 | ) | ||||
| Payments for mine development | (13,591 | ) | (19,952 | ) | ||||
| Proceeds from sale of property, plant, and equipment | — | 932 | ||||||
| Payments for acquisition, net of cash acquired | — | (19,500 | ) | |||||
| Net cash used in investing activities | (57,882 | ) | (77,261 | ) | ||||
| Cash flows from financing activities: | ||||||||
| Proceeds from (repayments of) borrowings under credit facilities, net | (57,429 | ) | 30,574 | |||||
| Repayment of debt | (4,495 | ) | (16,609 | ) | ||||
| Principal payments under finance lease obligations | (456 | ) | (456 | ) | ||||
| Cash dividends paid | (8,950 | ) | (8,608 | ) | ||||
| Deferred financing costs | — | (2,935 | ) | |||||
| Repurchase of common stock | — | (7,843 | ) | |||||
| Payments of withholding taxes for stock-based compensation awards | (11,540 | ) | (2,540 | ) | ||||
| Net cash used in financing activities | (82,870 | ) | (8,417 | ) | ||||
| Effects of exchange rate changes | (218 | ) | 1,652 | |||||
| Net change in cash and cash equivalents | 1,723 | (302 | ) | |||||
| Cash and cash equivalents at beginning of period | 13,681 | 16,713 | ||||||
| Cash and cash equivalents at end of period | $ | 15,404 | $ | 16,411 |
| Attachment 4Materion Corporation and SubsidiariesReconciliation of Non-GAAP Measure - Value-added Sales, Operating Profit, and EBITDA(Unaudited) | |||||||||||
| Third Quarter Ended | Nine Months Ended | ||||||||||
| (Millions) | October 2, 2026 | September 26, 2025 | October 2, 2026 | September 26, 2025 | |||||||
| Net Sales | |||||||||||
| Performance Materials | $ | 199.0 | $ | 170.8 | $ | 562.6 | $ | 527.6 | |||
| Electronic Materials | 336.6 | 246.8 | 1,075.1 | 696.0 | |||||||
| Precision Optics | 31.7 | 27.2 | 93.3 | 73.2 | |||||||
| Other | — | — | — | — | |||||||
| Total | $ | 567.3 | $ | 444.8 | $ | 1,731.0 | $ | 1,296.8 | |||
| Less: Pass-through Metal Cost | |||||||||||
| Performance Materials | $ | 20.3 | $ | 13.7 | $ | 54.5 | $ | 41.9 | |||
| Electronic Materials | 233.2 | 167.1 | 792.6 | 462.4 | |||||||
| Precision Optics | 0.1 | 0.1 | 0.3 | 0.2 | |||||||
| Other | — | — | — | — | |||||||
| Total | $ | 253.6 | $ | 180.9 | $ | 847.4 | $ | 504.5 | |||
| Value-added Sales (non-GAAP) | |||||||||||
| Performance Materials | $ | 178.7 | $ | 157.1 | $ | 508.1 | $ | 485.7 | |||
| Electronic Materials | 103.4 | 79.7 | 282.5 | 233.6 | |||||||
| Precision Optics | 31.6 | 27.1 | 93.0 | 73.0 | |||||||
| Other | — | — | — | — | |||||||
| Total | $ | 313.7 | $ | 263.9 | $ | 883.6 | $ | 792.3 | |||
| Gross Margin | |||||||||||
| Performance Materials(1) | $ | 47.5 | $ | 44.7 | $ | 130.1 | $ | 141.9 | |||
| Electronic Materials(1) | 45.6 | 33.1 | 126.1 | 84.1 | |||||||
| Precision Optics(1) | 10.6 | 8.3 | 33.7 | 19.0 | |||||||
| Other | — | — | — | — | |||||||
| Total(1) | $ | 103.7 | $ | 86.1 | $ | 289.9 | $ | 245.0 | |||
| (1) See reconciliation of gross margin to adjusted gross margin in Attachment 8 | |||||||||||
| Note: Quarterly information presented within this document and previously disclosed quarterly information may not equal the total computed for the year due to rounding |
| Third Quarter Ended | Nine Months Ended | ||||||||||||||
| (Millions) | October 2, 2026 | September 26, 2025 | October 2, 2026 | September 26, 2025 | |||||||||||
| Operating Profit/(Loss) | |||||||||||||||
| Performance Materials | $ | 30.4 | $ | 26.8 | $ | 79.9 | $ | 89.1 | |||||||
| Electronic Materials | 28.4 | 16.3 | 72.4 | 36.4 | |||||||||||
| Precision Optics | 3.0 | 0.7 | 9.4 | (4.0 | ) | ||||||||||
| Other | (11.4 | ) | (8.9 | ) | (31.4 | ) | (22.5 | ) | |||||||
| Total | $ | 50.4 | $ | 34.9 | $ | 130.3 | $ | 99.0 | |||||||
| Non-Operating (Income)/Expense | |||||||||||||||
| Performance Materials | $ | 0.2 | $ | 0.2 | $ | 0.4 | $ | 0.3 | |||||||
| Electronic Materials | — | (0.2 | ) | (0.1 | ) | (0.2 | ) | ||||||||
| Precision Optics | (0.3 | ) | (0.2 | ) | (0.6 | ) | (0.6 | ) | |||||||
| Other | (0.3 | ) | (0.6 | ) | (0.7 | ) | (1.4 | ) | |||||||
| Total | $ | (0.4 | ) | $ | (0.8 | ) | $ | (1.0 | ) | $ | (1.9 | ) | |||
| Depreciation, Depletion, and Amortization | |||||||||||||||
| Performance Materials | $ | 12.3 | $ | 10.3 | $ | 35.1 | $ | 29.9 | |||||||
| Electronic Materials | 4.7 | 4.4 | 14.0 | 13.0 | |||||||||||
| Precision Optics | 2.2 | 2.3 | 6.7 | 7.2 | |||||||||||
| Other | 0.5 | 0.5 | 1.5 | 1.5 | |||||||||||
| Total | $ | 19.7 | $ | 17.5 | $ | 57.3 | $ | 51.6 | |||||||
| Segment EBITDA | |||||||||||||||
| Performance Materials | $ | 42.5 | $ | 36.9 | $ | 114.6 | $ | 118.7 | |||||||
| Electronic Materials | 33.1 | 20.9 | 86.5 | 49.6 | |||||||||||
| Precision Optics | 5.5 | 3.2 | 16.7 | 3.8 | |||||||||||
| Other | (10.6 | ) | (7.8 | ) | (29.2 | ) | (19.6 | ) | |||||||
| Total | $ | 70.5 | $ | 53.2 | $ | 188.6 | $ | 152.5 | |||||||
| Special Items(2) | |||||||||||||||
| Performance Materials | $ | 0.1 | $ | 1.1 | $ | 4.3 | 1.7 | ||||||||
| Electronic Materials | 0.1 | 0.7 | 0.6 | 3.1 | |||||||||||
| Precision Optics | — | — | 0.9 | 1.5 | |||||||||||
| Other | — | 0.5 | 1.1 | 1.2 | |||||||||||
| Total | $ | 0.2 | $ | 2.3 | $ | 6.9 | $ | 7.5 | |||||||
| Adjusted EBITDA Excluding Special Items | |||||||||||||||
| Performance Materials | $ | 42.6 | $ | 38.0 | $ | 118.9 | $ | 120.4 | |||||||
| Electronic Materials | 33.2 | 21.6 | 87.1 | 52.7 | |||||||||||
| Precision Optics | 5.5 | 3.2 | 17.6 | 5.3 | |||||||||||
| Other | (10.6 | ) | (7.3 | ) | (28.1 | ) | (18.4 | ) | |||||||
| Total | $ | 70.7 | $ | 55.5 | $ | 195.5 | $ | 160.0 | |||||||
| The cost of gold, silver, platinum, palladium, copper, ruthenium, iridium, rhodium, rhenium, and osmium is passed through to customers and, therefore, the trends and comparisons of net sales are affected by movements in the market price of these metals. Internally, management also reviews net sales on a value-added basis. Value-added sales is a non-GAAP financial measure that deducts the value of the pass-through metals sold from net sales. Value-added sales allows management to assess the impact of differences in net sales between periods or segments and analyze the resulting margins and profitability without the distortion of the movements in pass-through market metal prices. The dollar amount of gross margin and operating profit is not affected by the value-added sales calculation. The Company sells other metals and materials that are not considered direct pass throughs, and these costs are not deducted from net sales to calculate value-added sales. | |||||||||||||||
| The Company’s pricing policy is to pass the cost of these metals on to customers in order to mitigate the impact of price volatility on the Company’s results from operations. Value-added information is being presented since changes in metal prices may not directly impact profitability. It is the Company’s intent to allow users of the financial statements to review sales with and without the impact of the pass-through metals. | |||||||||||||||
| (2) See additional details of special items in Attachment 5. |
| Attachment 5Materion Corporation and SubsidiariesReconciliation of Net Sales to Value-added Sales, Net Income to EBITDA and Adjusted EBITDA(Unaudited) | |||||||||||||||
| Third Quarter Ended | Nine Months Ended | ||||||||||||||
| (Millions) | October 2, 2026 | September 26, 2025 | October 2, 2026 | September 26, 2025 | |||||||||||
| Net sales | $ | 567.3 | $ | 444.8 | $ | 1,731.0 | $ | 1,296.8 | |||||||
| Pass-through metal cost | 253.6 | 180.9 | 847.4 | 504.5 | |||||||||||
| Value-added sales | $ | 313.7 | $ | 263.9 | $ | 883.6 | $ | 792.3 | |||||||
| Net income | $ | 38.3 | $ | 25.4 | $ | 96.5 | $ | 68.3 | |||||||
| Income tax expense | 5.9 | 2.7 | 13.1 | 9.9 | |||||||||||
| Interest expense - net | 6.6 | 7.6 | 21.7 | 22.7 | |||||||||||
| Depreciation, depletion and amortization | 19.7 | 17.5 | 57.3 | 51.6 | |||||||||||
| Consolidated EBITDA | $ | 70.5 | $ | 53.2 | $ | 188.6 | $ | 152.5 | |||||||
| Net Income as a % of Net sales | 6.8 | % | 5.7 | % | 5.6 | % | 5.3 | % | |||||||
| Net Income as a % of Value-added sales | 12.2 | % | 9.6 | % | 10.9 | % | 8.6 | % | |||||||
| EBITDA as a % of Net sales | 12.4 | % | 12.0 | % | 10.9 | % | 11.8 | % | |||||||
| EBITDA as a % of Value-added sales | 22.5 | % | 20.2 | % | 21.3 | % | 19.2 | % | |||||||
| Special items | |||||||||||||||
| Restructuring and cost reduction | $ | 0.2 | $ | 0.2 | $ | 2.8 | $ | 2.8 | |||||||
| Product quality issue | — | — | 3.5 | — | |||||||||||
| Business transformation costs | — | 0.5 | 0.4 | 0.8 | |||||||||||
| Merger, acquisition and divestiture related costs | — | 1.0 | — | 3.3 | |||||||||||
| Environmental Remediation | — | 0.6 | — | 0.6 | |||||||||||
| Other | — | — | 0.2 | — | |||||||||||
| Total special items | 0.2 | 2.3 | 6.9 | 7.5 | |||||||||||
| Adjusted EBITDA | $ | 70.7 | $ | 55.5 | $ | 195.5 | $ | 160.0 | |||||||
| Adjusted EBITDA as a % of Net sales | 12.5 | % | 12.5 | % | 11.3 | % | 12.3 | % | |||||||
| Adjusted EBITDA as a % of Value-added sales | 22.5 | % | 21.0 | % | 22.1 | % | 20.2 | % | |||||||
| In addition to presenting financial statements prepared in accordance with U.S. generally accepted accounting principles (GAAP), this earnings release contains financial measures, including gross margin, segment gross margin, operating profit, segment operating profit, earnings before interest, taxes, depreciation, depletion and amortization (EBITDA), segment EBITDA, net income, and earnings per share, on a non-GAAP basis. As detailed in the above reconciliation and Attachments 6-8, we have adjusted the results for certain special items, including the following: | |||||||||||||||
| 1. Restructuring and cost reduction – Costs include restructuring charges, costs associated with temporarily idled facilities as a result of decreased demand and costs associated with disposal of assets associated with obsolete products.2. Product quality issue - Represents costs incurred related to a previously identified quality issue in the fourth quarter of 2025 identified by a large precision clad strip customer which led to temporarily idling production facilities within the Performance Materials segment.3. Business transformation costs – Represents project management and implementation expenses related to the Company's automation and transformation initiatives.4. Merger, acquisition and divestiture related costs – Includes due diligence costs associated with potential merger, acquisition and divestitures as well as loss on asset disposals.5. Environmental remediation – Cost associated with non-recurring environmental remediation6. Other – Costs primarily consist of miscellaneous expenses that are not indicative of current performance and are therefore included within our EBITDA adjustments, but are not significant enough to warrant separate presentation. | |||||||||||||||
| Internally, management reviews the results of operations without the impact of these costs in order to assess the profitability from ongoing activities. We are providing this information because we believe it will assist investors in analyzing our financial results and, when viewed in conjunction with the GAAP results, provide a more comprehensive understanding of the factors and trends affecting our operations. |
| Attachment 6Materion Corporation and SubsidiariesReconciliation of Net Income to Adjusted Net Incomeand Diluted Earnings per Share to Adjusted Diluted Earnings per Share (Unaudited) | ||||||||||||||||||||||||||
| Third Quarter Ended | Nine Months Ended | |||||||||||||||||||||||||
| (Millions) | October 2, 2026 | Diluted EPS | September 26, 2025 | Diluted EPS | October 2, 2026 | Diluted EPS | September 26, 2025 | Diluted EPS | ||||||||||||||||||
| Net income and EPS | $ | 38.3 | $ | 1.81 | $ | 25.4 | $ | 1.22 | $ | 96.5 | $ | 4.57 | $ | 68.3 | $ | 3.27 | ||||||||||
| Special items | ||||||||||||||||||||||||||
| Restructuring and cost reduction | 0.2 | 0.2 | 2.8 | 2.8 | ||||||||||||||||||||||
| Product quality issue | — | — | 3.5 | — | ||||||||||||||||||||||
| Business transformation costs | — | 0.5 | 0.4 | 0.8 | ||||||||||||||||||||||
| Merger, acquisition and divestiture related costs | — | 1.0 | — | 3.3 | ||||||||||||||||||||||
| Environmental Remediation | — | 0.6 | — | — | — | 0.6 | ||||||||||||||||||||
| Other | — | — | 0.2 | — | ||||||||||||||||||||||
| Debt extinguishment costs(1) | — | — | — | 0.5 | ||||||||||||||||||||||
| Provision for income taxes(2) | 0.3 | (0.4 | ) | (1.8 | ) | (1.2 | ) | |||||||||||||||||||
| Total special items | 0.5 | 0.02 | 1.9 | 0.09 | 5.1 | 0.24 | 6.8 | 0.33 | ||||||||||||||||||
| Adjusted net income and adjusted EPS | $ | 38.8 | $ | 1.83 | $ | 27.3 | $ | 1.31 | $ | 101.6 | $ | 4.81 | $ | 75.1 | $ | 3.60 | ||||||||||
| Acquisition amortization (net of tax) | 2.0 | 0.10 | 2.1 | 0.10 | 6.0 | 0.29 | 6.5 | 0.31 | ||||||||||||||||||
| Adjusted net income and adjusted EPS excl. amortization | $ | 40.8 | $ | 1.93 | $ | 29.4 | $ | 1.41 | $ | 107.6 | $ | 5.10 | $ | 81.6 | $ | 3.91 | ||||||||||
| (1) Debt extinguishment costs - Represents debt extinguishment costs incurred in connection with the amendment of the Company's Credit Agreement in June 2025. | ||||||||||||||||||||||||||
| (2) Provision for income taxes includes the net tax impact on pre-tax adjustments (listed above), the impact of certain discrete tax items recorded during the respective periods as well as other adjustments to reflect the use of one overall effective tax rate on adjusted pre-tax income in interim periods. |
| Attachment 7Reconciliation of Segment Net sales to Segment Value-added sales and Segment EBITDA to Adjusted Segment EBITDA (Unaudited) | |||||||||||||||
| Performance Materials | Third Quarter Ended | Nine Months Ended | |||||||||||||
| (Millions) | October 2, 2026 | September 26, 2025 | October 2, 2026 | September 26, 2025 | |||||||||||
| Net sales | $ | 199.0 | $ | 170.8 | $ | 562.6 | $ | 527.6 | |||||||
| Pass-through metal cost | 20.3 | 13.7 | 54.5 | 41.9 | |||||||||||
| Value-added sales | $ | 178.7 | $ | 157.1 | $ | 508.1 | $ | 485.7 | |||||||
| EBITDA | $ | 42.5 | $ | 36.9 | $ | 114.6 | $ | 118.7 | |||||||
| Restructuring and cost reduction | 0.1 | — | 0.6 | 0.5 | |||||||||||
| Product quality issue | — | — | 3.5 | — | |||||||||||
| Environmental remediation | — | 0.6 | — | 0.6 | |||||||||||
| Business transformation costs | — | 0.5 | 0.2 | 0.6 | |||||||||||
| Adjusted EBITDA | $ | 42.6 | $ | 38.0 | $ | 118.9 | $ | 120.4 | |||||||
| EBITDA as a % of Net sales | 21.4 | % | 21.6 | % | 20.4 | % | 22.5 | % | |||||||
| EBITDA as a % of Value-added sales | 23.8 | % | 23.5 | % | 22.6 | % | 24.4 | % | |||||||
| Adjusted EBITDA as a % of Net sales | 21.4 | % | 22.2 | % | 21.1 | % | 22.8 | % | |||||||
| Adjusted EBITDA as a % of Value-added sales | 23.8 | % | 24.2 | % | 23.4 | % | 24.8 | % | |||||||
| Electronic Materials | |||||||||||||||
| Third Quarter Ended | Nine Months Ended | ||||||||||||||
| (Millions) | October 2, 2026 | September 26, 2025 | October 2, 2026 | September 26, 2025 | |||||||||||
| Net sales | $ | 336.6 | $ | 246.8 | $ | 1,075.1 | $ | 696.0 | |||||||
| Pass-through metal cost | 233.2 | 167.1 | 792.6 | 462.4 | |||||||||||
| Value-added sales | $ | 103.4 | $ | 79.7 | $ | 282.5 | $ | 233.6 | |||||||
| EBITDA | $ | 33.1 | $ | 20.9 | $ | 86.5 | $ | 49.6 | |||||||
| Restructuring and cost reduction | 0.1 | 0.2 | 0.5 | 0.8 | |||||||||||
| Merger, acquisition and divestiture related costs | — | 0.5 | — | 2.3 | |||||||||||
| Other | — | — | 0.1 | — | |||||||||||
| Adjusted EBITDA | $ | 33.2 | $ | 21.6 | $ | 87.1 | $ | 52.7 | |||||||
| EBITDA as a % of Net sales | 9.8 | % | 8.5 | % | 8.0 | % | 7.1 | % | |||||||
| EBITDA as a % of Value-added sales | 32.0 | % | 26.2 | % | 30.6 | % | 21.2 | % | |||||||
| Adjusted EBITDA as a % of Net sales | 9.9 | % | 8.8 | % | 8.1 | % | 7.6 | % | |||||||
| Adjusted EBITDA as a % of Value-added sales | 32.1 | % | 27.1 | % | 30.8 | % | 22.6 | % | |||||||
| Precision Optics | |||||||||||||||
| Third Quarter Ended | Nine Months Ended | ||||||||||||||
| (Millions) | October 2, 2026 | September 26, 2025 | October 2, 2026 | September 26, 2025 | |||||||||||
| Net sales | $ | 31.7 | $ | 27.2 | $ | 93.3 | $ | 73.2 | |||||||
| Pass-through metal cost | 0.1 | 0.1 | 0.3 | 0.2 | |||||||||||
| Value-added sales | $ | 31.6 | $ | 27.1 | $ | 93.0 | $ | 73.0 | |||||||
| EBITDA | $ | 5.5 | $ | 3.2 | $ | 16.7 | $ | 3.8 | |||||||
| Restructuring and cost reduction | — | — | 0.9 | 1.5 | |||||||||||
| Adjusted EBITDA | $ | 5.5 | $ | 3.2 | $ | 17.6 | $ | 5.3 | |||||||
| EBITDA as a % of Net sales | 17.4 | % | 11.8 | % | 17.9 | % | 5.2 | % | |||||||
| EBITDA as a % of Value-added sales | 17.4 | % | 11.8 | % | 18.0 | % | 5.2 | % | |||||||
| Adjusted EBITDA as a % of Net sales | 17.4 | % | 11.8 | % | 18.9 | % | 7.2 | % | |||||||
| Adjusted EBITDA as a % of Value-added sales | 17.4 | % | 11.8 | % | 18.9 | % | 7.3 | % | |||||||
| Other | |||||||||||||||
| Third Quarter Ended | Nine Months Ended | ||||||||||||||
| (Millions) | October 2, 2026 | September 26, 2025 | October 2, 2026 | September 26, 2025 | |||||||||||
| EBITDA | $ | (10.6 | ) | $ | (7.8 | ) | $ | (29.2 | ) | $ | (19.6 | ) | |||
| Restructuring and cost reduction | — | — | 0.8 | — | |||||||||||
| Business transformation costs | — | — | 0.2 | 0.2 | |||||||||||
| Merger, acquisition and divestiture related costs | — | 0.5 | — | 1.0 | |||||||||||
| Other | — | — | 0.1 | — | |||||||||||
| Adjusted EBITDA | $ | (10.6 | ) | $ | (7.3 | ) | $ | (28.1 | ) | $ | (18.4 | ) |
| Attachment 8Materion Corporation and SubsidiariesReconciliation of Non-GAAP Measure - Gross Margin to Adjusted Gross Margin(Unaudited) | |||||||||||
| Third Quarter Ended | Nine Months Ended | ||||||||||
| (Millions) | October 2, 2026 | September 26, 2025 | October 2, 2026 | September 26, 2025 | |||||||
| Gross Margin | |||||||||||
| Performance Materials | $ | 47.5 | $ | 44.7 | $ | 130.1 | $ | 141.9 | |||
| Electronic Materials | 45.6 | 33.1 | 126.1 | 84.1 | |||||||
| Precision Optics | 10.6 | 8.3 | 33.7 | 19.0 | |||||||
| Other | — | — | — | — | |||||||
| Total | $ | 103.7 | $ | 86.1 | $ | 289.9 | $ | 245.0 | |||
| Special Items(1) | |||||||||||
| Performance Materials | $ | — | $ | 0.6 | $ | 3.5 | $ | 0.6 | |||
| Electronic Materials | — | — | — | — | |||||||
| Precision Optics | — | — | — | — | |||||||
| Other | — | — | — | — | |||||||
| Total | $ | — | $ | 0.6 | $ | 3.5 | $ | 0.6 | |||
| Adjusted Gross Margin | |||||||||||
| Performance Materials | $ | 47.5 | $ | 45.3 | $ | 133.6 | $ | 142.5 | |||
| Electronic Materials | 45.6 | 33.1 | 126.1 | 84.1 | |||||||
| Precision Optics | 10.6 | 8.3 | 33.7 | 19.0 | |||||||
| Other | — | — | — | — | |||||||
| Total | $ | 103.7 | $ | 86.7 | $ | 293.4 | $ | 245.6 | |||
| (1) Special items impacting gross margin represent the product quality issue identified in the fourth quarter of 2025. |
| Attachment 9Materion Corporation and SubsidiariesReconciliation of Non-GAAP Measure - Operating Cash Flow to Free Cash Flow(Unaudited) | |||||||||||||||
| Third Quarter Ended | Nine Months Ended | ||||||||||||||
| (Millions) | October 2, 2026 | September 26, 2025 | October 2, 2026 | September 26, 2025 | |||||||||||
| Net Income | $ | 38.3 | $ | 25.4 | $ | 96.5 | $ | 68.3 | |||||||
| Net cash provided by operating activities | $ | 72.2 | $ | 18.3 | $ | 142.7 | $ | 83.7 | |||||||
| Payments for purchase of property, plant and equipment | (14.5 | ) | (13.7 | ) | (44.3 | ) | (38.7 | ) | |||||||
| Payments for mine development | (11.9 | ) | (9.8 | ) | (13.6 | ) | (20.0 | ) | |||||||
| Free cash flow (FCF) | $ | 45.8 | $ | (5.2 | ) | $ | 84.8 | $ | 25.0 | ||||||
| Free cash flow conversion as a % of Net Income | 120 | % | (20 | )% | 88 | % | 37 | % | |||||||
| Free cash flow (FCF) represents operating cash flow adjusted for capital expenditures and mine development costs. Management believes FCF is an important performance measure of the business. FCF is not a measure calculated in accordance with GAAP, and it should not be considered a substitute for operating cash flow or any other measure of financial performance presented in accordance with GAAP. |
Investor Contact:
Kyle Kelleher
(216) 383-4931
[email protected]
Media Contact:
Jason Saragian
(216) 383-6893
[email protected]
Source: Materion Corporation
Quick Links
Email Alerts
Personal Information
Email Address *Required Email Address is required. Email Address is invalid.
Investor Alert Options *
- News
- Quarterly Reports
- Annual Reports
- SEC Filings
- End of Day Stock Quote
- Events & Presentations
Investor Alert Options is required.
The captcha test has failed. Please try again. Submit

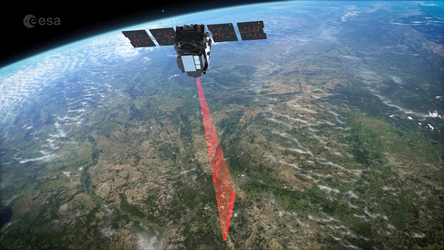 Fluorescence Explorer (FLEX)
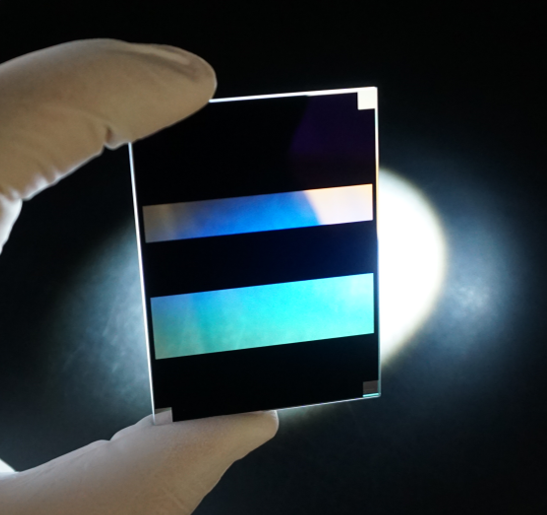 Linear Variable Filter developed for FLEX