Motorola Solutions, Inc. provides mission-critical safety and security technologies for public safety, government, defense, and enterprise customers. The company operates through two segments: Products and Systems Integration, and Software and Services. Its core technologies include Mission Critical Networks (MCN), which encompasses two-way radio infrastructure, devices, and mobile ad-hoc network (MANET) solutions; Video Security and Access Control, featuring AI-powered cameras, access control systems, and video management software; and Command Center, offering cloud-native and on-premises software that unifies voice and data for public safety workflows. Motorola Solutions serves government agencies, including defense, state and local public safety agencies, as well as enterprise customers such as schools, hospitals, businesses, and stadiums. The company was organized in 1928 as Motorola, Inc. and changed its name to Motorola Solutions, Inc. in 2011. Recent acquisitions include Silvus Technologies for MANET capabilities, Blue Eye for remote video monitoring, and Theatro for AI-powered communication software.

Summarised from the company's own disclosures, fiscal year ended Feb 2026

Industry Communication Equipment Homepage motorolasolutions.com
Sector Technology IR page motorolasolutions.com/investors.html
Tags
mission-critical communications, two-way radio, video security, access control, command center software, public safety, defense, enterprise security, ai analytics, mobile ad-hoc networks, Mission Critical Networks, Video Security and Access Control, Command Center, Silvus Technologies, Blue Eye, Theatro, RapidDeploy, 3tc Software, Noggin, Silent Sentinel, IPVideo, Avigilon, APX, APX NEXT, M500, SVX, Project 25, TETRA, DMR, D-Fend Solutions
Press page motorolasolutions.com/newsroom

Metrics

Valuation  
Market cap $ 88.568B
Market cap (USD) $ 88.568B
P/E 43.09
PEG 2.61
P/BV 28.86
P/S 7.03
P/OCF 31.21
P/FCF 34.95
Dividend yield 0.90%
Turnover / mcap —
Returns  
ROE 104.7%
ROI 19.9%
ROIC 21.2%
Profit margin 18.4%
Growth  
Revenue growing Yes
Profits growing Yes
Revenue up 3y Yes
Revenue up 5y Yes
Earnings growth 3y (net profit CAGR) 16.5%
Quality  
Profitable Yes
Margin expanding Yes
Buying back stock No
Diluting (TTM) No
Debt/Equity 305.0%
Podcast bulls (TTM) Sign up
Podcast bears (TTM) Sign up
Podcast sentiment (TTM) Sign up
Podcast sentiment % (TTM) Sign up
News sentiment (TTM) 74
Quality score 36.8%
Insiders  
Buys, 1w Sign up
Buys, 1m Sign up
Buys, 1y Sign up
Sells, 1w Sign up
Sells, 1m Sign up
Sells, 1y Sign up

Sign up to see this company's insider trades

Figure FY 2025 FY 2024 FY 2023 FY 2022 FY 2021 FY 2020 FY 2019 FY 2018 FY 2017 FY 2016 FY 2015 FY 2014 FY 2013 FY 2012 FY 2011 FY 2010 FY 2009 FY 2008 FY 2007 FY 2006 FY 2005 FY 2004 FY 2003 FY 2002
Revenue 11.682B 10.817B 9.978B 9.112B 8.171B 7.414B 7.887B 7.343B 6.38B 6.038B 5.695B 5.881B 8.696B 8.698B 8.203B 19.282B 22.044B 30.146B 36.622B 42.879B 36.843B 31.323B 27.058B 27.279B
Net profit 2.154B 1.577B 1.709B 1.363B 1.245B 949M 868M 966M -155M 560M 610M 1.299B 1.099B 881M 1.158B 633M -51M -4.244B -49M 3.661B 4.578B 1.532B 893M -2.485B
Free cash flow 2.572B 2.134B 1.791B 1.567B 1.594B 1.396B 1.575B 878M 1.119B 894M 830M -866M 753M 881M 662M 1.199B 354M -262M 258M 2.85B 4.022B 2.572B 2.116B 732M

Figure FY 2025 FY 2024 FY 2023 FY 2022 FY 2021 FY 2020 FY 2019 FY 2018 FY 2017 FY 2016 FY 2015 FY 2014 FY 2013 FY 2012 FY 2011 FY 2010 FY 2009 FY 2008 FY 2007 FY 2006 FY 2005 FY 2004 FY 2003 FY 2002
Share price 383.32 462.23 313.09 257.71 271.7 170.06 161.14 115.04 90.34 82.89 68.45 67.08 67.5 55.68 46.29 9.07 7.76 4.43 — — — — — —
Price performance 12m -0.17 0.48 0.21 -0.05 0.6 0.06 0.4 0.27 0.09 0.21 0.02 -0.01 0.21 0.2 4.1 0.17 0.75 — — — — — — —

Filed figures

Figure Dec 2016 Dec 2017 Dec 2018 Dec 2019 Dec 2020 Dec 2021 Dec 2022 Dec 2023 Dec 2024 Dec 2025
Balance sheet detail
Trade receivables (USD) 1.41B 1.52B 1.29B 1.41B 1.39B 1.39B 1.52B 1.71B 1.95B 2.2B
↳ YoY growth +3.5% +8.0% -15.1% +9.2% -1.6% -0.3% +9.5% +12.6% +14.2% +12.7%
↳ 5y CAGR -5.5% -4.1% -7.6% +0.0% +0.4% -0.3% -0.1% +5.7% +6.7% +9.6%
Borrowings, current (USD) 4M 52M 31M 16M 12M 5M 1M 1.31B 322M 749M
Borrowings, non-current (USD) 4.39B 4.42B 5.29B 5.11B 5.16B 5.69B 6.01B 4.71B 5.68B 8.41B
Lease liabilities (USD) — — — 648M 544M 441M 538M 532M 554M 604M
Cash and deposits (USD) 1.03B 1.21B 1.25B 1B 1.25B 1.87B 1.33B 1.71B 2.1B 1.17B
Intangible assets (USD) 821M 861M 1.23B 1.33B 1.23B 1.11B 1.34B 1.26B 1.25B 3.1B
Right-of-use assets (USD) — — — 554M 468M 382M 485M 495M 529M 581M
Net debt (borrowings + leases - cash) (USD) 3.37B 3.27B 4.07B 4.78B 4.47B 4.26B 5.23B 4.85B 4.45B 8.6B
Cash flow detail
Operating cash flow (USD) 1.17B 1.35B 1.08B 1.82B 1.61B 1.84B 1.82B 2.04B 2.39B 2.84B
Purchases of property, plant and equipment (USD) -271M -227M -197M -248M -217M -243M -256M -253M -257M -265M
Change in receivables (cash effect) (USD) -6M -60M — — — — — — — —
Change in inventories (cash effect) (USD) 6M -46M 71M -74M -14M -284M -242M 200M 62M -145M
Change in payables (cash effect) (USD) 241M 160M — — — — — — — —
Dividends paid (cash effect) (USD) -280M -307M -337M -379M -436M -482M -530M -589M -654M -728M
Share buybacks (cash effect) (USD) -842M -483M -132M -315M -612M -528M -836M -804M -244M -1.15B
Interest paid (cash effect) (USD) -191M -176M -204M -221M -217M -207M -226M -234M -253M -285M
Income taxes paid (cash effect) (USD) -66M -122M -119M -138M -181M -257M -307M -587M -627M -569M
Share-based compensation (USD) 68M 66M 73M 118M 129M 129M 172M 212M 243M 293M
Operating cash flow before change in receivables (USD) 1.17B 1.41B — — — — — — — —
Free cash flow (OCF - PPE - intangibles) (USD) 894M 1.12B 878M 1.58B 1.4B 1.59B 1.57B 1.79B 2.13B 2.57B
Income detail
Research and development expense (USD) 553M 568M 637M 687M 686M 734M 779M 858M 917M 970M
↳ 5y CAGR -11.8% -12.0% -9.6% +0.2% +2.0% +5.8% +6.5% +6.1% +5.9% +7.2%
Total comprehensive income (USD) 111M -396M 766M 1.2B 947M 1.32B 1.21B 1.71B 1.58B 2.28B
Comprehensive income to owners (USD) 109M -400M 763M 1.19B 943M 1.31B 1.21B 1.7B 1.58B 2.27B
Provision for credit losses (USD) — — — — 47M — — — — —
Credit cost ratio (credit losses / average receivables) (%) — — — — 3.4% — — — — —
Reported Feb 21, 2017 Feb 16, 2018 Feb 15, 2019 Feb 14, 2020 Feb 12, 2021 Feb 16, 2022 Feb 16, 2023 Feb 15, 2024 Feb 14, 2025 Feb 12, 2026

Sign up to see institutional holdings

Sign Up

Podcast Mentions

Sign up to see podcast mentions and sentiment

Sign Up

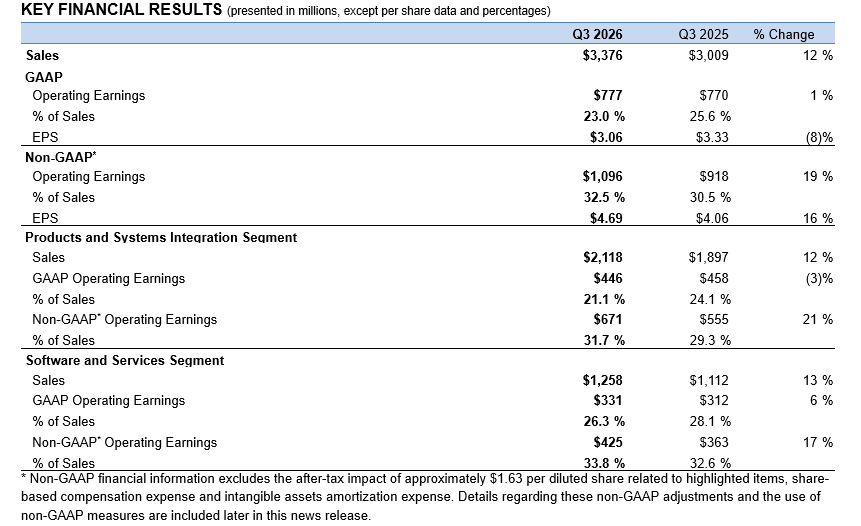
Motorola Solutions Reports Third-Quarter 2026 Financial Results Company raises full-year revenue and earnings outlook again and increases full-year cash flow expectations • Sales of $3.4 billion, up 12% versus a year ago ◦ Products and Systems Integration sales up 12% ◦ Software and Services sales up 13% • GAAP earnings per share ("EPS") of $3.06 • Non-GAAP EPS* of $4.69 • Record ending backlog of $16.6 billion, up 14% versus a year ago, driven by record Q3 orders • Acquired D-Fend Solutions ("D-Fend"), an industry leader in counter-drone technology • Announced $2 billion increase to the share repurchase authorization CHICAGO – November 4, 2026 – Motorola Solutions, Inc. (NYSE: MSI) today reported its earnings results for the third quarter of 2026. “Q3 was another outstanding quarter, with double-digit revenue growth across both segments and all three technologies,” said Greg Brown, chairman and CEO, Motorola Solutions. “We continue to see exceptionally strong demand across our safety and security solutions, driving record Q3 orders and an all-time record ending backlog. As a result, we’re raising our revenue and earnings outlook again and increasing our cash flow expectations for the full year.” KEY FINANCIAL RESULTS (presented in millions, except per share data and percentages) Sales GAAP Operating Earnings

Q3 2026

Q3 2025

$3,376

$3,009

12 % 1%

% Change

$777

$770

% of Sales

23.0 %

25.6 %

EPS

$3.06

$3.33

(8)% 19 %

Non-GAAP*

Operating Earnings

$1,096

$918

% of Sales

32.5 %

30.5 %

EPS

$4.69

$4.06

16 %

Products and Systems Integration Segment Sales

$2,118

$1,897

12 %

$446

$458

(3)%

21.1 %

24.1 %

$671

$555

% of Sales

31.7 %

29.3 %

Software and Services Segment Sales

$1,258

$1,112

13 %

$331

$312

6%

26.3 %

28.1 %

$425

$363

GAAP Operating Earnings % of Sales Non-GAAP* Operating Earnings

GAAP Operating Earnings % of Sales Non-GAAP* Operating Earnings

21 %

17 %

% of Sales 33.8 % 32.6 %

  • Non-GAAP financial information excludes the after-tax impact of approximately $1.63 per diluted share related to highlighted items, sharebased compensation expense and intangible assets amortization expense. Details regarding these non-GAAP adjustments and the use of non-GAAP measures are included later in this news release.

1

OTHER SELECTED FINANCIAL RESULTS •

Revenue - Sales were $3.4 billion, up 12% from the year-ago quarter driven by growth in North America and International. Revenue growth related to acquisitions was $211 million and foreign currency tailwinds were $11 million in the quarter. The Products and Systems Integration segment grew 12% driven by growth in Mission Critical Networks ("MCN") and Video Security and Access Control ("Video"). The Software and Services segment grew 13% driven by growth in MCN, Command Center and Video.

•

Operating margin - GAAP operating margin was 23.0% of sales, down from 25.6% in the year-ago quarter primarily driven by an increase to the contingent Silvus earnout in the current quarter due to strong performance of the business. Non-GAAP operating margin was 32.5% of sales, up 200 basis points from 30.5% in the year-ago quarter driven by higher sales and improved operating leverage, partially offset by higher supply chain costs.

•

Taxes - The GAAP effective tax rate during the quarter was 24.2%, versus 22.2% in the year-ago quarter and the non-GAAP effective tax rate was 21.8%, versus 20.7% in the year-ago quarter. The increases in the GAAP and non-GAAP effective tax rates were primarily driven by lower benefits from share-based compensation recognized in the current quarter.

•

Cash flow - Operating cash flow was $662 million, compared to $799 million in the year-ago quarter and free cash flow was $589 million, compared to $733 million in the year-ago quarter. Both the operating cash flow and free cash flow for the quarter decreased due to higher tax and interest payments during the quarter, primarily offset by higher earnings, net of non-cash charges.

•

Capital allocation - During the quarter, the company paid $200 million in cash dividends, repurchased $94 million of common stock at an average price of $457.07 and invested $73 million in capital expenditures. Additionally, the company announced a $2 billion increase to the share repurchase authorization during the quarter. The company also closed the acquisition of D-Fend during the quarter for $1.3 billion, net of cash acquired, which was primarily funded through $950 million of new long-term senior notes. The company also issued a new $300 million 364-day term loan and repaid $300 million of the 364-day term loan issued for the Silvus acquisition, upon its maturity during the quarter. In addition, the company acquired DeepNeuronic, a provider of AI software that turns live camera feeds into real-time operational insights, for $29 million, net of cash acquired.

•

Backlog - The company ended the quarter with record backlog of $16.6 billion, up 14% or $2.1 billion from the year-ago quarter driven by record Q3 orders in all three technologies. Products and Systems Integration segment backlog was up $635 million, or 18%, driven primarily by strong demand in MCN and Video. Software and Services segment backlog was up $1.4 billion, or 13%, driven by strong demand in all three technologies.

2

NOTABLE WINS AND ACHIEVEMENTS Products and Systems Integration •

$140 million P25 systems and device order with the Federal Bureau of Prisons

•

$98 million P25 device and SVX order for a U.S. federal customer

•

$63 million P25 system and device order for the Metro Government of Nashville and Davidson County

•

$56 million fixed video order for a large convenience store chain

•

$39 million Silvus order for a German unmanned systems provider

Software and Services •

$139 million ten-year P25 services, mobile video and Command Center order for the State of Louisiana

•

$78 million eight-year mobile video award for a U.S. federal customer

•

$59 million six-year P25 services order for a state and local customer

•

$51 million computer aided dispatch and records management order for the Los Angeles Police Dept

•

$27 million P25 services renewal for North Carolina State Highway Patrol

BUSINESS OUTLOOK •

Fourth quarter 2026 - The company expects revenue growth of approximately 13% compared to the fourth quarter of 2025 and non-GAAP EPS between $5.47 and $5.52 per share. This assumes approximately 168 million of fully diluted shares and a non-GAAP effective tax rate of approximately 22.5%.

•

Full-year 2026 - The company now expects revenue of approximately $13.050 billion, up from its prior guidance of $12.975 billion and non-GAAP EPS between $17.94 and $17.99 per share, up from its prior guidance of between $17.62 and $17.72 per share. This outlook assumes approximately 168 million of fully diluted shares and a non-GAAP effective tax rate between 21.5% and 22%. In addition, the company is increasing its operating cash flow expectations to $3.050 billion for the full year.

The company has not quantitatively reconciled its guidance for forward-looking non-GAAP measurements in this news release to their most comparable GAAP measurements because the company does not provide specific guidance for the various reconciling items as certain items that impact these measurements have not occurred, are out of the company’s control, or cannot be reasonably predicted. Accordingly, a reconciliation to the most comparable GAAP financial measurement is not available without unreasonable effort. Please note that the unavailable reconciling items could significantly impact the company’s results.

3

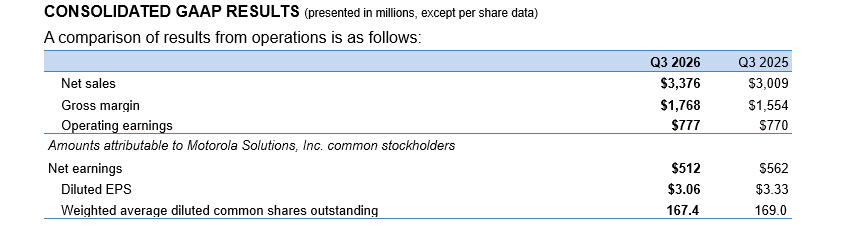
RECENT EVENTS MACROECONOMIC ENVIRONMENT UPDATE The global trade landscape continues to shift rapidly, including evolving tariffs and import/export regulations, such as restrictions around rare earth minerals, trade barriers and trade disputes. On February 20, 2026, a U.S. Supreme Court ruling invalidated tariffs imposed under the International Emergency Economic Powers Act (“IEEPA”). On April 20, 2026, the U.S. Customs and Border Protection launched a system to process IEEPA tariff refund claims. Following the implementation of this system, the company determined that the recovery of a portion of these refunds is now probable. Accordingly, during the nine months ended October 3, 2026, the company recognized a favorable adjustment of approximately $70 million recorded within Cost of sales in its Condensed Consolidated Statements of Operations. In addition, the company is experiencing higher costs for memory in its products which is a result of substantial demand in the market driven by AI. As a result, the company continues to observe elevated volatility and uncertainty around the global supply chain. The company engages with global suppliers across a diverse network of locations around the world. The company is actively managing its inventory and continues to work with its global supply base to mitigate its exposure to elevated volatility and uncertainty from these rising memory costs, as well as global tariffs and import/export regulations that have developed, and which may continue to develop, to ensure supply continues at levels necessary to meet its current customer demand. The company expects inventory levels to remain elevated as it mitigates this dynamic supply chain environment. The current environment has led to increased costs on materials and components, for which the company continues to develop mitigation actions going forward. CONFERENCE CALL AND WEBCAST Motorola Solutions will host its quarterly conference call beginning at 4 p.m. U.S. Central Time (5 p.m. U.S. Eastern Time) on Wednesday, November 4. The conference call will be webcast live at www.motorolasolutions.com/investors. An archive of the webcast will be available for a limited period of time thereafter. CONSOLIDATED GAAP RESULTS (presented in millions, except per share data) A comparison of results from operations is as follows: Q3 2026

Q3 2025

Net sales

$3,376

$3,009

Gross margin

$1,768

$1,554

$777

$770

$512

$562

Operating earnings Amounts attributable to Motorola Solutions, Inc. common stockholders Net earnings Diluted EPS

$3.06

$3.33

Weighted average diluted common shares outstanding

167.4

169.0

4

USE OF NON-GAAP FINANCIAL INFORMATION In addition to the results presented in accordance with accounting principles generally accepted in the U.S. ("GAAP") included in this news release, Motorola Solutions also has included non-GAAP measurements of results, including free cash flow, non-GAAP operating earnings, non-GAAP EPS, nonGAAP operating margin, non-GAAP net earnings attributable to MSI, non-GAAP tax rate, and organic revenue. The company has provided these non-GAAP measurements to help investors better understand its core operating performance, enhance comparisons of core operating performance from period-toperiod and allow better comparisons of its operating performance to that of its competitors. Among other things, management uses these operating results, excluding the identified items, to evaluate the performance of its businesses and to evaluate results relative to certain incentive compensation targets. Management uses operating results excluding these items because it believes these measurements enable it to make better period-to-period evaluations of the financial performance of its core business operations. The non-GAAP measurements are intended only as a supplement to the comparable GAAP measurements and the company compensates for the limitations inherent in the use of non-GAAP measurements by using GAAP measures in conjunction with the non-GAAP measurements. As a result, investors should consider these non-GAAP measurements in addition to, and not in substitution for or as superior to, GAAP measurements. Reconciliations: Details and reconciliations of such non-GAAP measurements to the corresponding GAAP measurements can be found at the end of this news release. Free cash flow: Free cash flow represents net cash provided by operating activities less capital expenditures. The company believes that free cash flow is useful to investors as the basis for comparing its performance and coverage ratios with other companies in the company's industries, although the company's measure of free cash flow may not be directly comparable to similar measures used by other companies. This measure is also used as a component of incentive compensation. Organic Revenue: Organic revenue reflects net sales calculated under GAAP excluding net sales from acquired business owned for less than four full quarters. The company believes organic revenue provides useful information for evaluating the periodic growth of the business on a consistent basis and provides for a meaningful period-to-period comparison and analysis of trends in the business. Non-GAAP operating earnings, non-GAAP EPS, non-GAAP operating margin and non-GAAP net earnings attributable to MSI each excludes highlighted items, including share-based compensation expenses and intangible assets amortization expense, as follows:

5

Highlighted items: The company has excluded the effects of highlighted items including, but not limited to, acquisition-related transaction fees, tangible and intangible asset impairments, reorganization of business charges, certain non-cash pension adjustments, legal settlements and other contingencies, gains and losses on investments and businesses, Hytera-related legal expenses, gains and losses on the extinguishment of debt, adjustments to contingent earnout, and the income tax effects of significant tax matters, from its non-GAAP operating expenses and net income measurements because the company believes that these historical items do not reflect expected future operating earnings or expenses and do not contribute to a meaningful evaluation of the company's current operating performance or comparisons to the company's past operating performance. For the purposes of management's internal analysis over operating performance, the company uses financial statements that exclude highlighted items, as these charges do not contribute to a meaningful evaluation of the company's current operating performance or comparisons to the company's past operating performance. Hytera-Related Legal Expenses: In 2017, the company filed a complaint against Hytera Communications Corporation Limited of Shenzhen, China; Hytera America, Inc.; and Hytera Communications America (West), Inc. (collectively, "Hytera"), in the U.S. District Court for the Northern District of Illinois (the "District Court"), alleging trade secret theft and copyright infringement, and seeking injunctive relief. In 2020, a jury decided in the company's favor, ultimately resulting in an award to the company of $543.7 million, plus $51.1 million in pre-judgment interest and $2.6 million in costs, as well as $34.2 million in attorneys' fees. In 2024, after both parties appealed to the U.S. Court of Appeals for the Seventh Circuit (the "Court of Appeals"), the Court of Appeals, among other items, affirmed the District Court's award of $407.4 million in damages under the Defend Trade Secrets Act, and directed the District Court to recalculate and reduce its award of $136.3 million in copyright infringement damages, which remains subject to ruling by the District Court. As of October 3, 2026, as a result of this civil litigation and 2020 bankruptcy proceedings by Hytera America, Inc. and Hytera Communications America (West), Inc., Hytera had paid $245 million against this award, $73 million of which was paid in the first nine months of 2026. These payments were recorded as a gain within Other charges within the Consolidated Statement of Operations. Further, in 2022, the District Court ordered Hytera to pay the company a forward-looking reasonable royalty on Hytera’s products (“I-Series”) that use the company’s stolen trade secrets, applicable to ISeries products sold from July 1, 2019 forward. In 2024, the company received royalties of $61 million related to the I-Series products, which was recorded as a gain within Other charges within the Consolidated Statement of Operations. Beginning in 2025, a favorable ruling in a related legal proceeding in the District Court (which Hytera has subsequently appealed to the Court of Appeals) also ordered Hytera to pay the company for Hytera’s continued use of the company’s trade secrets and copyrighted source code in Hytera’s currently shipping products (“H-Series”), and Hytera has subsequently reported to the company approximately $116 million in royalties subject to the Court's order. While several aspects of the court proceedings related to the H-Series are subject to appeal, the company continues to seek collection of the amounts owed by Hytera through the ongoing legal process.

6

Management typically considers legal expenses associated with defending the company's intellectual property as “normal and recurring.” Since 2020, the company has believed that Hytera-related legal expenses have not been part of its “normal and recurring” legal expenses incurred to operate its business and has accordingly excluded such expenses from its GAAP operating Income. In addition, as any contingent or actual gains associated with the Hytera litigation are recognized, they will be similarly excluded from the company's non-GAAP operating income, consistent with the company's treatment of the approximately $15 million realized in 2022, $61 million realized in 2024, $157 million realized in 2025, and $73 million realized in the first nine months of 2026. The company believes after the jury award, the presentation of excluding both Hytera-related legal expenses and gains related to awards better aligns with how management evaluates the company's ongoing underlying business performance. Share-based compensation expenses: The company has excluded share-based compensation expense from its non-GAAP operating expenses and net income measurements. Although share-based compensation is a key incentive offered to the company’s employees and the company believes such compensation contributed to the revenue earned during the periods presented and also believes it will contribute to the generation of future period revenues, the company continues to evaluate its performance excluding share-based compensation expense primarily because it represents a significant non-cash expense. Share-based compensation expense will recur in future periods. Intangible assets amortization expense: The company has excluded intangible assets amortization expense from its non-GAAP operating expenses and net earnings measurements primarily because it represents a non-cash expense and because the company evaluates its performance excluding intangible assets amortization expense. Amortization of intangible assets is consistent in amount and frequency but is significantly affected by the timing and size of the company’s acquisitions. Investors should note that the use of intangible assets contributed to the company’s revenues earned during the periods presented and will contribute to the company’s future period revenues as well. Intangible assets amortization expense will recur in future periods. FORWARD LOOKING STATEMENTS This news release contains "forward-looking statements" within the meaning of applicable federal securities law. These statements are made pursuant to the safe harbor provisions of the Private Securities Litigation Reform Act of 1995 and generally include words such as “believes,” “expects,” “intends,” “anticipates,” “estimates” and similar expressions. The company can give no assurance that any actual or future results or events discussed in these statements will be achieved. Any forward-looking statements represent the company’s views only as of today and should not be relied upon as representing the company’s views as of any subsequent date. Readers are cautioned that such forwardlooking statements are subject to a variety of risks and uncertainties that could cause the company’s actual results to differ materially from the statements contained in this release. Such forward-looking statements include, but are not limited to, Motorola Solutions’ financial outlook for the fourth quarter and full-year of 2026; and the impact of changes in the global trade environment, the dynamic supply chain environment and the memory market on Motorola Solutions' business, and Motorola Solutions' actions in response thereto (including with respect to inventory levels). Motorola Solutions cautions the reader that the risks and uncertainties below, as well as those in Part I Item 1A of Motorola Solutions’ 2025 Annual Report on Form 10-K and in its other SEC filings available for free on the SEC’s website at www.sec.gov and on Motorola Solutions’ website at www.motorolasolutions.com/investors, could cause Motorola Solutions’ actual results to differ materially from those estimated or predicted in the forward-looking statements. Many of these risks and uncertainties cannot be controlled by Motorola Solutions, and factors

7

that may impact forward-looking statements include, but are not limited to: (i) impact of current global economic and political conditions in the markets in which the company operates; (ii) increased areas of risk, increased competition and additional compliance obligations associated with the introduction of new or enhanced products and services in our segments; (iii) challenges relating to the use of artificial intelligence ("AI") in our products and services; (iv) impact of catastrophic events on our business or our customers' or suppliers' business; (v) the effectiveness of our strategic acquisitions, including the integrations of such acquired businesses; (vi) the inability of our products to meet our customers’ expectations or regulatory or industry standards, or actual or perceived systems or service failures of our products and services; (vii) our inability to purchase a sufficient amount of materials, parts, and components, as well as software and services, at acceptable prices to meet the demands of our customers, and any disruption to our suppliers or significant increase in the price of supplies; (viii) risks related to our large, multi-year system and services contracts; (ix) the global nature of our employees, customers, suppliers and outsource partners; (x) our use of third-parties to develop, design and/or manufacture many of our components and some of our products, and to perform portions of our business operations; (xi) the inability of our subcontractors to perform in a timely and compliant manner or adhere to our Human Rights Policy; (xii) inability to attract and retain senior management and key employees; (xiii) evolving and sometimes conflicting expectations from investors, customers, lawmakers, regulators and other stakeholders regarding social and sustainability considerations and disclosures; (xiv) challenges relating to existing or future legislation and regulations pertaining to AI, AI-enabled products and the use of biometrics and other video analytics; (xv) the impact, including increased costs and potential liabilities, associated with changes in laws and regulations regarding cybersecurity, privacy, data protection, data sovereignty and information security; (xvi) the impact of government regulation of radio frequencies; (xvii) regulations, laws and other compliance requirements and risks applicable to our U.S. government customer contracts and grants; (xviii) the impact, including increased costs and additional compliance obligations, associated with existing or future telecommunications-related laws and regulations; (xix) impact of product regulatory and safety, consumer, worker safety and environmental product compliance and remediation laws; (xx) impact of tax matters; (xxi) increased cybersecurity threats, a security breach or other significant disruption of our IT systems or those of our outsource partners, suppliers or customers; (xxii) our inability to protect our intellectual property or potential infringement of intellectual property rights of third parties; (xxiii) risks relating to intellectual property licenses and intellectual property indemnities in our customer and supplier contracts; (xxiv) our license of the MOTOROLA, MOTO, MOTOROLA SOLUTIONS and the Stylized M logo and all derivatives and formatives thereof from Motorola Trademark Holdings, LLC; (xxv) inability to access the capital markets for financing on acceptable terms and conditions; (xxvi) exposure to exchange rate fluctuations on crossborder transactions and the translation of local currency results into U.S. dollars; (xxvii) impact of returns on pension and retirement plan assets and interest rate changes; and (xxviii) the return of capital to shareholders through dividends and/or repurchasing shares. Motorola Solutions undertakes no obligation to publicly update any forward-looking statement or risk factor, whether as a result of new information, future events or otherwise. The company uses its website as a means of disclosing material, non-public information and for complying with the company's disclosure obligations under Regulation FD. Therefore, the company encourages investors to monitor the Investor Relations page of the company's website at www.motorolasolutions.com/investors, and review the information the company posts on that page. About Motorola Solutions | Solving for safer Safety and security are at the heart of everything we do at Motorola Solutions. We build and connect technologies to help protect people, property and places. Our solutions foster the collaboration that’s

8

critical for safer communities, safer schools, safer hospitals, safer businesses, and ultimately, safer nations. Learn more about our commitment to innovating for a safer future for us all at www.motorolasolutions.com.

MEDIA CONTACT Matt Schuler Motorola Solutions +1 312-909-5234 [email protected] INVESTOR CONTACT Brian Piotrowski Motorola Solutions +1 847-576-6899 [email protected]

9

GAAP-1 Motorola Solutions, Inc. and Subsidiaries Condensed Consolidated Statements of Operations (In millions, except per share amounts) Three Months Ended Net sales from products Net sales from services Net sales Costs of products sales Costs of services sales Costs of sales Gross margin Selling, general and administrative expenses Research and development expenditures Other charges (income) Intangibles amortization Operating earnings Other income (expense): Interest expense, net Other, net Total other expense Net earnings before income taxes Income tax expense Net earnings Less: Earnings attributable to non-controlling interests Net earnings attributable to Motorola Solutions, Inc. Earnings per common share: Basic Diluted Weighted average common shares outstanding: Basic Diluted Net sales from products Net sales from services Net sales Costs of products sales Costs of services sales Costs of sales Gross margin Selling, general and administrative expenses Research and development expenditures Other charges (income) Intangibles amortization Operating earnings Other income (expense): Interest expense, net Other, net Total other expense Net earnings before income taxes Income tax expense Net earnings Less: Earnings attributable to non-controlling interests Net earnings attributable to Motorola Solutions, Inc.

  • Percentages may not add up due to rounding

$

October 3, 2026 1,999 1,377 3,376 800 808 1,608 1,768 504 276 114 97 777

September 27, 2025 $ 1,751 1,258 3,009 728 727 1,455 1,554 485 237 (4) 66 770

$

(107) 8 (99) 678 164 514 2 512

$

(86) 41 (45) 725 161 564 2 562

$ $

3.09 3.06

$ $

3.37 3.33

165.5 167.4

166.6 169.0

Percentage of Net Sales* 59.2 % 58.2 % 40.8 % 41.8 % 100.0 % 100.0 % 40.0 % 41.6 % 58.7 % 57.8 % 47.6 % 48.4 % 52.4 % 51.6 % 14.9 % 16.1 % 8.2 % 7.9 % 3.4 % (0.1) % 2.9 % 2.2 % 23.0 % 25.6 % (3.2) % 0.2 % (2.9) % 20.1 % 4.9 % 15.2 % 0.1 % 15.2 %

(2.9) % 1.4 % (1.5) % 24.1 % 5.4 % 18.7 % 0.1 % 18.7 %

1

GAAP-2 Motorola Solutions, Inc. and Subsidiaries Condensed Consolidated Statements of Operations (In millions, except per share amounts)

Net sales from products Net sales from services Net sales Costs of products sales Costs of services sales Costs of sales Gross margin Selling, general and administrative expenses Research and development expenditures Other charges Intangibles amortization Operating earnings Other income (expense): Interest expense, net Other, net Total other expense Net earnings before income taxes Income tax expense Net earnings Less: Earnings attributable to non-controlling interests Net earnings attributable to Motorola Solutions, Inc. Earnings per common share: Basic Diluted Weighted average common shares outstanding: Basic Diluted Net sales from products Net sales from services Net sales Costs of products sales Costs of services sales Costs of sales Gross margin Selling, general and administrative expenses Research and development expenditures Other charges (income) Intangibles amortization Operating earnings Other income (expense): Interest expense, net Other, net Total other expense Net earnings before income taxes Income tax expense Net earnings Less: Earnings attributable to non-controlling interests Net earnings attributable to Motorola Solutions, Inc.

Nine Months Ended October 3, 2026 September 27, 2025 $ 5,298 $ 4,731 3,925 3,571 9,223 8,302 2,130 1,948 2,285 2,087 4,415 4,035 4,808 4,267 1,439 1,371 788 700 188 10 282 142 2,111 2,044

$

(315) 64 (251) 1,860 420 1,440 5 1,435

$

(192) 100 (92) 1,952 442 1,510 5 1,505

$ $

8.66 8.57

$ $

9.02 8.89

165.7 167.5

166.8 169.2

Percentage of Net Sales* 57.4 % 57.0 % 42.6 % 43.0 % 100.0 % 100.0 % 40.2 % 41.2 % 58.2 % 58.4 % 47.9 % 48.6 % 52.1 % 51.4 % 15.6 % 16.5 % 8.5 % 8.4 % 2.0 % 0.1 % 3.1 % 1.7 % 22.9 % 24.6 % (3.4) % 0.7 % (2.7) % 20.2 % 4.6 % 15.6 % 0.1 % 15.6 %

(2.3) % 1.2 % (1.1) % 23.5 % 5.3 % 18.2 % 0.1 % 18.1 %

  • Percentages may not add up due to rounding

2

GAAP-3 Motorola Solutions, Inc. and Subsidiaries Condensed Consolidated Balance Sheets (In millions) October 3, 2026 Assets Cash and cash equivalents Accounts receivable, net Contract assets Inventories, net Other current assets Total current assets Property, plant and equipment, net Operating lease assets Investments Deferred income taxes Goodwill Intangible assets, net Other assets Total assets Liabilities and Stockholders' Equity Short-term borrowings Accounts payable Contract liabilities Accrued liabilities Total current liabilities Long-term debt Operating lease liabilities Other liabilities Total Motorola Solutions, Inc. stockholders’ equity Non-controlling interests Total liabilities and stockholders’ equity

$

$ $

$

December 31, 2025

774 2,441 1,535 1,511 452 6,713 1,203 534 292 697 7,666 3,502 534 21,141

$

750 1,049 2,481 1,839 6,119 9,361 409 2,166 3,069 17 21,141

$

$

$

1,165 2,200 1,574 983 378 6,300 1,165 581 187 761 6,800 3,104 491 19,389 749 1,134 2,265 1,930 6,078 8,413 471 2,000 2,410 17 19,389

3

GAAP-4 Motorola Solutions, Inc. and Subsidiaries Condensed Consolidated Statements of Cash Flows (In millions) Three Months Ended October 3, 2026 Operating Net earnings $ Adjustments to reconcile Net earnings to Net cash provided by operating activities: Depreciation and amortization Contingent earnout adjustment Non-cash other charges Share-based compensation expenses Changes in assets and liabilities, net of effects of acquisitions, dispositions, and foreign currency translation adjustments: Accounts receivable Inventories Other current assets and contract assets Accounts payable, accrued liabilities and contract liabilities Other assets and liabilities Deferred income taxes Net cash provided by operating activities Investing Acquisitions and investments, net Proceeds from sales of investments and businesses, net Capital expenditures Net cash used for investing activities Financing Net proceeds from issuance of debt Net proceeds from short-term borrowings Repayments of short-term debt Issuances of common stock, net of tax Purchases of common stock Payments of dividends Payments of dividends to non-controlling interests Net cash provided by financing activities Effect of exchange rate changes on total cash and cash equivalents Net increase (decrease) in total cash and cash equivalents Cash and cash equivalents, beginning of period Cash and cash equivalents, end of period $

514

September 27, 2025 $

564

150 87 10 103

115 — 1 73

(263) (148) (33) 47 157 38 662

(128) (23) (108) 175 52 78 799

(1,363) 2 (73) (1,434)

(4,370) 2 (66) (4,434)

942 435 (300) 54 (94) (200) (1) 836 — 64 710 774 $

750 923 (70) 32 (121) (182) (1) 1,331 (8) (2,312) 3,206 894

4

GAAP-5 Motorola Solutions, Inc. and Subsidiaries Condensed Consolidated Statements of Cash Flows (In millions) Nine Months Ended October 3, 2026

September 27, 2025

Operating Net earnings Adjustments to reconcile Net earnings to Net cash provided by operating activities: Depreciation and amortization

$

1,440

$

1,510

441

282

Contingent earnout adjustment

178

—

Non-cash other charges (income)

10

(4)

Share-based compensation expenses

307

213

Accounts receivable

(227)

1

Inventories

(503)

(107)

Other current assets and contract assets

(24)

(230)

Accounts payable, accrued liabilities and contract liabilities

Changes in assets and liabilities, net of effects of acquisitions, dispositions, and foreign currency translation adjustments:

(161)

(280)

Other assets and liabilities

73

101

Deferred income taxes

48

95

1,582

1,581

(1,587)

(4,835)

8

14

(190)

(151)

1

—

(1,768)

(4,972)

942

2,733

Net cash provided by operating activities Investing Acquisitions and investments, net Proceeds from sales of investments and businesses, net Capital expenditures Proceeds from sales of property, plant and equipment Net cash used for investing activities Financing Net proceeds from issuance of debt Net proceeds from short-term borrowings

500

923

Repayments of short-term debt

(500)

(322)

Revolving credit facility renewal fees

—

(5)

Issuances of common stock, net of tax

45

(3)

Purchases of common stock

(543)

(664)

Payments of dividends

(602)

(546)

(5)

(5)

(163)

2,111

(42)

72

Net decrease in total cash and cash equivalents

(391)

(1,208)

Cash and cash equivalents, beginning of period

1,165

2,102

Payments of dividends to non-controlling interests Net cash provided by (used for) financing activities Effect of exchange rate changes on total cash and cash equivalents

Cash and cash equivalents, end of period

$

774

$

894

5

Non-GAAP-1 Motorola Solutions, Inc. and Subsidiaries Reconciliation of Net Cash Provided by Operating Activities to Free Cash Flow (In millions) Three Months Ended September 27, 2025

October 3, 2026 Net cash provided by operating activities

$

Capital expenditures Free cash flow

662

$

(73) $

589

Nine Months Ended

799

$

(66) $

733

September 27, 2025

October 3, 2026 1,582

$

(190) $

1,392

1,581 (151)

$

1,430

6

Non-GAAP-2 Motorola Solutions, Inc. and Subsidiaries Reconciliation of Net Earnings Attributable to MSI to Non-GAAP Net Earnings Attributable to MSI (In millions) Three Months Ended Statement Line Net earnings attributable to MSI

Nine Months Ended

October 3, 2026

September 27, 2025

October 3, 2026

September 27, 2025

$

512

$

562

$

1,435

$

1,505

$

103

$

73

$

307

$

213

Non-GAAP adjustments before income taxes: Share-based compensation expenses

Cost of sales, SG&A and R&D

Intangible assets amortization expense

Intangibles amortization

97

66

282

142

Contingent earnout adjustment

Other charges (income)

87

—

178

—

Acquisition-related transaction fees

Other charges (income)

29

55

42

63

Reorganization of business charges

Cost of sales and Other charges (income)

12

14

42

45

Fair value adjustments to equity investments

Other (income) expense

9

(8)

1

(21)

Hytera-related legal expenses

SG&A

3

11

9

31

Assessments of uncertain tax positions

Interest income, net, Other (income) expense

1

1

2

2

Legal settlements

Other charges (income)

1

2

5

7

Operating lease asset impairments

Other charges (income)

—

1

5

1

Investment impairments

Other (income) expense

—

2

—

2

Loss on financing issuance costs

Other (income) expense

—

—

—

2

Fixed asset impairments

Other charges (income)

—

—

1

—

Gain on Hytera litigation

Other charges (income)

(13)

(74)

(73)

(94)

Total Non-GAAP adjustments before income taxes

$

329

$

143

$

801

$

393

Income tax expense on Non-GAAP adjustments

56

19

148

70

Total Non-GAAP adjustments after income taxes

273

124

653

323

Non-GAAP Net earnings attributable to MSI

$

785

$

686

$

2,088

$

1,828

Calculation of Non-GAAP Tax Rate (In millions) Three Months Ended

Net earnings before income taxes

October 3, 2026

September 27, 2025

October 3, 2026

September 27, 2025

$

$

$

$

Total Non-GAAP adjustments before income taxes* Non-GAAP Net earnings before income taxes Income tax expense Income tax expense on Non-GAAP adjustments** Total Non-GAAP Income tax expense Non-GAAP Tax rate

Nine Months Ended

678

725

1,952

143

801

393

1,007

868

2,661

2,345

164

161

420

442

56 $

1,860

329

220 21.8 %

19 $

180 20.7 %

148 $

568 21.3 %

70 $

512 21.8 %

*See reconciliation on Non-GAAP-2 table above for detail on Non-GAAP adjustments before income taxes **Income tax impact of highlighted items

7

Non-GAAP-2 Reconciliation of Earnings Per Share to Non-GAAP Earnings Per Share* Three Months Ended Statement Line Net earnings attributable to MSI

Nine Months Ended

October 3, 2026

September 27, 2025

October 3, 2026

September 27, 2025

$

3.06

$

3.33

$

8.57

$

8.89

$

0.62

$

0.43

$

1.83

$

1.26

Non-GAAP adjustments before income taxes: Share-based compensation expenses

Cost of sales, SG&A and R&D

Intangible assets amortization expense

Intangibles amortization

0.58

0.39

1.68

0.84

Contingent earnout adjustment

Other charges (income)

0.52

—

1.06

—

Acquisition-related transaction fees

Other charges (income)

0.17

0.33

0.25

0.37

Reorganization of business charges

Cost of sales and Other charges (income)

0.07

0.08

0.25

0.27

Fair value adjustments to equity investments

Other (income) expense

0.05

(0.05)

0.01

(0.12)

Hytera-related legal expenses

SG&A

0.02

0.07

0.05

0.18

Assessments of uncertain tax positions

Interest income, net, Other (income) expense

0.01

0.01

0.01

0.01

Legal settlements

Other charges (income)

0.01

0.01

0.03

0.04

Operating lease asset impairments

Other charges (income)

—

0.01

0.03

0.01

Investment impairments

Other (income) expense

—

0.01

—

0.01

Loss on financing issuance costs

Other (income) expense

—

—

—

0.01

Fixed asset impairments

Other charges (income)

—

—

0.01

—

Gain on Hytera litigation

Other charges (income)

(0.08)

(0.44)

(0.43)

(0.56)

Total Non-GAAP adjustments before income taxes

$

1.97

$

0.85

$

4.78

$

2.32

Income tax expense on Non-GAAP adjustments

0.34

0.12

0.89

0.41

Total Non-GAAP adjustments after income taxes

1.63

0.73

3.89

1.91

Non-GAAP Net earnings attributable to MSI Diluted Weighted Average Common Shares

$

4.69

167.4

$

4.06

169.0

$

12.46

167.5

$

10.80

169.2

*Indicates Non-GAAP Diluted EPS

8

Non-GAAP-3 Motorola Solutions, Inc. and Subsidiaries Reconciliations of Operating Earnings to Non-GAAP Operating Earnings and Operating Margin to NonGAAP Operating Margin (In millions) Three Months Ended October 3, 2026

Net sales

Products and Systems Integration

Software and Services

$

$

Operating earnings ("OE")

2,118 446

1,258

$

331

September 27, 2025

Total

Products and Systems Integration

Software and Services

3,376

$

$

777

1,897 458

1,112

Total $

312

3,009 770

Above OE non-GAAP adjustments: Contingent earnout adjustment

78

9

87

—

—

—

Share-based compensation expenses

69

34

103

53

20

73

Intangible assets amortization expense

59

38

97

44

22

66

Acquisition-related transaction fees

20

9

29

52

3

55

Reorganization of business charges

9

3

12

9

5

14

Hytera-related legal expenses

3

—

3

11

—

11

Legal settlements

—

1

1

1

1

2

Operating lease asset impairments

—

—

—

1

—

1

Gain on Hytera litigation

(13)

—

(13)

(74)

—

(74)

Total above-OE non-GAAP adjustments

225

94

319

97

51

148

Operating earnings after non-GAAP adjustments

$

671

$

425

$

1,096

$

555

$

363

$

918

Operating earnings as a percentage of net sales - GAAP

21.1 %

26.3 %

23.0 %

24.1 %

28.1 %

25.6 %

Operating earnings as a percentage of net sales - after non-GAAP adjustments

31.7 %

33.8 %

32.5 %

29.3 %

32.6 %

30.5 %

9

Non-GAAP-4 Motorola Solutions, Inc. and Subsidiaries Reconciliations of Operating Earnings to Non-GAAP Operating Earnings and Operating Margin to NonGAAP Operating Margin (In millions) Nine Months Ended October 3, 2026

Net sales

Products and Systems Integration

Software and Services

$

$

Operating earnings ("OE")

5,586

3,637

$

September 27, 2025

Total

Products and Systems Integration

Software and Services

9,223

$

$

5,095

3,207

Total $

8,302

1,112

999

2,111

1,173

871

2,044

Share-based compensation expenses

203

104

307

155

58

213

Intangible assets amortization expense

186

96

282

76

66

142

Contingent earnout adjustment

160

18

178

—

—

—

Reorganization of business charges

30

12

42

31

14

45

Acquisition-related transaction fees

22

20

42

54

9

63

Hytera-related legal expenses

9

—

9

31

—

31

Operating lease asset impairments

3

2

5

1

—

1

Legal settlements

3

2

5

4

3

7

Fixed asset impairments

1

—

1

—

—

—

Above-OE non-GAAP adjustments:

Gain on Hytera litigation

(73)

—

(73)

(94)

—

(94)

Total above-OE non-GAAP adjustments

544

254

798

258

150

408

Operating earnings after non-GAAP adjustments

$

1,656

$

1,253

$

2,909

$

1,431

$

1,021

$

2,452

Operating earnings as a percentage of net sales - GAAP

19.9 %

27.5 %

22.9 %

23.0 %

27.2 %

24.6 %

Operating earnings as a percentage of net sales - after non-GAAP adjustments

29.6 %

34.5 %

31.5 %

28.1 %

31.8 %

29.5 %

10

Non-GAAP-5 Motorola Solutions, Inc. and Subsidiaries Reconciliation of Revenue to Non-GAAP Organic Revenue (In millions) Three Months Ended Net sales Non-GAAP adjustments: Sales from acquisitions Organic revenue

$

October 3, 2026 3,376

$

323 3,053

September 27, 2025 $ 3,009

% Change 12 %

112 2,897

5%

September 27, 2025 $ 8,302

% Change 11 %

115 8,187

3%

$

Nine Months Ended Net sales Non-GAAP adjustments: Sales from acquisitions Organic revenue

$

October 3, 2026 9,223

$

789 8,434

$

11
Company raises full-year revenue and earnings outlook again and increases full-year cash flow expectations

  • Sales of $3.4 billion, up 12% versus a year ago
    • Products and Systems Integration sales up 12%
    • Software and Services sales up 13%
  • GAAP earnings per share ("EPS") of $3.06
  • Non-GAAP EPS* of $4.69
  • Record ending backlog of $16.6 billion, up 14% versus a year ago, driven by record Q3 orders
  • Acquired D-Fend Solutions ("D-Fend"), an industry leader in counter-drone technology
  • Announced $2 billion increase to the share repurchase authorization

**
CHICAGO** – November 4, 2026 – Motorola Solutions, Inc. (NYSE: MSI) today reported its earnings results for the third quarter of 2026.

“Q3 was another outstanding quarter, with double-digit revenue growth across both segments and all three technologies,” said Greg Brown, chairman and CEO, Motorola Solutions. “We continue to see exceptionally strong demand across our safety and security solutions, driving record Q3 orders and an all-time record ending backlog. As a result, we’re raising our revenue and earnings outlook again and increasing our cash flow expectations for the full year.”

Financial table

OTHER SELECTED FINANCIAL RESULTS

  • Revenue - Sales were $3.4 billion, up 12% from the year-ago quarter driven by growth in North America and International. Revenue growth related to acquisitions was $211 million and foreign currency tailwinds were $11 million in the quarter. The Products and Systems Integration segment grew 12% driven by growth in Mission Critical Networks ("MCN") and Video Security and Access Control ("Video"). The Software and Services segment grew 13% driven by growth in MCN, Command Center and Video.

  • Operating margin - GAAP operating margin was 23.0% of sales, down from 25.6% in the year-ago quarter primarily driven by an increase to the contingent Silvus earnout in the current quarter due to strong performance of the business. Non-GAAP operating margin was 32.5% of sales, up 200 basis points from 30.5% in the year-ago quarter driven by higher sales and improved operating leverage, partially offset by higher supply chain costs.

  • Taxes - The GAAP effective tax rate during the quarter was 24.2%, versus 22.2% in the year-ago quarter and the non-GAAP effective tax rate was 21.8%, versus 20.7% in the year-ago quarter. The increases in the GAAP and non-GAAP effective tax rates were primarily driven by lower benefits from share-based compensation recognized in the current quarter.

  • Cash flow - Operating cash flow was $662 million, compared to $799 million in the year-ago quarter and free cash flow was $589 million, compared to $733 million in the year-ago quarter. Both the operating cash flow and free cash flow for the quarter decreased due to higher tax and interest payments during the quarter, primarily offset by higher earnings, net of non-cash charges.

  • Capital allocation - During the quarter, the company paid $200 million in cash dividends, repurchased $94 million of common stock at an average price of $457.07 and invested $73 million in capital expenditures. Additionally, the company announced a $2 billion increase to the share repurchase authorization during the quarter.

    The company also closed the acquisition of D-Fend during the quarter for $1.3 billion, net of cash acquired, which was primarily funded through $950 million of new long-term senior notes. The company also issued a new $300 million 364-day term loan and repaid $300 million of the 364-day term loan issued for the Silvus acquisition, upon its maturity during the quarter.

    In addition, the company acquired DeepNeuronic, a provider of AI software that turns live camera feeds into real-time operational insights, for $29 million, net of cash acquired.

  • Backlog - The company ended the quarter with record backlog of $16.6 billion, up 14% or $2.1 billion from the year-ago quarter driven by record Q3 orders in all three technologies. Products and Systems Integration segment backlog was up $635 million, or 18%, driven primarily by strong demand in MCN and Video. Software and Services segment backlog was up $1.4 billion, or 13%, driven by strong demand in all three technologies.

**
NOTABLE WINS AND ACHIEVEMENTS**

Products and Systems Integration

  • $140 million P25 systems and device order with the Federal Bureau of Prisons
  • $98 million P25 device and SVX order for a U.S. federal customer
  • $63 million P25 system and device order for the Metro Government of Nashville and Davidson County
  • $56 million fixed video order for a large convenience store chain
  • $39 million Silvus order for a German unmanned systems provider

Software and Services

  • $139 million ten-year P25 services, mobile video and Command Center order for the State of Louisiana
  • $78 million eight-year mobile video award for a U.S. federal customer
  • $59 million six-year P25 services order for a state and local customer
  • $51 million computer aided dispatch and records management order for the Los Angeles Police Dept
  • $27 million P25 services renewal for North Carolina State Highway Patrol
     

BUSINESS OUTLOOK

  • Fourth quarter 2026 - The company expects revenue growth of approximately 13% compared to the fourth quarter of 2025 and non-GAAP EPS between $5.47 and $5.52 per share. This assumes approximately 168 million of fully diluted shares and a non-GAAP effective tax rate of approximately 22.5%.

  • Full-year 2026 - The company now expects revenue of approximately $13.050 billion, up from its prior guidance of $12.975 billion and non-GAAP EPS between $17.94 and $17.99 per share, up from its prior guidance of between $17.62 and $17.72 per share. This outlook assumes approximately 168 million of fully diluted shares and a non-GAAP effective tax rate between 21.5% and 22%.

    In addition, the company is increasing its operating cash flow expectations to $3.050 billion for the full year.

The company has not quantitatively reconciled its guidance for forward-looking non-GAAP measurements in this news release to their most comparable GAAP measurements because the company does not provide specific guidance for the various reconciling items as certain items that impact these measurements have not occurred, are out of the company’s control, or cannot be reasonably predicted. Accordingly, a reconciliation to the most comparable GAAP financial measurement is not available without unreasonable effort. Please note that the unavailable reconciling items could significantly impact the company’s results.
**
RECENT EVENTS

MACROECONOMIC ENVIRONMENT UPDATE**

The global trade landscape continues to shift rapidly, including evolving tariffs and import/export regulations, such as restrictions around rare earth minerals, trade barriers and trade disputes.

On February 20, 2026, a U.S. Supreme Court ruling invalidated tariffs imposed under the International Emergency Economic Powers Act (“IEEPA”). On April 20, 2026, the U.S. Customs and Border Protection launched a system to process IEEPA tariff refund claims. Following the implementation of this system, the company determined that the recovery of a portion of these refunds is now probable. Accordingly, during the nine months ended October 3, 2026, the company recognized a favorable adjustment of approximately $70 million recorded within Cost of sales in its Condensed Consolidated Statements of Operations.

In addition, the company is experiencing higher costs for memory in its products which is a result of substantial demand in the market driven by AI. As a result, the company continues to observe elevated volatility and uncertainty around the global supply chain. The company engages with global suppliers across a diverse network of locations around the world. The company is actively managing its inventory and continues to work with its global supply base to mitigate its exposure to elevated volatility and uncertainty from these rising memory costs, as well as global tariffs and import/export regulations that have developed, and which may continue to develop, to ensure supply continues at levels necessary to meet its current customer demand. The company expects inventory levels to remain elevated as it mitigates this dynamic supply chain environment. The current environment has led to increased costs on materials and components, for which the company continues to develop mitigation actions going forward.

CONFERENCE CALL AND WEBCAST Motorola Solutions will host its quarterly conference call beginning at 4 p.m. U.S. Central Time (5 p.m. U.S. Eastern Time) on Wednesday, November 4. The conference call will be webcast live at www.motorolasolutions.com/investors . An archive of the webcast will be available for a limited period of time thereafter.

Financial table

**USE OF NON-GAAP FINANCIAL INFORMATION
**In addition to the results presented in accordance with accounting principles generally accepted in the U.S. ("GAAP") included in this news release, Motorola Solutions also has included non-GAAP measurements of results, including free cash flow, non-GAAP operating earnings, non-GAAP EPS, non-GAAP operating margin, non-GAAP net earnings attributable to MSI, non-GAAP tax rate, and organic revenue. The company has provided these non-GAAP measurements to help investors better understand its core operating performance, enhance comparisons of core operating performance from period-to-period and allow better comparisons of its operating performance to that of its competitors. Among other things, management uses these operating results, excluding the identified items, to evaluate the performance of its businesses and to evaluate results relative to certain incentive compensation targets. Management uses operating results excluding these items because it believes these measurements enable it to make better period-to-period evaluations of the financial performance of its core business operations. The non-GAAP measurements are intended only as a supplement to the comparable GAAP measurements and the company compensates for the limitations inherent in the use of non-GAAP measurements by using GAAP measures in conjunction with the non-GAAP measurements. As a result, investors should consider these non-GAAP measurements in addition to, and not in substitution for or as superior to, GAAP measurements.

Reconciliations: Details and reconciliations of such non-GAAP measurements to the corresponding GAAP measurements can be found at the end of this news release.

Free cash flow: Free cash flow represents net cash provided by operating activities less capital expenditures. The company believes that free cash flow is useful to investors as the basis for comparing its performance and coverage ratios with other companies in the company's industries, although the company's measure of free cash flow may not be directly comparable to similar measures used by other companies. This measure is also used as a component of incentive compensation.

Organic Revenue: Organic revenue reflects net sales calculated under GAAP excluding net sales from acquired business owned for less than four full quarters. The company believes organic revenue provides useful information for evaluating the periodic growth of the business on a consistent basis and provides for a meaningful period-to-period comparison and analysis of trends in the business.

Non-GAAP operating earnings, non-GAAP EPS, non-GAAP operating margin and non-GAAP net earnings attributable to MSI each excludes highlighted items, including share-based compensation expenses and intangible assets amortization expense, as follows:

Highlighted items: The company has excluded the effects of highlighted items including, but not limited to, acquisition-related transaction fees, tangible and intangible asset impairments, reorganization of business charges, certain non-cash pension adjustments, legal settlements and other contingencies, gains and losses on investments and businesses, Hytera-related legal expenses, gains and losses on the extinguishment of debt, adjustments to contingent earnout, and the income tax effects of significant tax matters, from its non-GAAP operating expenses and net income measurements because the company believes that these historical items do not reflect expected future operating earnings or expenses and do not contribute to a meaningful evaluation of the company's current operating performance or comparisons to the company's past operating performance. For the purposes of management's internal analysis over operating performance, the company uses financial statements that exclude highlighted items, as these charges do not contribute to a meaningful evaluation of the company's current operating performance or comparisons to the company's past operating performance.

Hytera-Related Legal Expenses: In 2017, the company filed a complaint against Hytera Communications Corporation Limited of Shenzhen, China; Hytera America, Inc.; and Hytera Communications America (West), Inc. (collectively, "Hytera"), in the U.S. District Court for the Northern District of Illinois (the "District Court"), alleging trade secret theft and copyright infringement, and seeking injunctive relief. In 2020, a jury decided in the company's favor, ultimately resulting in an award to the company of $543.7 million, plus $51.1 million in pre-judgment interest and $2.6 million in costs, as well as $34.2 million in attorneys' fees.

In 2024, after both parties appealed to the U.S. Court of Appeals for the Seventh Circuit (the "Court of Appeals"), the Court of Appeals, among other items, affirmed the District Court's award of $407.4 million in damages under the Defend Trade Secrets Act, and directed the District Court to recalculate and reduce its award of $136.3 million in copyright infringement damages, which remains subject to ruling by the District Court. As of October 3, 2026, as a result of this civil litigation and 2020 bankruptcy proceedings by Hytera America, Inc. and Hytera Communications America (West), Inc., Hytera had paid $245 million against this award, $73 million of which was paid in the first nine months of 2026. These payments were recorded as a gain within Other charges within the Consolidated Statement of Operations.

Further, in 2022, the District Court ordered Hytera to pay the company a forward-looking reasonable royalty on Hytera’s products (“I-Series”) that use the company’s stolen trade secrets, applicable to I-Series products sold from July 1, 2019 forward. In 2024, the company received royalties of $61 million related to the I-Series products, which was recorded as a gain within Other charges within the Consolidated Statement of Operations. Beginning in 2025, a favorable ruling in a related legal proceeding in the District Court (which Hytera has subsequently appealed to the Court of Appeals) also ordered Hytera to pay the company for Hytera’s continued use of the company’s trade secrets and copyrighted source code in Hytera’s currently shipping products (“H-Series”), and Hytera has subsequently reported to the company approximately $116 million in royalties subject to the Court's order. While several aspects of the court proceedings related to the H-Series are subject to appeal, the company continues to seek collection of the amounts owed by Hytera through the ongoing legal process.

Management typically considers legal expenses associated with defending the company's intellectual property as “normal and recurring.” Since 2020, the company has believed that Hytera-related legal expenses have not been part of its “normal and recurring” legal expenses incurred to operate its business and has accordingly excluded such expenses from its GAAP operating Income. In addition, as any contingent or actual gains associated with the Hytera litigation are recognized, they will be similarly excluded from the company's non-GAAP operating income, consistent with the company's treatment of the approximately $15 million realized in 2022, $61 million realized in 2024, $157 million realized in 2025, and $73 million realized in the first nine months of 2026. The company believes after the jury award, the presentation of excluding both Hytera-related legal expenses and gains related to awards better aligns with how management evaluates the company's ongoing underlying business performance.

Share-based compensation expenses: The company has excluded share-based compensation expense from its non-GAAP operating expenses and net income measurements. Although share-based compensation is a key incentive offered to the company’s employees and the company believes such compensation contributed to the revenue earned during the periods presented and also believes it will contribute to the generation of future period revenues, the company continues to evaluate its performance excluding share-based compensation expense primarily because it represents a significant non-cash expense. Share-based compensation expense will recur in future periods.

Intangible assets amortization expense: The company has excluded intangible assets amortization expense from its non-GAAP operating expenses and net earnings measurements primarily because it represents a non-cash expense and because the company evaluates its performance excluding intangible assets amortization expense. Amortization of intangible assets is consistent in amount and frequency but is significantly affected by the timing and size of the company’s acquisitions. Investors should note that the use of intangible assets contributed to the company’s revenues earned during the periods presented and will contribute to the company’s future period revenues as well. Intangible assets amortization expense will recur in future periods.

**FORWARD LOOKING STATEMENTS
**This news release contains "forward-looking statements" within the meaning of applicable federal securities law. These statements are made pursuant to the safe harbor provisions of the Private Securities Litigation Reform Act of 1995 and generally include words such as “believes,” “expects,” “intends,” “anticipates,” “estimates” and similar expressions. The company can give no assurance that any actual or future results or events discussed in these statements will be achieved. Any forward-looking statements represent the company’s views only as of today and should not be relied upon as representing the company’s views as of any subsequent date. Readers are cautioned that such forward-looking statements are subject to a variety of risks and uncertainties that could cause the company’s actual results to differ materially from the statements contained in this release. Such forward-looking statements include, but are not limited to, Motorola Solutions’ financial outlook for the fourth quarter and full-year of 2026; and the impact of changes in the global trade environment, the dynamic supply chain environment and the memory market on Motorola Solutions' business, and Motorola Solutions' actions in response thereto (including with respect to inventory levels). Motorola Solutions cautions the reader that the risks and uncertainties below, as well as those in Part I Item 1A of Motorola Solutions’ 2025 Annual Report on Form 10-K and in its other SEC filings available for free on the SEC’s website at www.sec.gov  and on Motorola Solutions’ website at www.motorolasolutions.com/investors , could cause Motorola Solutions’ actual results to differ materially from those estimated or predicted in the forward-looking statements. Many of these risks and uncertainties cannot be controlled by Motorola Solutions, and factors that may impact forward-looking statements include, but are not limited to: (i) impact of current global economic and political conditions in the markets in which the company operates; (ii) increased areas of risk, increased competition and additional compliance obligations associated with the introduction of new or enhanced products and services in our segments; (iii) challenges relating to the use of artificial intelligence ("AI") in our products and services; (iv) impact of catastrophic events on our business or our customers' or suppliers' business; (v) the effectiveness of our strategic acquisitions, including the integrations of such acquired businesses; (vi) the inability of our products to meet our customers’ expectations or regulatory or industry standards, or actual or perceived systems or service failures of our products and services; (vii) our inability to purchase a sufficient amount of materials, parts, and components, as well as software and services, at acceptable prices to meet the demands of our customers, and any disruption to our suppliers or significant increase in the price of supplies; (viii) risks related to our large, multi-year system and services contracts; (ix) the global nature of our employees, customers, suppliers and outsource partners; (x) our use of third-parties to develop, design and/or manufacture many of our components and some of our products, and to perform portions of our business operations; (xi) the inability of our subcontractors to perform in a timely and compliant manner or adhere to our Human Rights Policy; (xii) inability to attract and retain senior management and key employees; (xiii) evolving and sometimes conflicting expectations from investors, customers, lawmakers, regulators and other stakeholders regarding social and sustainability considerations and disclosures; (xiv) challenges relating to existing or future legislation and regulations pertaining to AI, AI-enabled products and the use of biometrics and other video analytics; (xv) the impact, including increased costs and potential liabilities, associated with changes in laws and regulations regarding cybersecurity, privacy, data protection, data sovereignty and information security; (xvi) the impact of government regulation of radio frequencies; (xvii) regulations, laws and other compliance requirements and risks applicable to our U.S. government customer contracts and grants; (xviii) the impact, including increased costs and additional compliance obligations, associated with existing or future telecommunications-related laws and regulations; (xix) impact of product regulatory and safety, consumer, worker safety and environmental product compliance and remediation laws; (xx) impact of tax matters; (xxi) increased cybersecurity threats, a security breach or other significant disruption of our IT systems or those of our outsource partners, suppliers or customers; (xxii) our inability to protect our intellectual property or potential infringement of intellectual property rights of third parties; (xxiii) risks relating to intellectual property licenses and intellectual property indemnities in our customer and supplier contracts; (xxiv) our license of the MOTOROLA, MOTO, MOTOROLA SOLUTIONS and the Stylized M logo and all derivatives and formatives thereof from Motorola Trademark Holdings, LLC; (xxv) inability to access the capital markets for financing on acceptable terms and conditions; (xxvi) exposure to exchange rate fluctuations on cross-border transactions and the translation of local currency results into U.S. dollars; (xxvii) impact of returns on pension and retirement plan assets and interest rate changes; and (xxviii) the return of capital to shareholders through dividends and/or repurchasing shares. Motorola Solutions undertakes no obligation to publicly update any forward-looking statement or risk factor, whether as a result of new information, future events or otherwise.

The company uses its website as a means of disclosing material, non-public information and for complying with the company's disclosure obligations under Regulation FD. Therefore, the company encourages investors to monitor the Investor Relations page of the company's website at www.motorolasolutions.com/investors , and review the information the company posts on that page.

**About Motorola Solutions | Solving for safer
**Safety and security are at the heart of everything we do at Motorola Solutions. We build and connect technologies to help protect people, property and places. Our solutions foster the collaboration that’s critical for safer communities, safer schools, safer hospitals, safer businesses, and ultimately, safer nations. Learn more about our commitment to innovating for a safer future for us all at www.motorolasolutions.com .

Media and Investor Contacts

Matt Schuler

Media Contact

[email protected] u

+1 312-909-5234

Brian Piotrowski

Investor Contact

[email protected] u

+1 847-576-6899

Matt Schuler

Media Contact

[email protected] u

+1 312-909-5234

Brian Piotrowski

Investor Contact

[email protected] u

+1 847-576-6899

View All Press Releases

  • Follow Us:

About Us
PARTNERS
INVESTORS
NEWSROOM
TRAINING
CAREERS
COMMUNITY

MOTOROLA, MOTO, MOTOROLA SOLUTIONS and the Stylized M Logo are trademarks or registered trademarks of Motorola Trademark Holdings, LLC and are used under license. All other trademarks are the property of their respective owners.

×

×

Please wait...

Video

Please wait...

Subscribe to the Motorola Solutions Newsroom

×

Loading form...

Subscribe to the Motorola Solutions Newsroom

×

Loading form...

  • Helps resource-strapped public safety agencies more easily see trends in how they operate
  • Transforms agency’s emergency response data into clear insights, with Assist AI suggesting actions to drive efficiencies
  • Allows agencies to more effectively measure operational improvements and benchmark against similar agencies

Motorola Solutions

Public safety agencies possess a staggering volume of information about their operations – near-constant streams of 911 call data and transcripts, computer-aided dispatch (CAD) logs, case files and more – yet few have been able to transform this emergency response data into optimized insights to drive agency efficiencies. Historically, mining for a helpful insight – like cyclical peaks in 911 call volume to inform staffing or rising incident types to inform officer training – requires assigning the time and resources to manually sift through and merge data from across the agency’s systems and platforms. 

Industry research indicates that public safety analysts today can spend upwards of 40 percent of their time extracting data from spreadsheets and calculating metrics on pen and paper. To get a more holistic view across data sets, some agencies even invest in bespoke integrations for custom analysis. In an industry where time and resources can be scarce, detailed data analysis can pull personnel away from their day-to-day support of the community. 

Karen Sutherland, deputy director, Police Communication Services, Scottsdale Police Department in Arizona said:

“In an industry facing critical staffing challenges, being able to maximize resources with the right data leads to better decisions. The ability to aggregate data from multiple sources empowers supervisors to make decisions that improve outcomes for both agency personnel and the community.”

Motorola Solutions is introducing Insights, which leverages Assist , its mission-critical artificial intelligence (AI), to address these challenges and shape what’s next for public safety analytics and reporting technology.  

Turning Data into Action

Motorola Solutions

Insights is a new cloud-native, agentic analytics platform that brings an agency’s data streams across their systems into dynamic and customizable dashboards, making it easier for public safety personnel like leadership, investigators, analysts, public safety answering point (PSAP) directors and patrol personnel to aggregate, visualize, make sense of, report and act on valuable operational data and trends. It gives public safety personnel powerful, tailored insights when and where they need them.  

The data from Insights can help public safety agencies make better decisions, for example:

  • Call handling times, incident types and locations enable PSAP directors to seamlessly tie together call and CAD data for better preparation and allocation of staff and resources.
  • Body camera activation rates allow police chiefs to track compliance with agency policies and understand where more officer training may be required.
  • Types and number of cases closed help investigators and agency leadership justify decisions and convey agency impact.

In Insights, Assist Chat – Motorola Solutions’ secure AI chat for public safety – allows agencies to interact conversationally with their data to deepen their understanding of the trends shown in the dashboard.

For example, a PSAP director might ask, “Why was our average on-hold time longer this week?” while a police chief might ask, “What policies or procedures do our officers need more training on?” These insights help users take action to address the trends and improve operations. 

AI-Powered Alerts on Critical Changes

Insights can share alerts in real time that highlight operational anomalies, such as high call abandonment rates or disabled body cameras, which could signal call quality issues or compliance infractions. This provides agencies the opportunity to address emerging issues before they escalate.

Todd Piett, senior vice president, Command Center and Cloud Solutions, Motorola Solutions said: 

“No matter if you are a real-time crime center supervisor, a chief of police or a squad leader, with Insights, you will find powerful, relevant data at your fingertips. We are giving leaders direct operational clarity and transforming reporting so agencies can optimize resources and better serve their communities.”

Benchmarking Progress

Insights makes it easy for agencies to evaluate their progress by comparing their performance over time – such as seeing if and how their emergency response times improved month over month. By reviewing historical trends side by side, agencies can quickly confirm whether operational changes made are delivering real results.

Agencies will also be able to measure their performance against peer departments, including agencies of a similar size or within the same region. This anonymous benchmarking helps leadership understand whether they are meeting industry expectations, identify emerging gaps and make targeted adjustments to help their community receive high levels of service. 

Operationalizing Impact Across Public Safety Systems

Insights helps reduce administrative overhead and sharpen operational focus. It enables public safety agencies to:

  • Receive AI-powered alerts about potential issues, so they can address problems early.
  • Ask questions in plain language to easily search and analyze data.
  • View agency-wide impact at a glance to track key operational metrics without pen and paper.
  • Schedule automated reports to consistently track important statistics and performance.
  • Measure success and return on investment to justify operational and purchasing decisions.

Market research indicates nearly one-third of public safety agencies exploring the adoption of a data integration platform identified faster analysis and reporting as a primary benefit. Insights’ quick access to operational intelligence can transform how leadership manages personnel, deploys resources and mitigates risk across jurisdictions.

Insights is powered by Microsoft Fabric , a next generation data platform, which is now generally available on Microsoft Azure Government.

Learn more about Insights and contact your sales representative for a demo. 

Prompts

Motorola Solutions, Inc. (ticker MSI), listed in United States.

Company History

Date Change Detail
Jan 6, 2011 Renamed MOTOROLA INC → MOTOROLA SOLUTIONS, INC.
Feb 6, 2007 Acquired Acquired Netopia Inc (CIK 1012482). Its filings from before the deal are on its own company page, not shown here.
Nov 14, 2006 Acquired Acquired Tut Systems Inc (CIK 878436). Its filings from before the deal are on its own company page, not shown here.

ETFs Holding Motorola Solutions, Inc.

ETF Weight in ETF Shares Market value As of
LRGG 4.08% 25,914 $ 10.762M Jun 30, 2026
USSE 4.06% 35,107 $ 14.58M Jun 30, 2026
JGRW 3.66% 6,616 $ 3.211M Aug 31, 2026
EASY 3.53% 4,926 $ 2.147M Jul 31, 2026
EQTY 3.13% 102,469 $ 44.651M Jul 31, 2026
RJDI 3.01% 7,284 $ 3.025M Jun 30, 2026
HUSV 2.50% 2,682 $ 1.433M Nov 16, 2026
AIFD 2.28% 6,550 $ 2.854M Jul 31, 2026
SELV 2.20% 12,959 $ 5.382M Jun 30, 2026
GTEK 2.16% 10,597 $ 5.143M Aug 31, 2026
LOTI 1.84% 1,980 $ 862.785K Jul 31, 2026
TDVI 1.70% 21,267 $ 11.383M Nov 11, 2026
NPFE 1.65% 24,663 $ 10.747M Jul 31, 2026
LOWV 1.55% 6,519 $ 3.164M Aug 31, 2026
FMAG 1.51% 8,521 $ 3.713M Jul 31, 2026
CGVV 1.50% 5,690 $ 3.039M Nov 16, 2026
XPND 1.47% 965 $ 515.474K Nov 16, 2026
ALRG 1.34% 257 $ 111.988K Jul 31, 2026
ROE 1.21% 5,685 $ 2.99M Nov 18, 2026
RFFC 1.09% 728 $ 353.298K Aug 31, 2026
ESLG 1.04% 557 $ 242.713K Jul 31, 2026
WBIF 1.04% 590 $ 245.021K Jun 30, 2026
GGTL 0.98% 314 $ 130.401K Jun 30, 2026
TCAL 0.97% 6,026 $ 3.219M Nov 17, 2026
ESUM 0.96% 4,032 $ 1.757M Jul 31, 2026
BDVL 0.88% 29,404 $ 15.707M Nov 16, 2026
LRGC 0.87% 24,065 $ 11.679M Aug 31, 2026
ACLC 0.83% 5,573 $ 2.705M Aug 31, 2026
IETC 0.83% 9,114 $ 4.868M Nov 16, 2026
VFMV 0.81% 7,581 $ 3.679M Aug 31, 2026
WBIG 0.81% 535 $ 222.18K Jun 30, 2026
UPSD 0.81% 2,163 $ 942.527K Jul 31, 2026
DUHP 0.71% 262,379 $ 139.166M Nov 12, 2026
SROI 0.70% 302 $ 131.597K Jul 31, 2026
ACVF 0.62% 2,165 $ 943.399K Jul 31, 2026
ESLV 0.59% 193 $ 84.1K Jul 31, 2026
DIVN 0.53% 3,348 $ 1.625M Aug 31, 2026
FELV 0.51% 39,285 $ 16.315M Jun 30, 2026
HEQQ 0.50% 280 $ 147.322K Nov 17, 2026
FMDE 0.46% 82,610 $ 34.307M Jun 30, 2026
SFGV 0.46% 10,196 $ 5.36M Nov 18, 2026
BTAL 0.45% 3,036 $ 1.261M Jun 30, 2026
FELG 0.42% 57,064 $ 23.698M Jun 30, 2026
SEIQ 0.41% 6,552 $ 2.721M Jun 30, 2026
FHEQ 0.41% 8,734 $ 3.806M Jul 31, 2026
VUS 0.41% 168 $ 73.206K Jul 31, 2026
CLSE short -0.37% -6,933 $ -3.365M Aug 31, 2026
FELC 0.36% 68,120 $ 28.29M Jun 30, 2026
FYEE 0.36% 1,782 $ 776.507K Jul 31, 2026
BAMG 0.35% 922 $ 447.447K Aug 31, 2026
YOKE 0.31% 1,299 $ 680K Nov 18, 2026
THEQ 0.30% 207 $ 110.573K Nov 17, 2026
TVAL 0.29% 6,261 $ 3.344M Nov 17, 2026
CDX 0.28% 1,298.7834 $ 683.355K Nov 17, 2026
TACU 0.27% 92 $ 49.144K Nov 17, 2026
MSLC 0.27% 22,400 $ 10.871M Aug 31, 2026
REGS 0.26% 410 $ 170.269K Jun 30, 2026
ENHU 0.25% 43 $ 22.969K Nov 16, 2026
GEW 0.24% 703 $ 341.166K Aug 31, 2026
DXUV 0.23% 26,726 $ 14.175M Nov 12, 2026
ACIO 0.22% 11,645 $ 5.074M Jul 31, 2026
ADME 0.21% 1,415 $ 616.586K Jul 31, 2026
XMAG 0.21% 834 $ 442.354K Nov 13, 2026
LCDS 0.19% 56 $ 29.464K Nov 17, 2026
DFVX 0.19% 2,013 $ 1.068M Nov 12, 2026
JOYT 0.18% 415 $ 218.352K Nov 17, 2026
AVUQ 0.17% 1,370 $ 731.813K Nov 16, 2026
BALI 0.17% 4,966 $ 2.653M Nov 16, 2026
INRO 0.17% 1,927 $ 1.029M Nov 16, 2026
DFSU 0.17% 7,636 $ 4.05M Nov 12, 2026
DFAU 0.17% 40,674 $ 21.573M Nov 12, 2026
LGDX 0.16% 420 $ 224.351K Nov 17, 2026
AAUS 0.16% 1,574 $ 830K Nov 18, 2026
SFTY 0.15% 2,510 $ 1.218M Aug 31, 2026
STOX 0.15% 711 $ 345.048K Aug 31, 2026
DFAC 0.15% 250,732 $ 132.988M Nov 12, 2026
TRUT 0.15% 853 $ 380.412K Sep 30, 2026
JUSA 0.14% 2,247 $ 1.182M Nov 17, 2026
AVLC 0.13% 3,734 $ 1.995M Nov 16, 2026
JFLI 0.13% 118 $ 62.086K Nov 17, 2026
DFUS 0.13% 52,131 $ 27.65M Nov 12, 2026
IQSZ 0.12% 492 $ 214.389K Jul 31, 2026
LCTU 0.12% 2,454 $ 1.311M Nov 16, 2026
NBCR 0.12% 2,040 $ 990.012K Aug 31, 2026
VOXP 0.11% 15 $ 6,536.25 Jul 31, 2026
DCOR 0.11% 95,718 $ 50.769M Nov 12, 2026
AVUS 0.11% 30,937 $ 16.526M Nov 16, 2026
THRO 0.11% 21,976 $ 11.739M Nov 16, 2026
GDE 0.10% 1,029 $ 499.374K Aug 31, 2026
NTSX 0.10% 3,235 $ 1.343M Jun 30, 2026
AVSU 0.09% 819 $ 437.485K Nov 16, 2026
HCMT 0.09% 1,155 $ 503.291K Jul 31, 2026
MODL 0.09% 2,196 $ 911.977K Jun 30, 2026
NTSD 0.08% 68 $ 28.24K Jun 30, 2026
EBI 0.08% 1,098 $ 532.859K Aug 31, 2026
APUE 0.07% 3,643 $ 1.768M Aug 31, 2026
CSHP 0.05% 343 $ 183.22K Nov 16, 2026
IDEF 0.05% 2,575 $ 1.375M Nov 16, 2026
GSPY 0.04% 528 $ 282.042K Nov 17, 2026
ACGR 0.00% 107 $ 51.927K Aug 31, 2026