Skip to main content Ehren Powell, Chief Digital Officer, Marathon Petroleum, received the Leadership ORBIE and delivered an acceptance speech that acknowledged the efforts of the company’s Digital team. Key Points Ehren Powell received the 2026…
Skip to main content
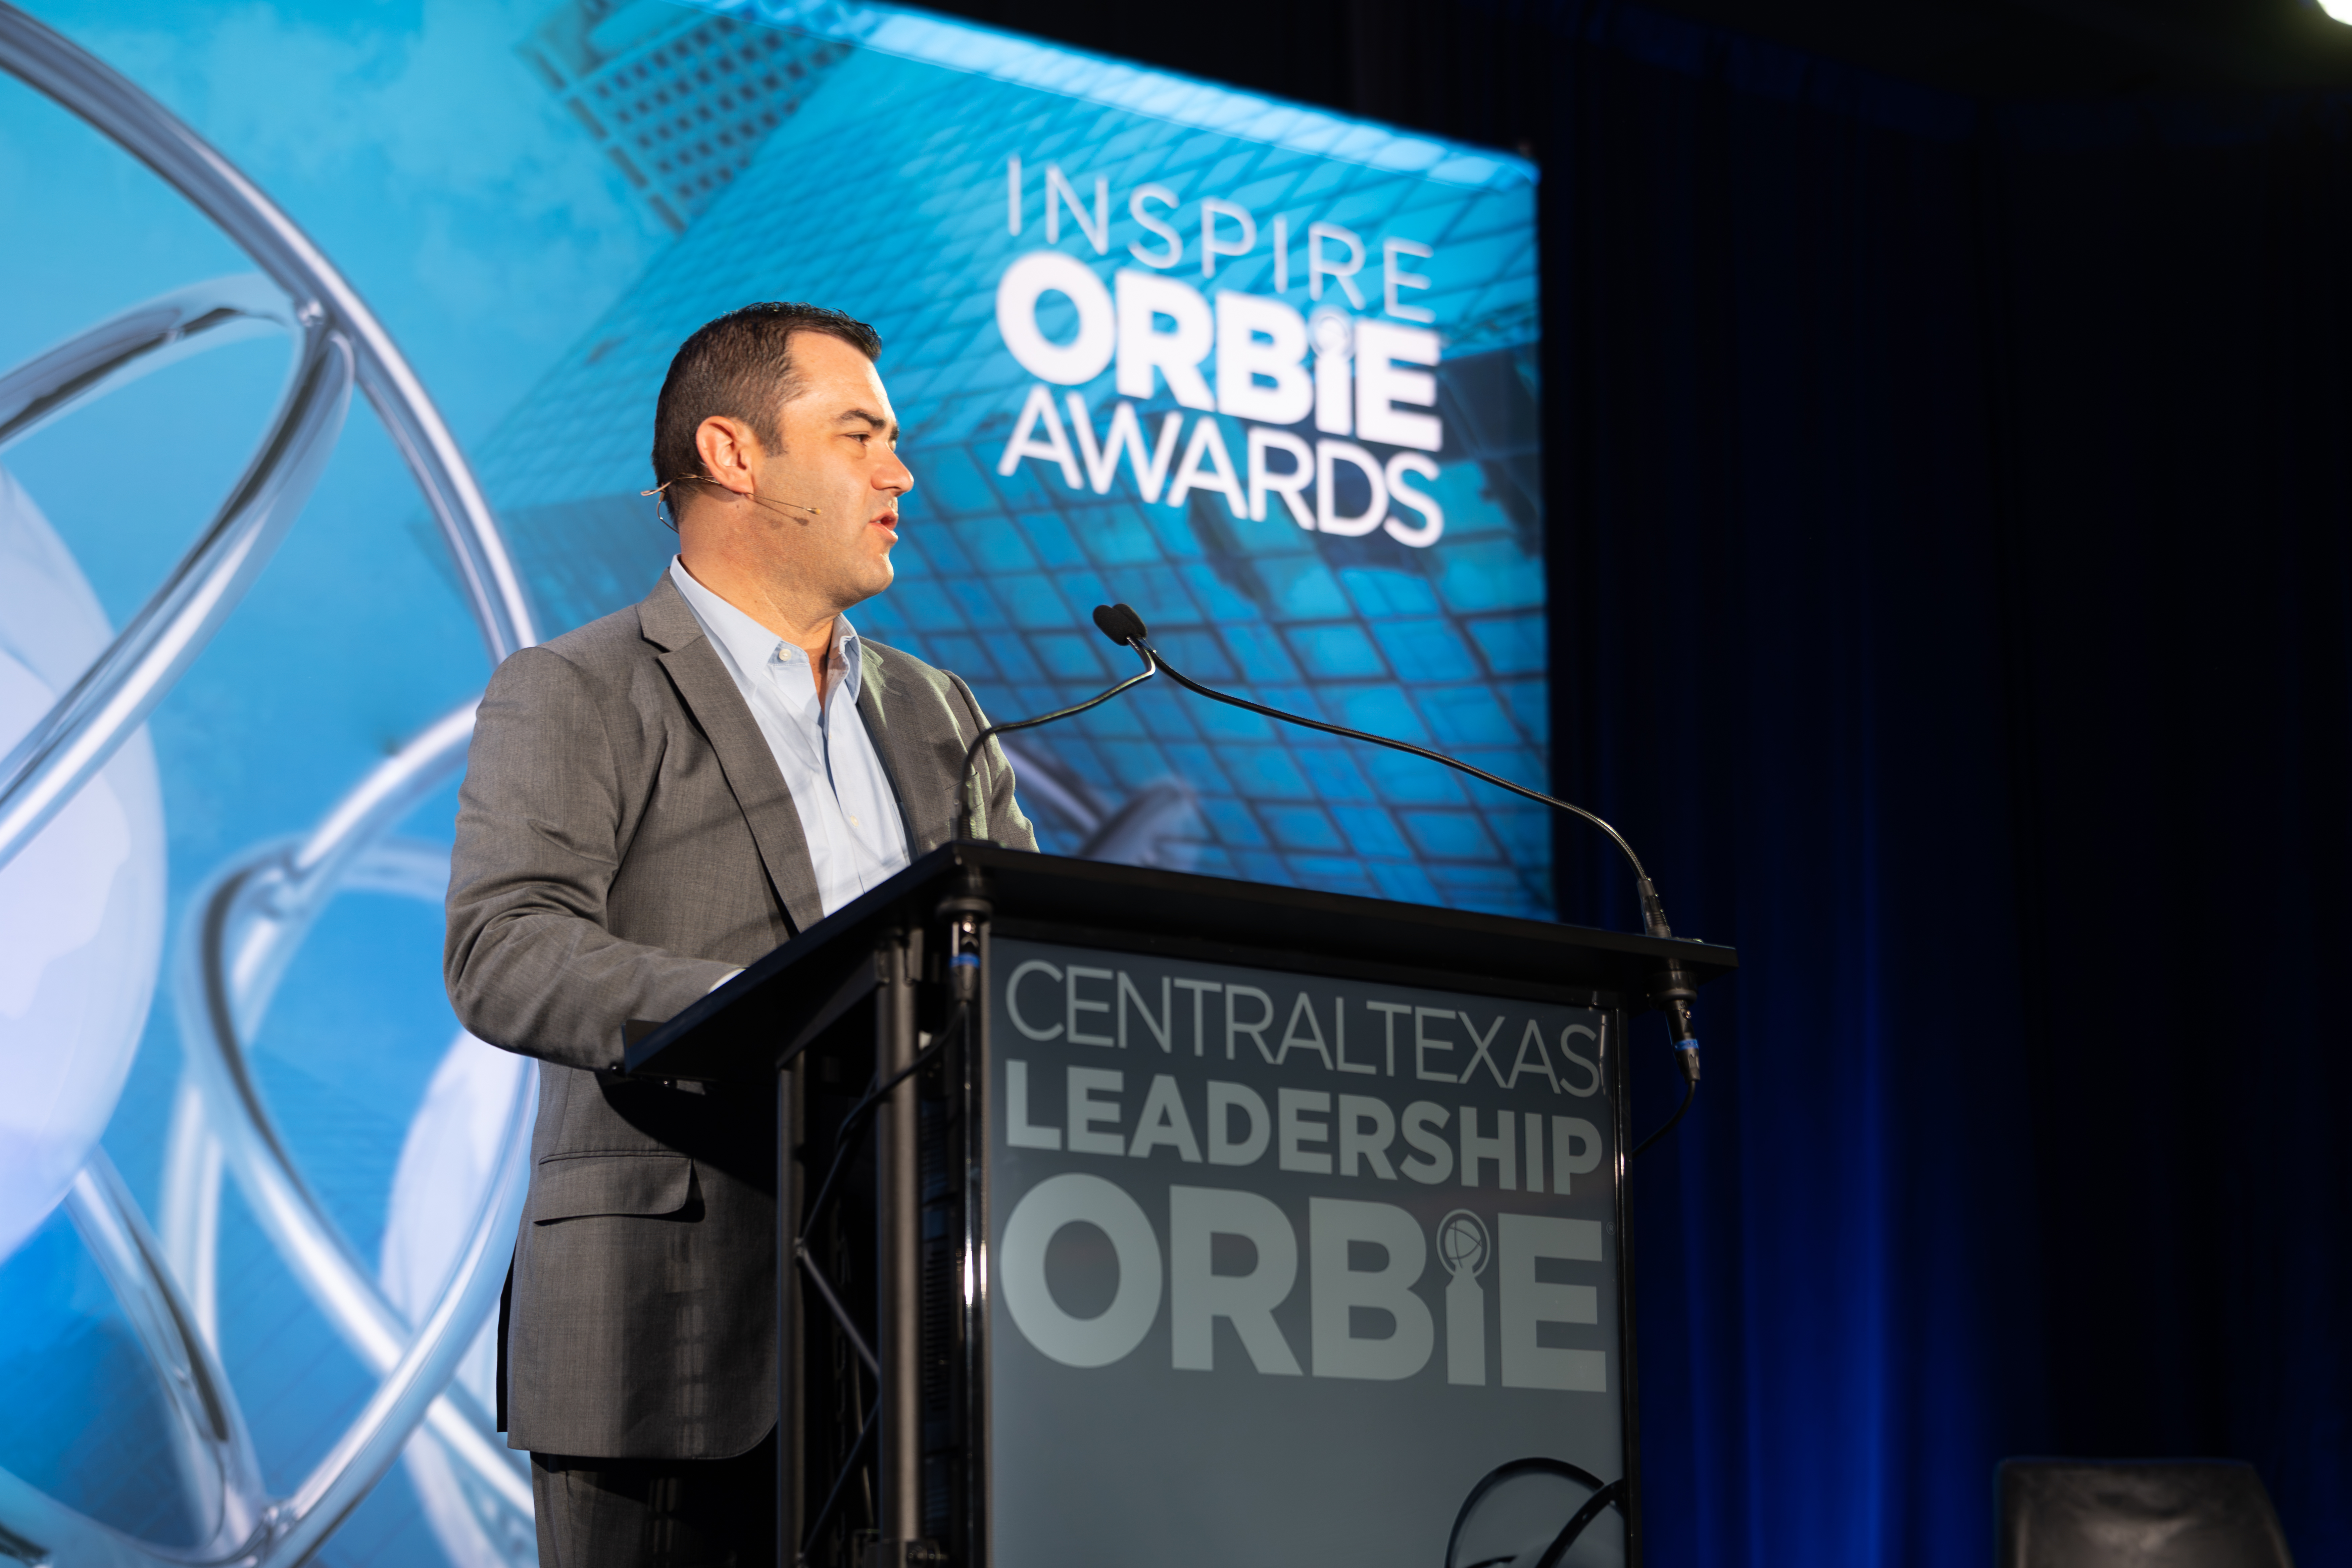
Ehren Powell, Chief Digital Officer, Marathon Petroleum, received the Leadership ORBIE and delivered an acceptance speech that acknowledged the efforts of the company’s Digital team.
Key Points
-
Ehren Powell received the 2026 Central Texas ORBIE Leadership Award for advancing digital leadership, innovation and business impact at Marathon Petroleum.
-
His leadership approach centers on encouraging teams to solve meaningful business problems, embed technology and data into decision-making, and help the company operate with greater agility, reliability and value.
-
Powell views the recognition as a reflection of the broader Digital team and its business partners, whose work has strengthened collaboration and positioned Marathon Petroleum for continued progress.
Marathon Petroleum’s Chief Digital Officer, Ehren Powell, was honored for his efforts in putting technology and data at the center of business decisions and for building teams equipped to solve the problems that matter most.
When Powell looks back on his career, he focuses on the moments when digital and business teams began to collaborate and work differently together. This kind of transformation, moving technology from a support function to a critical capability that helps shape business outcomes, has defined his six years at Marathon. It is also the foundation of the recognition he received on Aug. 28, when he was named the recipient of the 2026 Central Texas ORBIE Leadership Award.
Presented by Inspire Leadership Network's CentralTexasCIO chapter at the JW Marriott Austin, the ORBIE Awards recognize technology executives for leadership, innovation and business impact. Winners are selected through an independent, peer-adjudicated process led by previous ORBIE recipients. The ORBIE Leadership Award, which is determined by prior ORBIE winners, recognize recipients for their role in leading innovation throughout their entire career and for the impact have had on the community at large.
For Powell, the recognition is meaningful because of what it represents: the collective work of the Digital organization and its business partners across Marathon Petroleum.
“A long time ago, we spent time trying to keep companies running and provide infrastructure that made them more productive. And now we are responsible for reshaping the way we go to market and leading in reimagining the way our companies operate through the lens of digital. That's a pretty big thing to think about and would have been impossible to imagine 10 years ago,” said Powell.

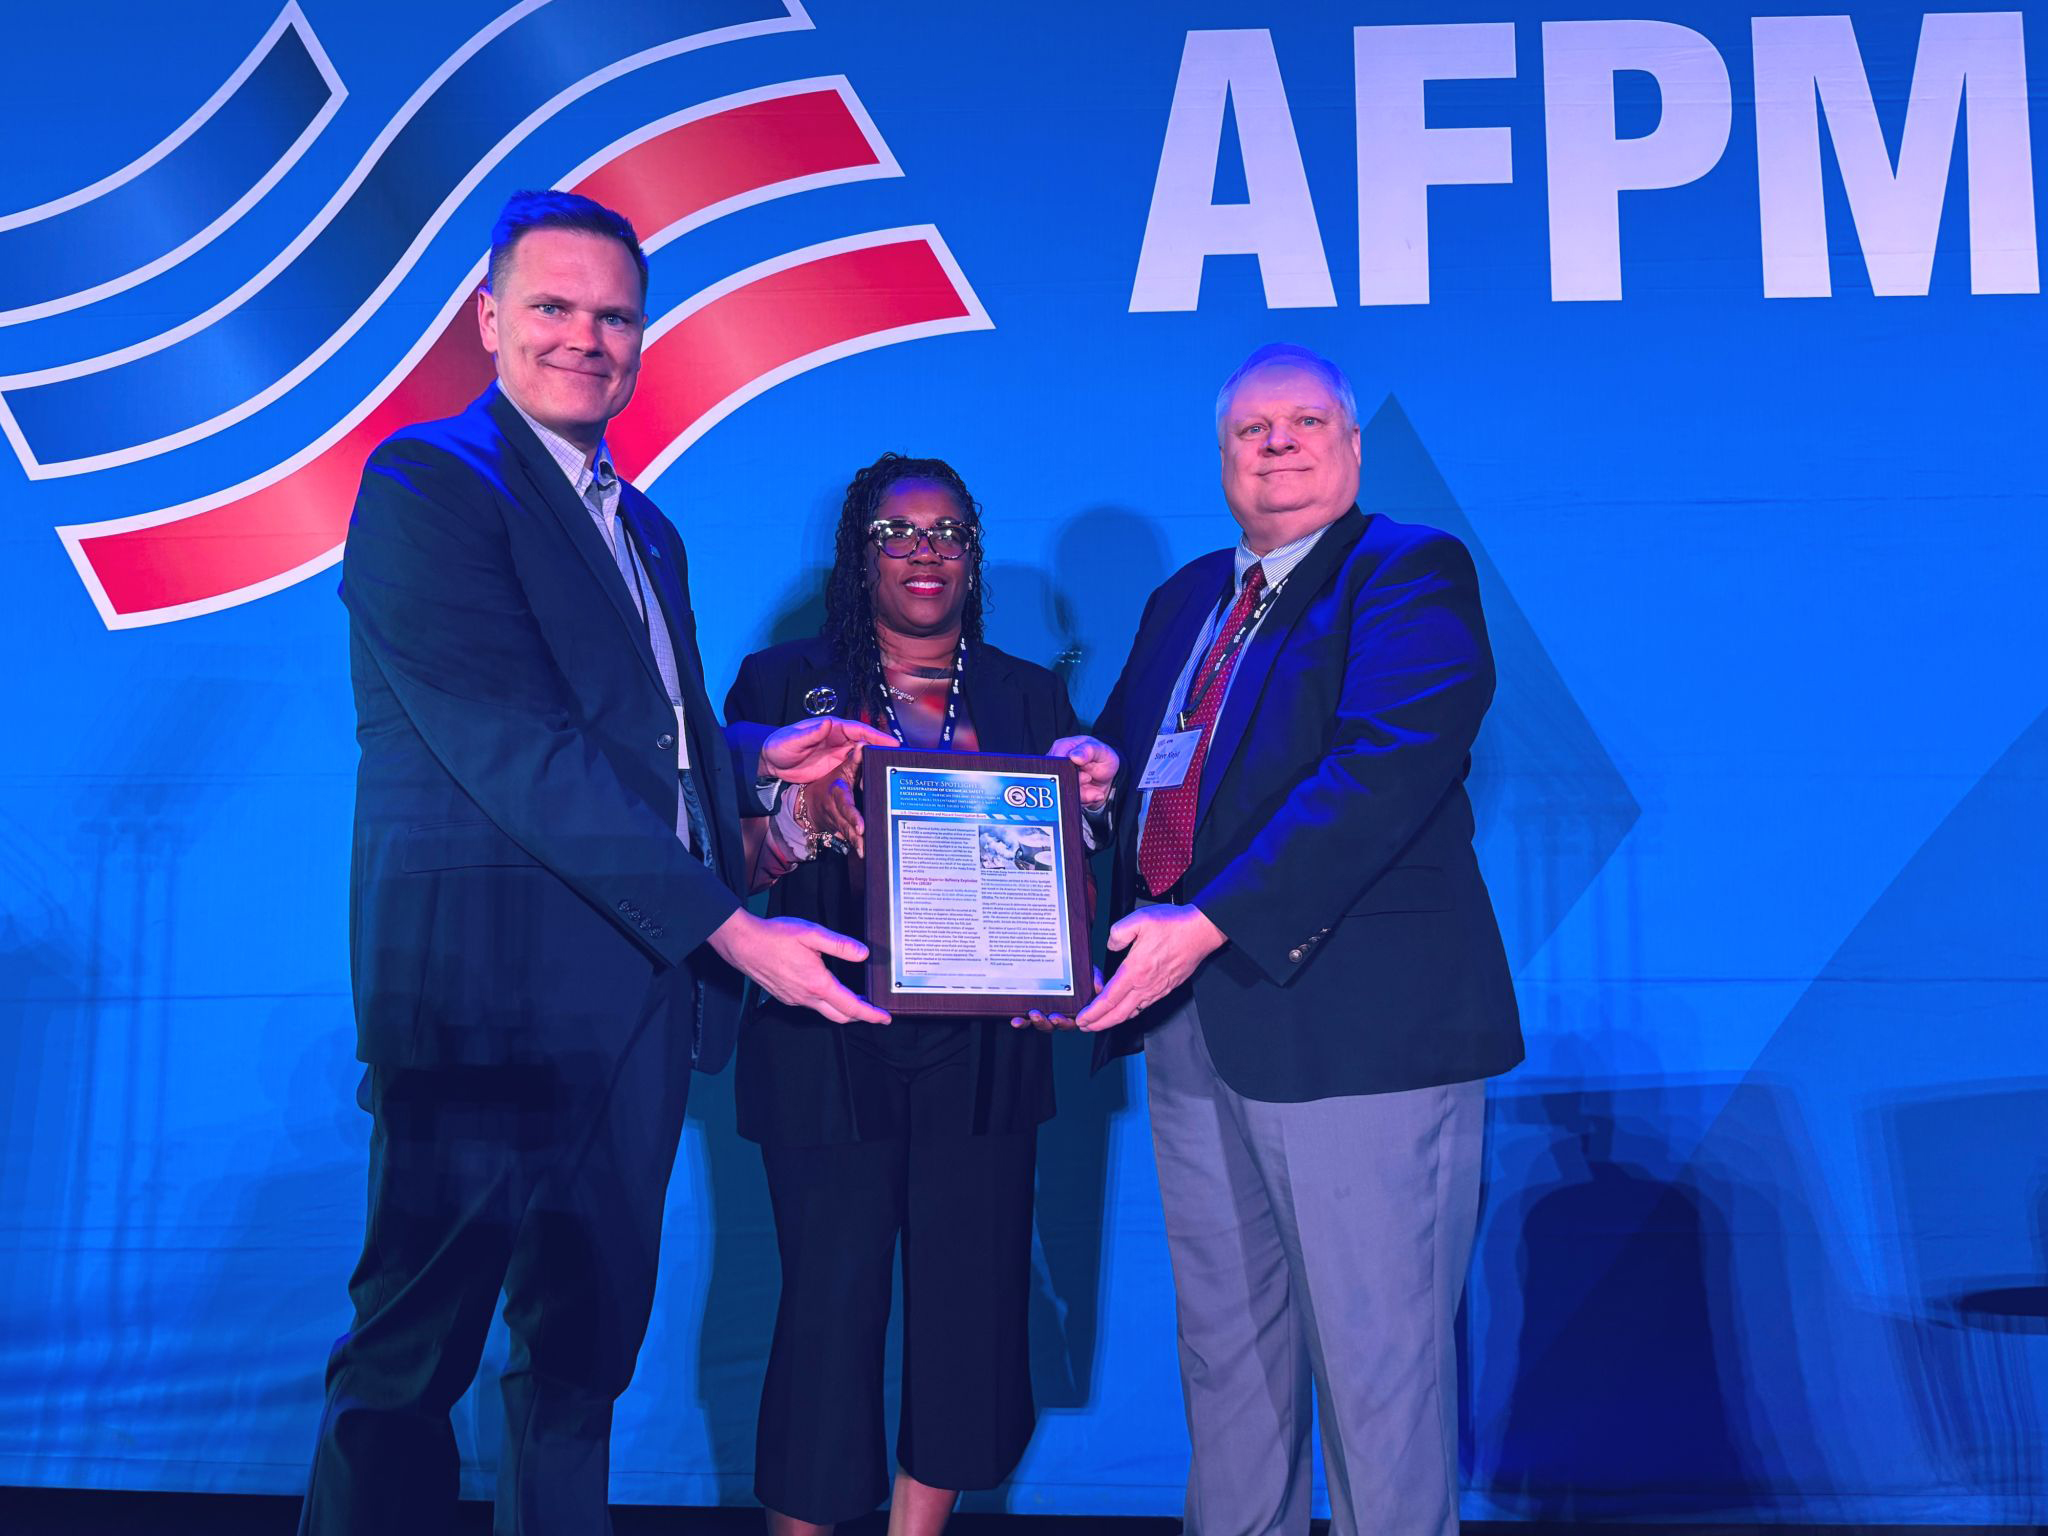
Ehren Powell pictured with Lou Senko, Chief Customer Experience Officer, Q2 during the Central Texas ORBIE Awards ceremony held in Austin, Texas, on Aug. 28.
From technology support to business transformation
As he shared in an interview for a feature story published by Inspire Leadership Network, Powell’s interest in technology emerged during the early days of the internet and online commerce, eventually leading to his first internship. That experience helped establish a philosophy he has carried throughout his career: technology creates its greatest value when it changes how a business operates, solves an important problem or creates a new opportunity.
As shared in a feature video covering Ehren’s background at the ORBIE Awards, after graduating, Ehren took on a variety of roles across a variety of business areas, and those experiences demonstrated how technology could become part of a company’s commercial and operating strategy in addition to a service provided to the business. He brought that perspective to Marathon Petroleum, where he and his teams have spent the past six years working to put digital and data at the center of how the company operates.
Within Marathon Petroleum’s environment, the role of digital is about ensuring safe and reliable operations, enhancing decision-making and collaboration, strengthening resiliency, and creating measurable business value. The investments made in digital have had a material impact on company performance and continue to be a core element of our transformation strategy.
Notably, one of the most significant shifts has been toward championing a value-chain mindset, where teams are moving beyond vertical organizational silos and creating greater collaboration across functions and the enterprise.
“We’ve gone from individual technology initiatives to an increasingly connected digital capability, one that delivers measurable value, improves how we operate, strengthens our safety, resiliency, and reliability, and helps us make better decisions that unlock more value,” Powell shared in a keynote address after receiving his ORBIE Award, where he was interviewed by Lou Senko, Chief Customer Experience Officer (CXO), Q2.
Building a culture for what comes next
Powell’s ORBIE recognition comes at a time when the role of technology leadership is changing rapidly. For digital leaders, the opportunity is to help determine how the business itself evolves. He believes that requires visible leadership and a willingness to challenge conventional thinking.
“Digital leaders need to provide visible leadership from the front,” he said. “They need to have a strong and vocal perspective on how technology can disrupt, enhance, accelerate and change the business.”

The keynote address for the Central Texas ORBIE Awards was delivered by Ehren Powell, Chief Digital Officer, Marathon Petroleum, who was interviewed by Lou Senko, Chief Customer Experience Officer, Q2. Over 250 guests attended, representing leading Central Texas organizations and their technology partners.
At Marathon Petroleum, that means continuing to advance a culture where data and technology inform the company's most important decisions while encouraging continuous improvement and giving talented people the opportunity to do their best work. Powell describes that leadership philosophy in straightforward terms: ask better questions, start with the desired outcomes, help solve problems, create clarity when situations are complicated, set a higher standard and remain relentless in the pursuit of better. And importantly, give people the space to lead.
We are responsible for reshaping the way we go to market and leading in reimagining the way our companies operate through the lens of digital. That's a pretty big thing to think about and would have been impossible to imagine 10 years ago.”
Collective recognition of the Digital team
Although the ORBIE Leadership Award bears his name, he views it instead as recognition of the substantial ways that Digital teams have risen to the occasion to help drive business outcomes and ensure safe and reliable operations.
“Expectations of our function have changed, and we've gone from a measure of stability to identifying new ways to take our companies to market, to help them expand margins, to grow our profitability, improve our commercial performance, and […] work on improving our safe and reliable operations, because at the end of the day, when you work in these environments, it's very important that our colleagues go home safely,” he said in his acceptance speech.
That emphasis on the Digital team was consistent throughout the ceremony. He credits them and their engaged business partners with turning an aspiration for digital transformation into tangible progress, and he sees the award as a reflection of the quality of work happening throughout the company. He also views the recognition as a marker of progress for what’s next.
“I’m proud of what we’ve accomplished so far at Marathon, and I’m even more excited about what’s yet to come.”
For a leader who measures his career by the moments when businesses begin to operate differently, that may be the most fitting perspective of all. The award recognizes what the Digital team has accomplished, and the real measure of Powell’s digital leadership will continue to be what Marathon is able to accomplish in the future.

Privacy Preference Center
When you visit any website, it may store or retrieve information on your browser, mostly in the form of cookies. This information might be about you, your preferences, or your device, and is mostly used to make the site work as you expect. The information does not usually identify you directly, but it can give you a more personalized web experience. Because we respect your right to privacy, you can choose not to allow some types of cookies. Click on the different category headings to learn more and change our default settings. Blocking some types of cookies may impact your experience of the site and the services we are able to offer.
More information
Allow All
Manage Consent Preferences
Strictly Necessary Cookies
Always Active
These cookies are necessary for the website to function and cannot be switched off in our systems. They are usually only set in response to actions made by you which amount to a request for services, such as setting your privacy preferences, logging in or filling in forms. You can set your browser to block or alert you about these cookies, but some parts of the site will not then work. These cookies do not store any personally identifiable information.
Functional Cookies
Functional Cookies
These cookies enable the website to provide enhanced functionality and personalisation. They may be set by us or by third party providers whose services we have added to our pages. If you do not allow these cookies then some or all of these services may not function properly.
Performance Cookies
Performance Cookies
These cookies allow us to count visits and traffic sources so we can measure and improve the performance of our site. They help us to know which pages are the most and least popular and see how visitors move around the site. All information these cookies collect is aggregated and therefore anonymous. If you do not allow these cookies we will not know when you have visited our site, and will not be able to monitor its performance.
Targeting Cookies
Targeting Cookies
These cookies may be set through our site by our advertising partners. They may be used by those companies to build a profile of your interests and show you relevant adverts on other sites. They do not store directly personal information, but are based on uniquely identifying your browser and internet device. If you do not allow these cookies, you will experience less targeted advertising.
Cookie List
Clear
Apply Cancel
Leg.Interest
checkbox label label
checkbox label label
checkbox label label
Reject All

 View original content:










 Key Points



 Key Points

 |
 | | |


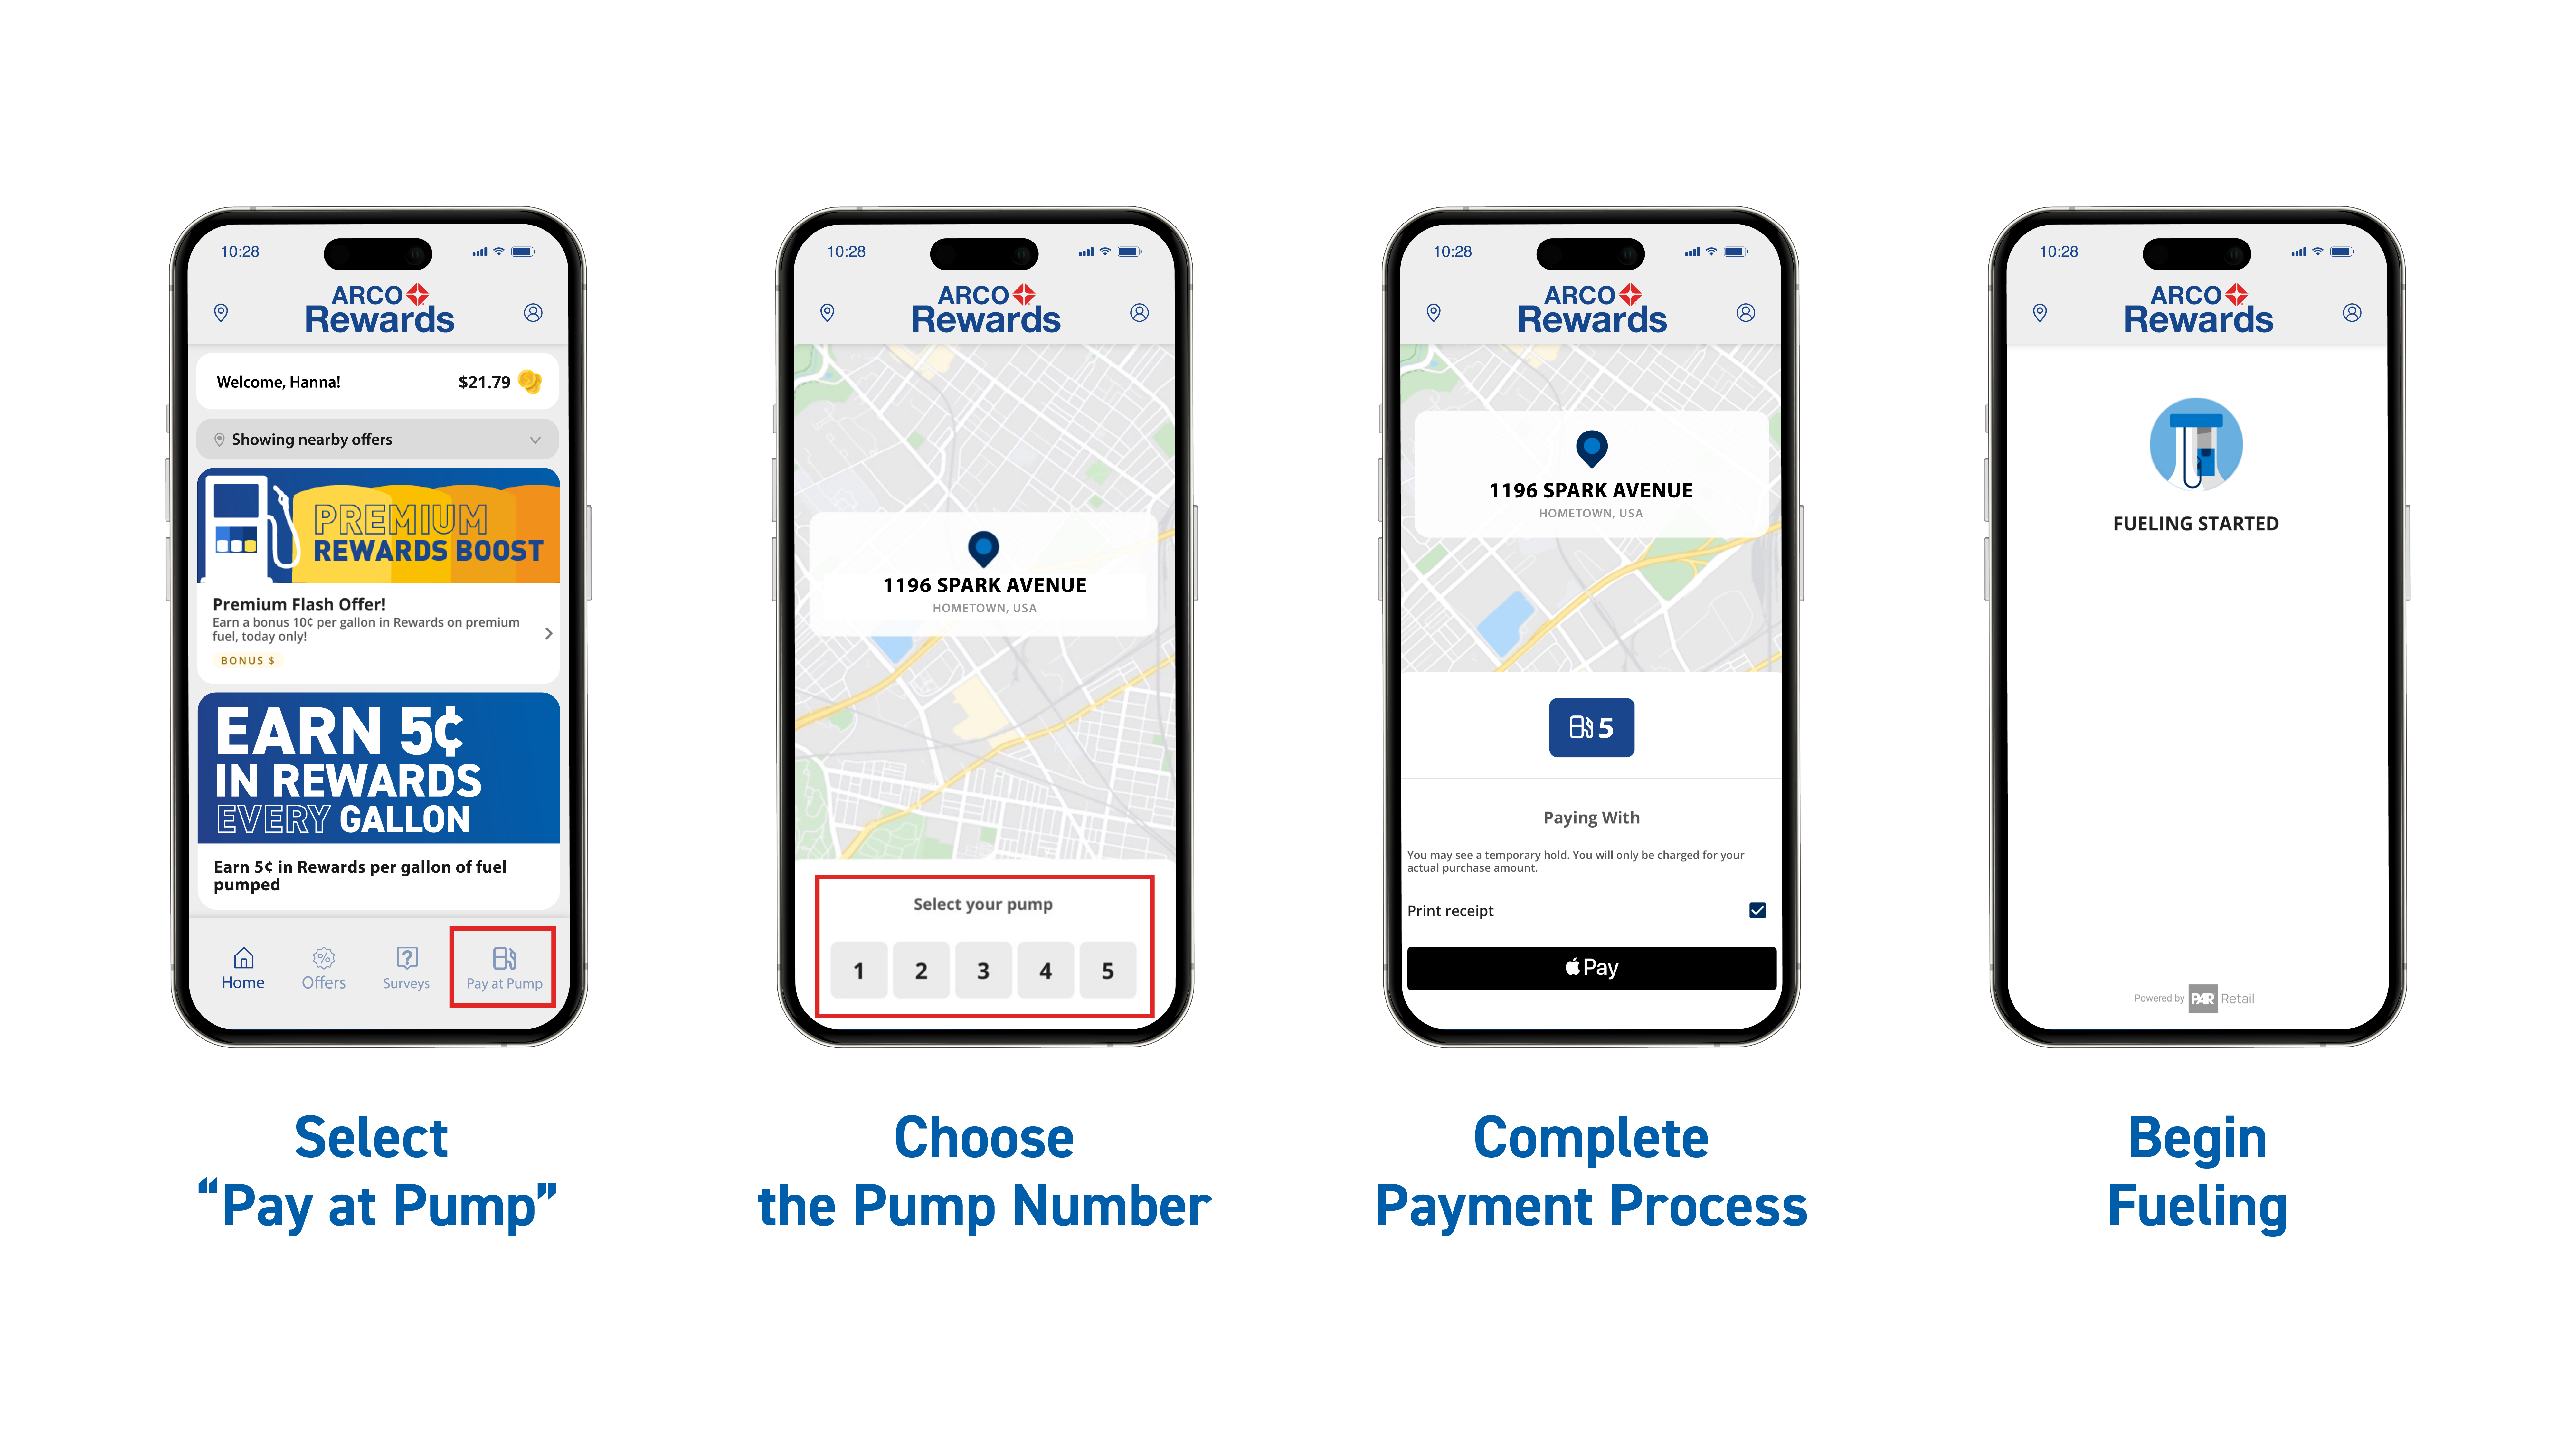 Not a Rewards member yet? Start earning at participating Marathon and ARCO locations today by downloading the Marathon Rewards or ARCO Rewards app.
















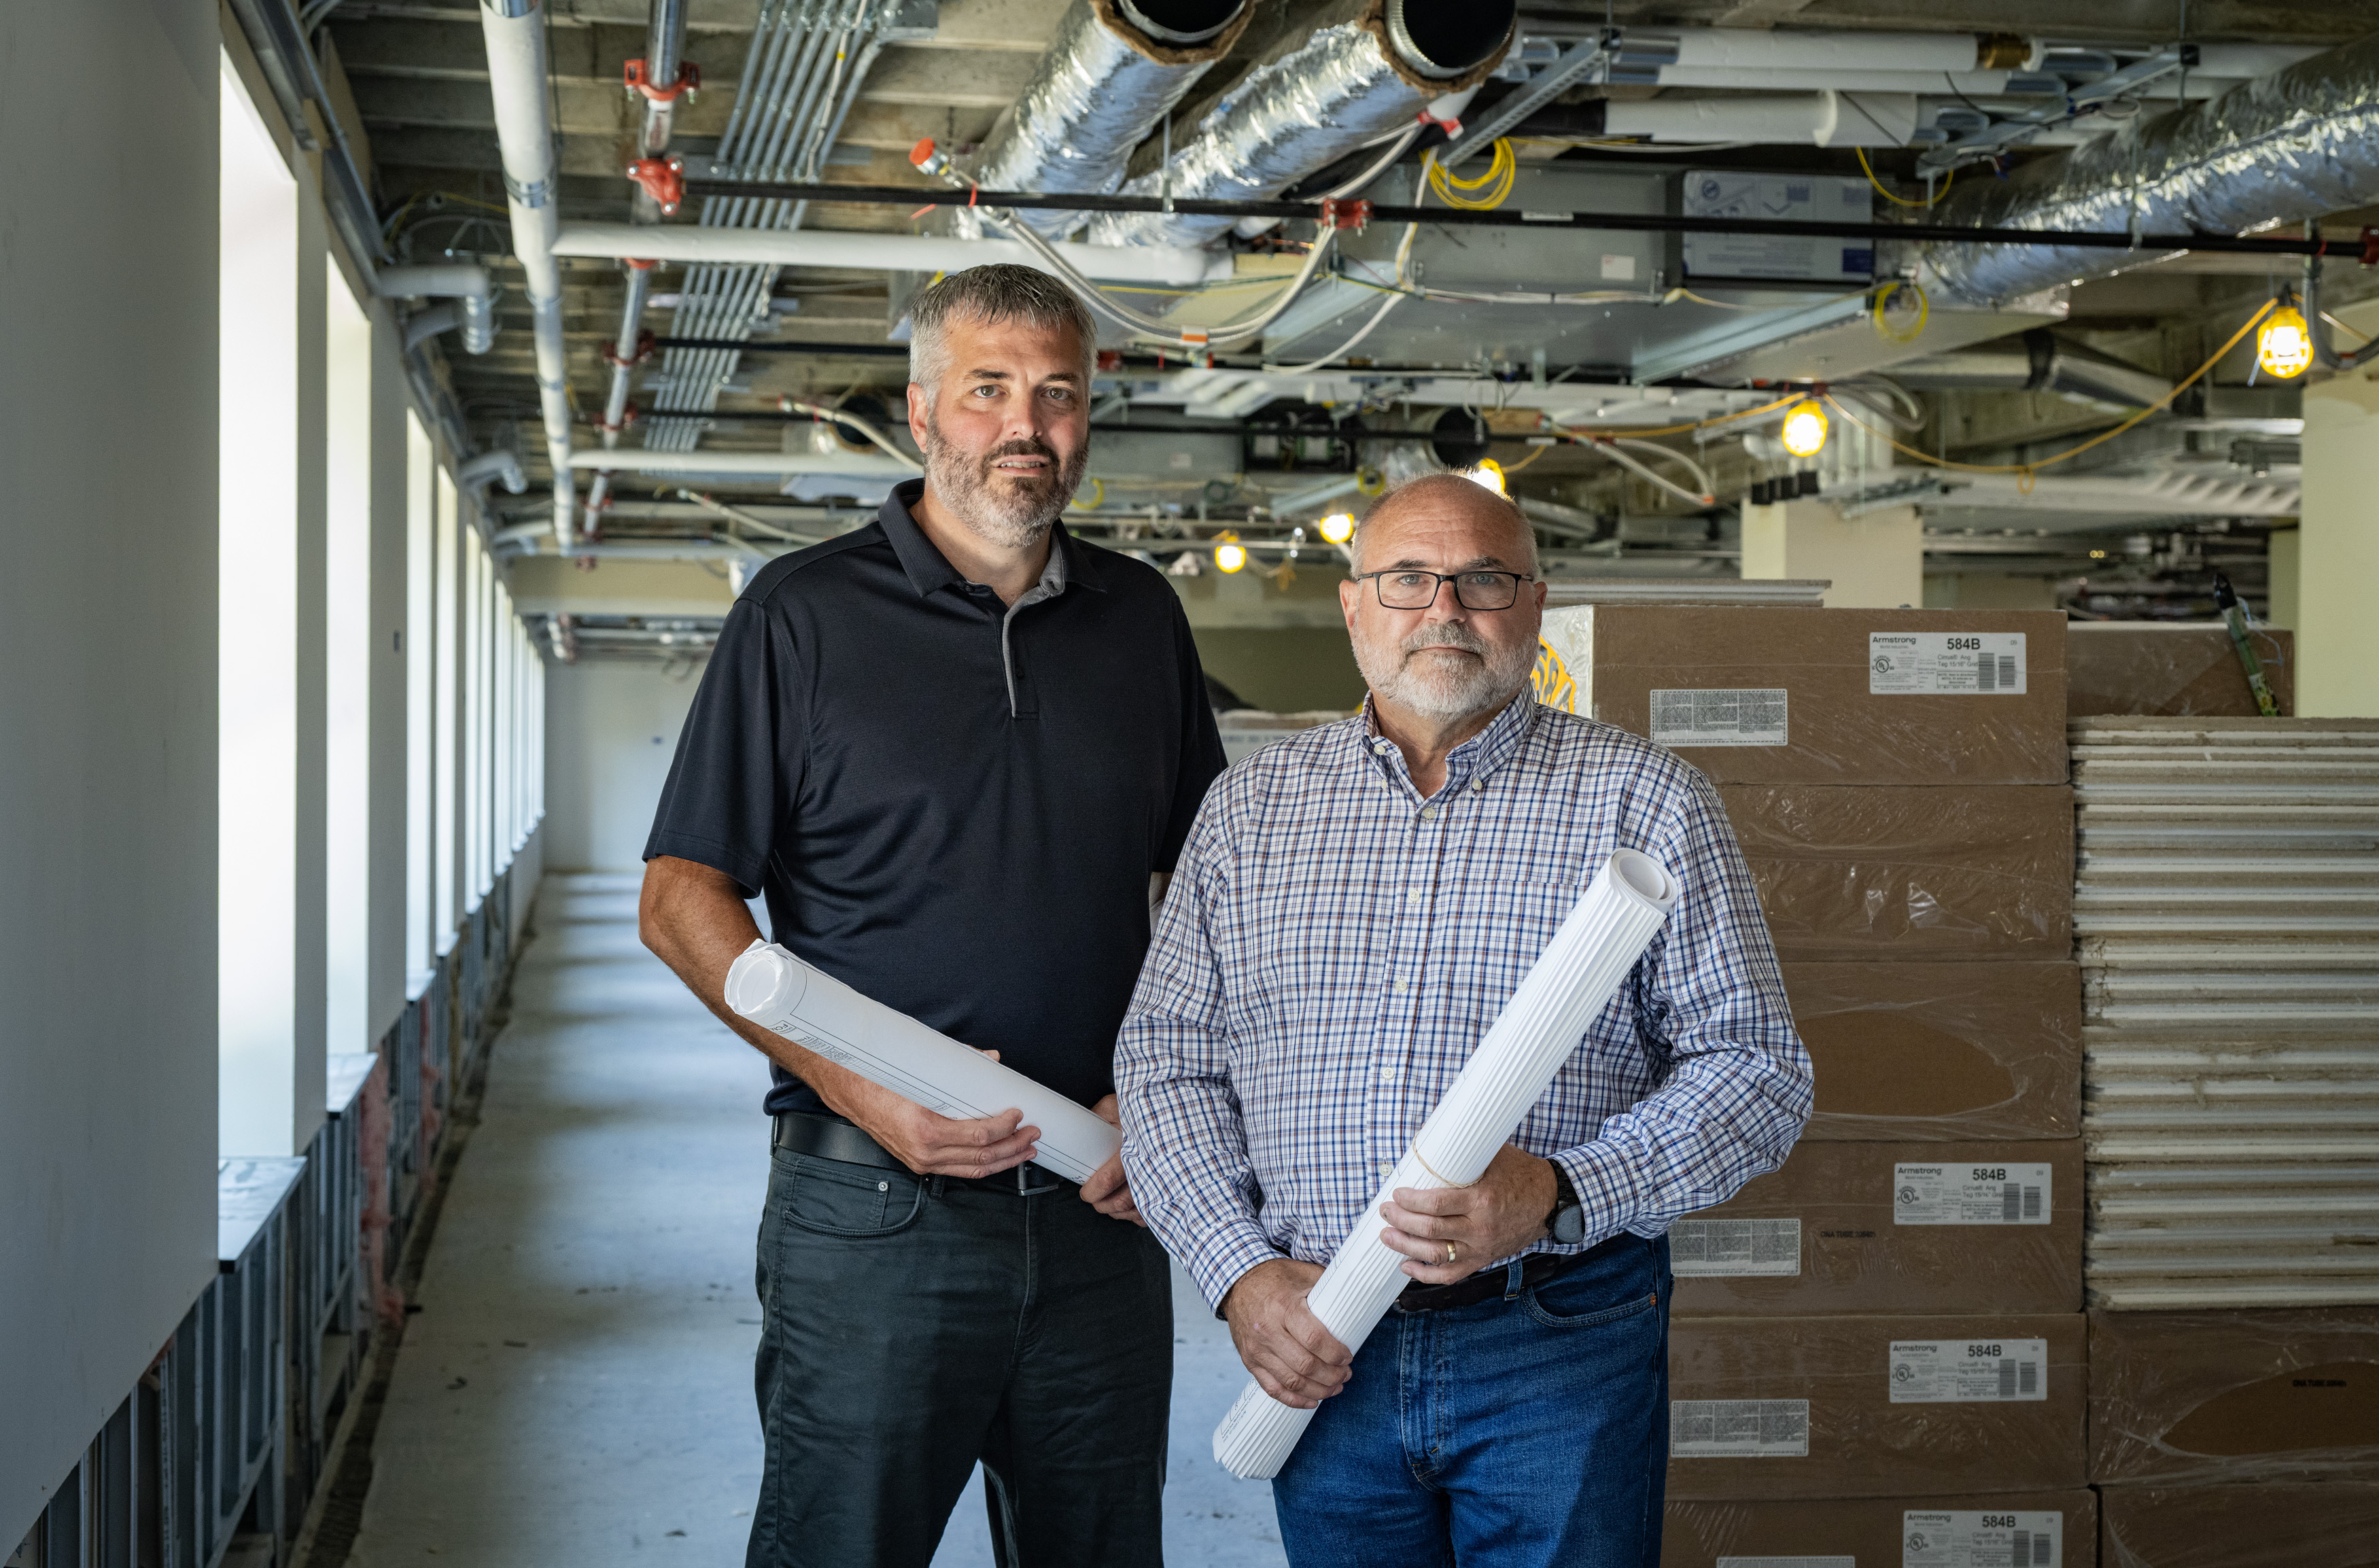

 On average, ENERGY STAR-certified properties, such as Marathon Petroleum’s campus headquarters in Findlay, Ohio, generate 35 percent fewer greenhouse gas emissions than typical, non-certified buildings. |
 Ongoing efficiency improvements have included replacing lighting, windows and entire HVAC systems, which involved temporarily relocating almost all 2,300 employees in phases over time. |
 View original content:



 Tallant with his wife of 23 years, Renea, who he says is his biggest supporter. |
 When he’s not behind the wheel of his transport truck, you can find Tallant outdoors, traveling with family and likely camping or fishing. |