November 04, 2026
HOUSTON--(BUSINESS WIRE)-- Magnolia Oil & Gas Corporation (“Magnolia,” “we,” “our,” or the “Company”) (NYSE: MGY) today announced its financial and operational results for the third quarter of 2026.
| Third Quarter 2026 Highlights: | ||||||||
| (In millions, except per share data) | For the Quarter Ended September 30, 2026 | For the Quarter Ended September 30, 2025 | Percentage increase (decrease) | |||||
| Net income | $ | 80.5 | $ | 78.2 | 3 | % | ||
| Adjusted net income(1) | $ | 166.3 | $ | 77.8 | 114 | % | ||
| Earnings per share - diluted | $ | 0.35 | $ | 0.40 | (13 | )% | ||
| Adjusted EBITDAX(1) | $ | 392.0 | $ | 218.8 | 79 | % | ||
| Capital expenditures - D&C | $ | 147.4 | $ | 118.4 | 24 | % | ||
| Average daily production (Mboe/d) | 117.3 | 100.5 | 17 | % | ||||
| Average daily oil production (Mbbls/d) | 49.1 | 39.4 | 24 | % | ||||
| Diluted weighted average total shares outstanding(2) | 230.6 | 190.3 | 21 | % |
- Magnolia reported third quarter 2026 net income of $80.5 million, or $0.35 per diluted share. Third quarter 2026 adjusted net income (1) was $166.3 million, or $0.71 per diluted share. Adjusted net income, which increased by 114% compared to the same prior-year period, excludes special items consisting primarily of transaction and integration costs related to the acquisition of WildFire Energy that closed in the third quarter, and net unrealized losses on derivative contracts.
- Adjusted EBITDAX (1) was $392.0 million during the third quarter of 2026. Total drilling and completions (“D&C”) capital was $147.4 million for the third quarter and below our earlier guidance, representing approximately 38% of adjusted EBITDAX.
- Net cash provided by operating activities was $369.0 million during the third quarter of 2026 with adjusted free cash flow(1) generated by the Company of $223.7 million. Magnolia generated adjusted operating income as a percentage of revenue (1) (pre-tax margins) of 43% during the third quarter.
- Total Company production volumes in the third quarter of 2026 grew by 17% on a year-over-year basis to 117.3 thousand barrels of oil equivalent per day (“Mboe/d”) and included 49.1 thousand barrels of oil per day (“Mbbls/d”) which grew by 24% compared to the prior year period. Total production in Giddings increased 23% year-over-year to 97.7 Mboe/d with oil volumes growing by 39%.
- The Company repurchased 2.3 million shares of its Class A Common Stock during the third quarter for $60.2 million. Magnolia’s Board of Directors has increased the existing share repurchase authorization by an additional 15 million shares, bringing the total remaining authorization to 22.6 million shares of Class A Common Stock.
- As previously announced, Magnolia’s Board of Directors declared a quarterly cash dividend of $0.18 per share, payable on December 1, 2026, to shareholders of record as of November 10, 2026.
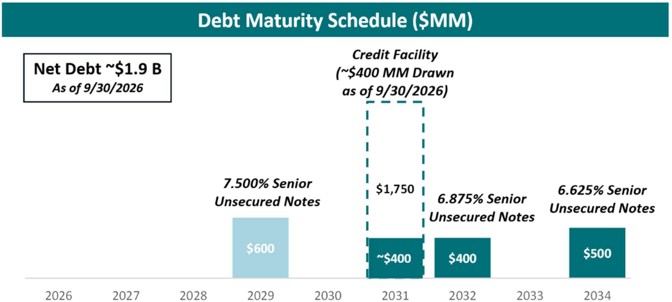
- Magnolia returned $103.3 million, or 46% of the Company’s adjusted free cash flow(1), to shareholders during the third quarter through a combination of share repurchases and dividends. Magnolia ended the third quarter with $17.5 million of cash on the balance sheet and $435 million in outstanding borrowings on its revolving credit facility.
“Magnolia continues to execute at a high level as we successfully integrate the WildFire assets,” said Magnolia’s Chairman, President and CEO Chris Stavros. “Although our third quarter results include only a partial period of ownership following the September closing, the benefits of the combined asset base are already clearly evident. Our business generated $224 million of adjusted free cash flow during the quarter, with a reinvestment rate of just 38 percent of adjusted EBITDAX. That strong momentum has carried into the fourth quarter – our first full quarter as a combined company.
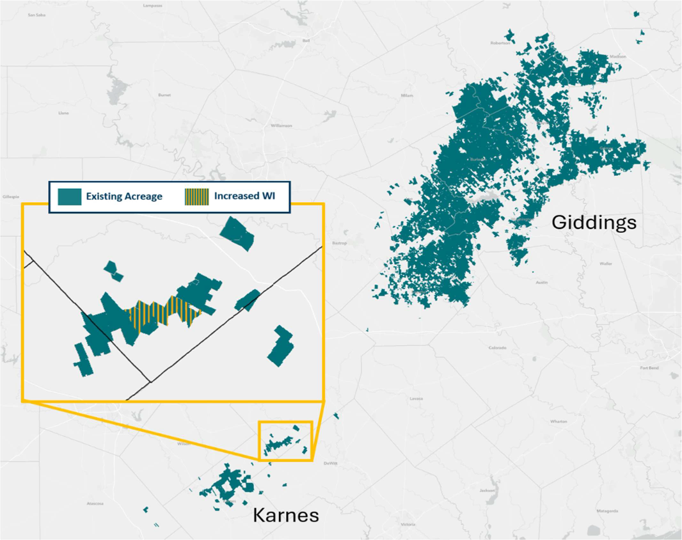
“The integration continues to progress smoothly, and we are meeting all our planned milestones. Synergy capture remains ahead of our expectations, with more than one-third of the anticipated annual synergies on track to be realized by year-end. We are currently running four rigs and two completion crews, and have recently substituted some equipment in an effort to capture further operational and capital efficiencies. Recent Austin Chalk well results on WildFire operated acreage are encouraging and are supportive of our geological model that led to Magnolia’s strong Austin Chalk development plan over the last several years. These early results also suggest greater inventory potential than our earlier baseline acquisition analysis. We plan to continue to delineate the Austin Chalk across our now 1.25 million net acre position in Giddings and our 2027 company-wide drilling program is expected to allocate approximately 65 percent of targeted activity to the Austin Chalk and 35 percent to the Eagle Ford.
“Supported by these strong operational and financial results, Magnolia returned approximately $103 million to shareholders during the quarter through our dividend and share repurchase program, while reducing net debt to approximately $1.9 billion. We achieved our goal of less than 1.0x net debt to forecasted EBITDAX more than a year sooner than originally planned when we announced the WildFire acquisition. The significant free cash flow generation allows us to continue aggressively reducing leverage, while consistently paying and growing our dividend, and maintaining our peer-leading program of repurchasing at least 1 percent of shares outstanding each quarter. Magnolia’s Board has increased our share repurchase authorization by an incremental 15 million shares, bringing the remaining authorization to 22.6 million shares – or nearly 8.5 percent of current shares outstanding – providing us the flexibility to lean into additional repurchases above the 1 percent level opportunistically and when warranted.”
Operational Update
Total Company production volumes in the third quarter of 2026 grew by 17 percent on a year-over-year basis to 117.3 Mboe/d including 49.1 Mbbls/d. Total production in Giddings increased by 23 percent in the third quarter, compared to the prior year period with Giddings oil production growing by 39 percent year-over-year. Giddings production represented 83 percent of total Company volumes during the third quarter. The Company’s third quarter oil production mix represented approximately 42 percent of total volumes, including only a partial period of WildFire ownership, and is expected to rise to 49 to 50 percent of total production in the fourth quarter. Magnolia’s third quarter 2026 capital spending on drilling, completions, and associated facilities was $147.4 million.
Additional Guidance
Fourth quarter 2026 D&C capital spending is estimated to be roughly $235 million. Total production for the fourth quarter is expected to be 159 to 161 Mboe/d (49% to 50% oil).
2027 production is estimated to grow 4 to 5 percent for both oil and total production off a second quarter 2026 pro forma production base of approximately 78 Mbbls/d and 158 Mboe/d after accounting for the production volumes from the non-core asset sale in the third quarter. D&C capital spending is currently estimated to be in the range of $900 to $950 million during 2027 which incorporates a modest amount of oil field service inflation.
Magnolia has provided guidance for the fourth quarter of 2026 (the first full quarter pro forma for the acquisition) for several financial and operating metrics in the table below.
| Financial and Operating Metric | Q4 2026 Guidance | |
| Production (Mboe/d) | 159 - 161 | |
| Oil Percent (%) | 49% - 50% | |
| D&C Capital Spending ($ millions) | ~$235 | |
| LOE (per Boe) | $5.80 - $6.20 | |
| GTP (per Boe) | $1.80 - $2.10 | |
| DD&A (per Boe) | $14.00 - $15.00 | |
| Production and Ad Valorem Taxes (%) | 5.5% - 6.5% | |
| Interest Expense ($ millions) | $35 - $40 | |
| Effective Tax Rate | ~21% | |
| Cash Tax Rate | 0% - 2% | |
| Pre-Hedge Oil Realization (to MEH) | $(2.00) |
Quarterly Report on Form 10-Q
Magnolia's financial statements and related notes will be available in its Quarterly Report on Form 10-Q for the three months ended September 30, 2026, which is expected to be filed with the U.S. Securities and Exchange Commission (“SEC”) on November 5, 2026.
Conference Call and Webcast
Magnolia will host an investor conference call on Thursday, November 5, 2026, at 10:00 a.m. Central (11:00 a.m. Eastern) to discuss these operating and financial results. Interested parties may join the webcast by visiting Magnolia's website at www.magnoliaoilgas.com/investors/events-and-presentations and clicking on the webcast link or by dialing 1-844-701-1059. A replay of the webcast will be posted on Magnolia's website following completion of the call.
About Magnolia Oil & Gas Corporation
Magnolia (MGY) is a publicly traded oil and gas exploration and production company with operations primarily in South Texas in the core of the Eagle Ford Shale and Austin Chalk formations. Magnolia focuses on generating value for shareholders by delivering steady, moderate annual production growth resulting from its disciplined and efficient philosophy toward capital spending. The Company strives to generate high pre-tax margins and consistent free cash flow allowing for strong cash returns to our shareholders. For more information, visit www.magnoliaoilgas.com .
| (1) Adjusted net income, adjusted earnings per share, adjusted EBITDAX, net debt, adjusted operating income margin, and adjusted free cash flow are non-GAAP financial measures. For reconciliations to the most comparable GAAP measures, please see “Non-GAAP Financial Measures” at the end of this press release. |
| (2) Weighted average total shares outstanding include diluted weighted average shares of Class A Common Stock outstanding during the period and shares of Class B Common Stock, which are anti-dilutive in the calculation of weighted average number of common shares outstanding. |
Cautionary Note Regarding Forward-Looking Statements
The information in this press release includes forward-looking statements within the meaning of Section 27A of the Securities Act of 1933, as amended, and Section 21E of the Securities Exchange Act of 1934, as amended. All statements, other than statements of present or historical fact included in this press release, regarding the integration of the WildFire Acquisition, the expected synergies of the WildFire Acquisition, Magnolia’s share repurchase program, Magnolia’s strategy, future operations, financial position, estimated revenues and losses, projected costs, prospects, plans and objectives of management are forward-looking statements. When used in this press release, the words could, should, will, may, believe, anticipate, intend, estimate, expect, project, the negative of such terms and other similar expressions are intended to identify forward-looking statements, although not all forward-looking statements contain such identifying words. These forward-looking statements are based on management’s current expectations and assumptions about future events. Except as otherwise required by applicable law, Magnolia disclaims any duty to update any forward-looking statements, all of which are expressly qualified by the statements in this section, to reflect events or circumstances after the date of this press release. Magnolia cautions you that these forward-looking statements are subject to all of the risks and uncertainties, most of which are difficult to predict and many of which are beyond the control of Magnolia, incident to the development, production, gathering and sale of oil, natural gas and natural gas liquids. In addition, Magnolia cautions you that the forward looking statements contained in this press release are subject to the following factors: (i) the integration of the WildFire Acquisition, the results, effects and benefits of the WildFire Acquisition, future opportunities for Magnolia, other plans and expectations with respect to the WildFire Acquisition, and the anticipated impact of the WildFire Acquisition on Magnolia’s results of operations, financial position, growth opportunities and competitive position; (ii) the market prices of oil, natural gas, NGLs, and other products or services; (iii) the supply and demand for oil, natural gas, NGLs, and other products or services, including impacts of actions taken by OPEC and other state-controlled oil companies; (iv) the outcome of any legal proceedings that may be instituted against Magnolia; (v) Magnolia’s ability to realize the anticipated benefits of its acquisitions, which may be affected by, among other things, competition and the ability of Magnolia to grow and manage growth profitably; (vi) legislative, regulatory, or policy changes, including those following the change in presidential administrations; (vii) geopolitical and business conditions in key regions of the world; (viii) cybersecurity threats, including increased use of artificial intelligence technologies; and (ix) the possibility that Magnolia may be adversely affected by other economic, business, and/or competitive factors, including inflation. Should one or more of the risks or uncertainties described in this press release occur, or should underlying assumptions prove incorrect, actual results and plans could differ materially from those expressed in any forward-looking statements. Additional information concerning these and other factors that may impact the operations and projections discussed herein can be found in Magnolia’s filings with the SEC, including its Annual Report on Form 10-K for the fiscal year ended December 31, 2025. Magnolia’s SEC filings are available publicly on the SEC’s website at www.sec.gov .
| Magnolia Oil & Gas Corporation | |||||||||||||||
| Operating Highlights | |||||||||||||||
| For the Quarters Ended | For the Nine Months Ended | ||||||||||||||
| September 30, 2026 | September 30, 2025 | September 30, 2026 | September 30, 2025 | ||||||||||||
| Production: | |||||||||||||||
| Oil (MBbls) | 4,516 | 3,628 | 11,985 | 10,784 | |||||||||||
| Natural gas (MMcf) | 19,425 | 17,515 | 55,009 | 50,828 | |||||||||||
| Natural gas liquids (MBbls) | 3,037 | 2,700 | 8,522 | 7,620 | |||||||||||
| Total (Mboe) | 10,790 | 9,247 | 29,675 | 26,875 | |||||||||||
| Average daily production: | |||||||||||||||
| Oil (Bbls/d) | 49,082 | 39,430 | 43,902 | 39,500 | |||||||||||
| Natural gas (Mcf/d) | 211,137 | 190,384 | 201,498 | 186,183 | |||||||||||
| Natural gas liquids (Bbls/d) | 33,015 | 29,347 | 31,215 | 27,912 | |||||||||||
| Total (boe/d) | 117,286 | 100,507 | 108,700 | 98,443 | |||||||||||
| Revenues (in thousands): | |||||||||||||||
| Oil revenues | $ | 393,674 | $ | 230,530 | $ | 1,024,763 | $ | 702,409 | |||||||
| Natural gas revenues | 43,446 | 43,169 | 134,915 | 137,386 | |||||||||||
| Natural gas liquids revenues | 75,444 | 51,236 | 190,208 | 154,422 | |||||||||||
| Other revenues | 1,326 | — | 1,326 | — | |||||||||||
| Total Revenues | $ | 513,890 | $ | 324,935 | $ | 1,351,212 | $ | 994,217 | |||||||
| Average sales price: | |||||||||||||||
| Oil (per Bbl) | $ | 87.18 | $ | 63.55 | $ | 85.50 | $ | 65.14 | |||||||
| Natural gas (per Mcf) | 2.24 | 2.46 | 2.45 | 2.70 | |||||||||||
| Natural gas liquids (per Bbl) | 24.84 | 18.98 | 22.32 | 20.27 | |||||||||||
| Total (per boe) | $ | 47.63 | $ | 35.14 | $ | 45.53 | $ | 36.99 | |||||||
| NYMEX WTI (per Bbl) | $ | 85.68 | $ | 64.95 | $ | 83.62 | $ | 66.67 | |||||||
| NYMEX Henry Hub (per MMBtu) | $ | 2.96 | $ | 3.07 | $ | 3.60 | $ | 3.39 | |||||||
| Realization to benchmark: | |||||||||||||||
| Oil (% of WTI) | 102 | % | 98 | % | 102 | % | 98 | % | |||||||
| Natural Gas (% of Henry Hub) | 76 | % | 80 | % | 68 | % | 80 | % | |||||||
| Operating expenses (in thousands): | |||||||||||||||
| Lease operating expenses | $ | 55,990 | $ | 48,553 | $ | 152,150 | $ | 139,218 | |||||||
| Gathering, transportation and processing | 19,598 | 17,744 | 55,008 | 49,186 | |||||||||||
| Taxes other than income | 24,889 | 20,383 | 64,033 | 59,291 | |||||||||||
| Depreciation, depletion and amortization | 147,863 | 110,618 | 377,737 | 323,552 | |||||||||||
| Operating costs per boe: | |||||||||||||||
| Lease operating expenses | $ | 5.19 | $ | 5.25 | $ | 5.13 | $ | 5.18 | |||||||
| Gathering, transportation and processing | 1.82 | 1.92 | 1.85 | 1.83 | |||||||||||
| Taxes other than income | 2.31 | 2.20 | 2.16 | 2.21 | |||||||||||
| Depreciation, depletion and amortization | 13.70 | 11.96 | 12.73 | 12.04 |
| Magnolia Oil & Gas Corporation | |||||||||||||||
| Consolidated Statements of Operations | |||||||||||||||
| (In thousands, except per share data) | For the Quarters Ended | For the Nine Months Ended | |||||||||||||
| September 30, 2026 | September 30, 2025 | September 30, 2026 | September 30, 2025 | ||||||||||||
| REVENUES | |||||||||||||||
| Oil revenues | $ | 393,674 | $ | 230,530 | $ | 1,024,763 | $ | 702,409 | |||||||
| Natural gas revenues | 43,446 | 43,169 | 134,915 | 137,386 | |||||||||||
| Natural gas liquids revenues | 75,444 | 51,236 | 190,208 | 154,422 | |||||||||||
| Other revenues | 1,326 | — | 1,326 | — | |||||||||||
| Total revenues | 513,890 | 324,935 | 1,351,212 | 994,217 | |||||||||||
| OPERATING EXPENSES | |||||||||||||||
| Lease operating expenses | 55,990 | 48,553 | 152,150 | 139,218 | |||||||||||
| Gathering, transportation and processing | 19,598 | 17,744 | 55,008 | 49,186 | |||||||||||
| Taxes other than income | 24,889 | 20,383 | 64,033 | 59,291 | |||||||||||
| Exploration expenses | 13,725 | 131 | 15,679 | 841 | |||||||||||
| Asset retirement obligations accretion | 2,513 | 1,838 | 6,232 | 4,957 | |||||||||||
| Depreciation, depletion and amortization | 147,863 | 110,618 | 377,737 | 323,552 | |||||||||||
| General and administrative expenses | 25,345 | 24,204 | 85,941 | 72,072 | |||||||||||
| Transaction and integration costs | 68,743 | — | 71,943 | — | |||||||||||
| Other operating expenses | 625 | — | 625 | — | |||||||||||
| Total operating expenses | 359,291 | 223,471 | 829,348 | 649,117 | |||||||||||
| OPERATING INCOME | 154,599 | 101,464 | 521,864 | 345,100 | |||||||||||
| OTHER EXPENSE | |||||||||||||||
| Interest expense, net | (8,542 | ) | (5,362 | ) | (21,266 | ) | (16,218 | ) | |||||||
| Realized loss on derivatives, net | (1,413 | ) | — | (1,413 | ) | — | |||||||||
| Unrealized loss on derivatives, net | (39,874 | ) | — | (39,874 | ) | — | |||||||||
| Other income (expense), net | (505 | ) | (661 | ) | (920 | ) | 309 | ||||||||
| Total other expense, net | (50,334 | ) | (6,023 | ) | (63,473 | ) | (15,909 | ) | |||||||
| INCOME BEFORE INCOME TAXES | 104,265 | 95,441 | 458,391 | 329,191 | |||||||||||
| Current income tax benefit | (15,663 | ) | (32,288 | ) | (9,234 | ) | (15,367 | ) | |||||||
| Deferred income tax expense | 39,453 | 49,496 | 104,538 | 78,650 | |||||||||||
| Total income tax expense | 23,790 | 17,208 | 95,304 | 63,283 | |||||||||||
| NET INCOME | 80,475 | 78,233 | 363,087 | 265,908 | |||||||||||
| LESS: Net income attributable to noncontrolling interest | — | 2,777 | 1,011 | 9,409 | |||||||||||
| NET INCOME ATTRIBUTABLE TO CLASS A COMMON STOCK | $ | 80,475 | $ | 75,456 | $ | 362,076 | $ | 256,499 | |||||||
| NET INCOME PER COMMON SHARE | |||||||||||||||
| Basic | $ | 0.35 | $ | 0.40 | $ | 1.79 | $ | 1.36 | |||||||
| Diluted | $ | 0.35 | $ | 0.40 | $ | 1.79 | $ | 1.36 | |||||||
| WEIGHTED AVERAGE NUMBER OF COMMON SHARES OUTSTANDING | |||||||||||||||
| Basic | 230,629 | 184,737 | 199,664 | 186,621 | |||||||||||
| Diluted | 230,641 | 184,749 | 199,676 | 186,633 | |||||||||||
| WEIGHTED AVERAGE NUMBER OF CLASS B SHARES OUTSTANDING (1) | — | 5,523 | 870 | 5,523 | |||||||||||
| DILUTED WEIGHTED AVERAGE TOTAL SHARES OUTSTANDING (1) | 230,641 | 190,272 | 200,546 | 192,156 | |||||||||||
| (1) Shares of Class B Common Stock, and corresponding Magnolia LLC Units, are anti-dilutive in the calculation of weighted average number of common shares outstanding. |
| Magnolia Oil & Gas Corporation | |||||||||||||||
| Summary Cash Flow Data | |||||||||||||||
| (In thousands) | |||||||||||||||
| For the Quarters Ended | For the Nine Months Ended | ||||||||||||||
| September 30, 2026 | September 30, 2025 | September 30, 2026 | September 30, 2025 | ||||||||||||
| CASH FLOWS FROM OPERATING ACTIVITIES | |||||||||||||||
| NET INCOME | $ | 80,475 | $ | 78,233 | $ | 363,087 | $ | 265,908 | |||||||
| Adjustments to reconcile net income to net cash provided by operating activities: | |||||||||||||||
| Depreciation, depletion and amortization | 147,863 | 110,618 | 377,737 | 323,552 | |||||||||||
| Asset retirement obligations accretion | 2,513 | 1,838 | 6,232 | 4,957 | |||||||||||
| Amortization of deferred financing costs | 517 | 547 | 1,616 | 1,619 | |||||||||||
| Deferred income tax expense | 39,453 | 49,496 | 104,538 | 78,650 | |||||||||||
| Gain on revaluation of contingent consideration | — | (507 | ) | — | (4,511 | ) | |||||||||
| Stock based compensation | 9,807 | 7,316 | 31,692 | 21,167 | |||||||||||
| Unrealized loss on derivatives, net | 39,874 | — | 39,874 | — | |||||||||||
| Other operating activities | 2,220 | (231 | ) | 6,483 | 2,647 | ||||||||||
| Net change in operating assets and liabilities | 46,257 | (256 | ) | 19,362 | (23,746 | ) | |||||||||
| Net cash provided by operating activities | 368,979 | 247,054 | 950,621 | 670,243 | |||||||||||
| CASH FLOWS FROM INVESTING ACTIVITIES | |||||||||||||||
| Acquisitions | (2,555,387 | ) | (24,706 | ) | (2,711,597 | ) | (64,359 | ) | |||||||
| Additions to oil and natural gas properties | (150,759 | ) | (119,048 | ) | (404,316 | ) | (350,503 | ) | |||||||
| Changes in working capital associated with additions to oil and natural gas properties | (11,550 | ) | 5,667 | 13,658 | 8,437 | ||||||||||
| Other investing activities | 37,119 | 12 | 43,697 | 5,782 | |||||||||||
| Net cash used in investing activities | (2,680,577 | ) | (138,075 | ) | (3,058,558 | ) | (400,643 | ) | |||||||
| CASH FLOW FROM FINANCING ACTIVITIES | |||||||||||||||
| Issuance of common stock | 1,225,617 | — | 1,225,617 | — | |||||||||||
| Proceeds from revolving credit facility | 535,000 | — | 535,000 | — | |||||||||||
| Proceeds from issuance of long-term debt | 500,000 | — | 500,000 | — | |||||||||||
| Repayment of revolving credit facility | (100,000 | ) | — | (100,000 | ) | — | |||||||||
| Class A Common Stock repurchases | (60,196 | ) | (51,249 | ) | (142,802 | ) | (152,181 | ) | |||||||
| Class B Common Stock purchases and cancellations | — | — | (19,793 | ) | — | ||||||||||
| Dividends paid | (43,054 | ) | (28,081 | ) | (104,300 | ) | (85,341 | ) | |||||||
| Cash paid for debt issuance costs | (23,605 | ) | — | (23,605 | ) | — | |||||||||
| Distributions to noncontrolling interest owners | — | (829 | ) | (911 | ) | (2,671 | ) | ||||||||
| Other financing activities | (609 | ) | (96 | ) | (10,561 | ) | (8,971 | ) | |||||||
| Net cash provided by (used in) financing activities | 2,033,153 | (80,255 | ) | 1,858,645 | (249,164 | ) | |||||||||
| NET CHANGE IN CASH AND CASH EQUIVALENTS | (278,445 | ) | 28,724 | (249,292 | ) | 20,436 | |||||||||
| Cash and cash equivalents – Beginning of period | 295,938 | 251,761 | 266,785 | 260,049 | |||||||||||
| Cash and cash equivalents – End of period | $ | 17,493 | $ | 280,485 | $ | 17,493 | $ | 280,485 |
| Magnolia Oil & Gas Corporation | |||||||
| Summary Balance Sheet Data | |||||||
| (In thousands) | |||||||
| September 30, 2026 | December 31, 2025 | ||||||
| Cash and cash equivalents | $ | 17,493 | $ | 266,785 | |||
| Other current assets | 363,522 | 175,650 | |||||
| Property, plant and equipment, net | 6,923,181 | 2,424,152 | |||||
| Other assets | 72,686 | 36,505 | |||||
| Total assets | $ | 7,376,882 | $ | 2,903,092 | |||
| Current liabilities | $ | 746,038 | $ | 288,030 | |||
| Long-term debt, net | 1,937,799 | 393,251 | |||||
| Other long-term liabilities | 439,945 | 222,638 | |||||
| Stockholders’ equity | 4,253,100 | 1,939,958 | |||||
| Noncontrolling interest | — | 59,215 | |||||
| Total liabilities and equity | $ | 7,376,882 | $ | 2,903,092 |
| Magnolia Oil & Gas Corporation |
| Derivatives |
| (In thousands) |
Magnolia implemented oil hedges during the third quarter, supplementing those inherited in the WildFire Acquisition. These additional hedges are structured as costless collars with attractive floor prices intended to provide ample cash flow to protect the execution of our consistent business model while supporting continuous debt reduction.
The Company had the following outstanding derivative contracts in place as of September 30, 2026:
| Q4 2026 | Q1 2027 | Q2 2027 | Q3 2027 | Q4 2027 | |||||||||||
| Crude oil derivative contracts: | |||||||||||||||
| Costless collars (1) | |||||||||||||||
| Notional volume (Bbl) | 3,680,000 | 2,700,000 | 2,275,000 | 920,000 | — | ||||||||||
| Weighted average floor price ($/Bbl) | $ | 73.75 | $ | 70.83 | $ | 70.00 | $ | 70.00 | $ | — | |||||
| Weighted average ceiling price ($/Bbl) | $ | 90.97 | $ | 88.68 | $ | 82.31 | $ | 80.08 | $ | — | |||||
| Fixed price swap contracts (2) | |||||||||||||||
| Notional volume (Bbl) | 2,261,947 | 2,066,605 | 1,982,790 | 893,666 | 866,955 | ||||||||||
| Weighted average fixed price ($/Bbl) | $ | 63.85 | $ | 63.46 | $ | 65.02 | $ | 67.37 | $ | 66.34 | |||||
| (1) All oil costless collars settle against the average of the prompt month Argus WTI Houston futures price. | |||||||||||||||
| (2) All oil fixed price swaps settle against the average of the prompt month NYMEX WTI futures price. |
Magnolia Oil & Gas Corporation
Non-GAAP Financial Measures
Reconciliation of net income to adjusted EBITDAX
In this press release, we refer to adjusted EBITDAX, a supplemental non-GAAP financial measure that is used by management and external users of our consolidated financial statements, such as industry analysts, investors, lenders, and rating agencies. We define adjusted EBITDAX as net income before interest expense, income taxes, depreciation, depletion and amortization, exploration expenses, accretion of asset retirement obligations, transaction and integration costs, and unrealized loss on derivatives, net, adjusted to exclude the effect of certain items included in net income. Adjusted EBITDAX is not a measure of net income in accordance with GAAP.
Our management believes that adjusted EBITDAX is useful because it allows them to more effectively evaluate our operating performance and compare the results of our operations from period to period and against our peers without regard to our financing methods or capital structure. We also believe that securities analysts, investors, and other interested parties may use adjusted EBITDAX in the evaluation of our Company. We exclude the items listed above from net income in arriving at adjusted EBITDAX because these amounts can vary substantially from company to company within our industry depending upon accounting methods and book values of assets, capital structures and the method by which the assets were acquired. Adjusted EBITDAX should not be considered as an alternative to, or more meaningful than, net income as determined in accordance with GAAP or as an indicator of our operating performance or liquidity. Certain items excluded from adjusted EBITDAX are significant components in understanding and assessing a company’s financial performance, such as a company’s cost of capital and tax structure, as well as the historic costs of depreciable assets, none of which are components of adjusted EBITDAX. Our presentation of adjusted EBITDAX should not be construed as an inference that our results will be unaffected by unusual or non-recurring items. Our computations of adjusted EBITDAX may not be comparable to other similarly titled measures of other companies.
The following table presents a reconciliation of net income to adjusted EBITDAX, our most directly comparable financial measure, calculated and presented in accordance with GAAP:
| For the Quarters Ended | |||||||
| (In thousands) | September 30, 2026 | September 30, 2025 | |||||
| NET INCOME | $ | 80,475 | $ | 78,233 | |||
| Interest expense, net | 8,542 | 5,362 | |||||
| Income tax expense | 23,790 | 17,208 | |||||
| EBIT | 112,807 | 100,803 | |||||
| Depreciation, depletion and amortization | 147,863 | 110,618 | |||||
| Asset retirement obligations accretion | 2,513 | 1,838 | |||||
| EBITDA | 263,183 | 213,259 | |||||
| Exploration expenses | 13,725 | 131 | |||||
| EBITDAX | 276,908 | 213,390 | |||||
| Non-cash stock based compensation expense | 6,474 | 5,935 | |||||
| Transaction and integration costs | 68,743 | — | |||||
| Unrealized loss on derivatives, net | 39,874 | — | |||||
| Gain on revaluation of contingent consideration | — | (507 | ) | ||||
| Adjusted EBITDAX | $ | 391,999 | $ | 218,818 |
Magnolia Oil & Gas Corporation
Non-GAAP Financial Measures
Reconciliation of net income to adjusted net income
Our presentation of adjusted net income is a non-GAAP measure because it excludes the effect of certain items included in net income. Management uses adjusted net income to evaluate our operating and financial performance because it eliminates the impact of certain items that management does not consider to be representative of the Company’s on-going business operations. As a performance measure, adjusted net income may be useful to investors in facilitating comparisons to others in the Company’s industry because certain items can vary substantially in the oil and gas industry from company to company depending upon accounting methods, book value of assets, and capital structure, among other factors. Management believes adjusting these items facilitates investors and analysts in evaluating and comparing the underlying operating and financial performance of our business from period to period by eliminating differences caused by the existence and timing of certain expense and income items that would not otherwise be apparent on a GAAP basis. However, our presentation of adjusted net income may not be comparable to similar measures of other companies in our industry.
| For the Quarters Ended | |||||||
| (In thousands) | September 30, 2026 | September 30, 2025 | |||||
| NET INCOME | $ | 80,475 | $ | 78,233 | |||
| Adjustments: | |||||||
| Transaction and integration costs | 68,743 | — | |||||
| Unrealized loss on derivatives, net | 39,874 | — | |||||
| Gain on revaluation of contingent consideration | — | (507 | ) | ||||
| Change in estimated income tax (1) | (22,810 | ) | 98 | ||||
| ADJUSTED NET INCOME | $ | 166,282 | $ | 77,824 | |||
| (1) Represents corporate income taxes at an assumed annual effective tax rate of 21.0% and 19.3% for the quarters ended September 30, 2026 and 2025, respectively. |
Magnolia Oil & Gas Corporation
Non-GAAP Financial Measures
Reconciliation of earnings per share to adjusted earnings per share
Our presentation of adjusted earnings per share is a non-GAAP measure because it excludes the effect of certain items included in net income. Management uses adjusted earnings per share to evaluate our operating and financial performance because it eliminates the impact of certain items that management does not consider to be representative of the Company’s on-going business operations. As a performance measure, adjusted earnings per share may be useful to investors in facilitating comparisons to others in the Company’s industry because certain items can vary substantially in the oil and gas industry from company to company depending upon accounting methods, book value of assets, and capital structure, among other factors. Management believes excluding these items facilitates investors and analysts in evaluating and comparing the underlying operating and financial performance of our business from period to period by eliminating differences caused by the existence and timing of certain expense and income items that would not otherwise be apparent on a GAAP basis. However, our presentation of adjusted earnings per share may not be comparable to similar measures of other companies in our industry.
The Company has not presented prior-period quarterly adjusted diluted earnings per share because differences in the capital structure, including the treatment of the Company's Class B shares as anti-dilutive under ASC 260 in the prior period, result in diluted weighted-average shares outstanding that are not comparable to the current period. Accordingly, management believes presentation of prior-period adjusted diluted earnings per share would not provide a meaningful comparison.
| For the Quarter Ended September 30, 2026 | Per Share Diluted EPS | ||||||
| (In thousands, except per share data) | |||||||
| NET INCOME ATTRIBUTABLE TO CLASS A COMMON STOCK | $ | 80,475 | |||||
| Dividends and net income allocated to participating securities | (808 | ) | |||||
| Net income, net of participating securities | $ | 79,667 | $ | 0.35 | |||
| Adjustments: | |||||||
| Dividends and net income allocated to participating securities | $ | 808 | — | ||||
| Transaction and integration costs | 68,743 | 0.30 | |||||
| Unrealized loss on derivatives, net | 39,874 | 0.17 | |||||
| Change in estimated income tax (1) | (22,810 | ) | (0.10 | ) | |||
| ADJUSTED NET INCOME | 166,282 | ||||||
| Adjusted dividends and net income allocated to participating securities | (1,745 | ) | (0.01 | ) | |||
| Adjusted net income, net of participating securities | $ | 164,537 | $ | 0.71 | |||
| (1) Represents corporate income taxes at an assumed annual effective tax rate of 21.0% for the quarter ended September 30, 2026. |
Magnolia Oil & Gas Corporation
Non-GAAP Financial Measures
Reconciliation of revenue to adjusted cash operating margin and operating income margin
Our presentation of adjusted operating income margin, adjusted cash operating margin and total adjusted cash operating costs are supplemental non-GAAP financial measures that are used by management. Total adjusted cash operating costs exclude the impact of non-cash activity. We define adjusted cash operating margin per boe as total revenues per boe less cash operating costs per boe. We define adjusted operating income margin as operating margin excluding transaction and integration costs. Management believes that adjusted operating income margin, total adjusted cash operating costs per boe and adjusted cash operating margin per boe provide relevant and useful information, which is used by our management in assessing the Company’s profitability and comparability of results to our peers.
As a performance measure, adjusted operating income margin, total adjusted cash operating costs and adjusted cash operating margin may be useful to investors in facilitating comparisons to others in the Company’s industry because certain items can vary substantially in the oil and gas industry from company to company depending upon accounting methods, book value of assets, and capital structure, among other factors. Management believes excluding these items facilitates investors and analysts in evaluating and comparing the underlying operating and financial performance of our business from period to period by eliminating differences caused by the existence and timing of certain expense and income items that would not otherwise be apparent on a GAAP basis. However, our presentation of adjusted operating income margin, adjusted cash operating margin may not be comparable to similar measures of other companies in our industry.
| For the Quarters Ended | |||||||
| (in $/boe) | September 30, 2026 | September 30, 2025 | |||||
| Revenue | $ | 47.63 | $ | 35.14 | |||
| Total cash operating costs: | |||||||
| Lease operating expenses (1) | (5.12 | ) | (5.16 | ) | |||
| Gathering, transportation and processing | (1.82 | ) | (1.92 | ) | |||
| Taxes other than income | (2.31 | ) | (2.20 | ) | |||
| Exploration expenses | (1.27 | ) | (0.01 | ) | |||
| General and administrative expenses (2) | (1.82 | ) | (2.07 | ) | |||
| Transaction and integration costs | (6.37 | ) | — | ||||
| Other operating expenses | (0.06 | ) | — | ||||
| Total adjusted cash operating costs | (18.77 | ) | (11.36 | ) | |||
| Adjusted cash operating margin | $ | 28.86 | $ | 23.78 | |||
| Margin (%) | 61 | % | 68 | % | |||
| Non-cash costs: | |||||||
| Depreciation, depletion and amortization | $ | (13.70 | ) | $ | (11.96 | ) | |
| Asset retirement obligations accretion | (0.23 | ) | (0.20 | ) | |||
| Non-cash stock based compensation | (0.60 | ) | (0.64 | ) | |||
| Total non-cash costs | (14.53 | ) | (12.80 | ) | |||
| Operating income margin | $ | 14.33 | $ | 10.98 | |||
| Add back: Transaction and integration costs | 6.37 | — | |||||
| Adjusted operating income margin | $ | 20.70 | $ | 10.98 | |||
| Margin (%) | 43 | % | 31 | % | |||
| (1) Lease operating expenses exclude non-cash stock based compensation of $0.8 million, or $0.07 per boe, and $0.9 million, or $0.09 per boe, for the quarters ended September 30, 2026 and 2025, respectively. | |||||||
| (2) General and administrative expenses exclude non-cash stock based compensation of $5.7 million, or $0.53 per boe, and $5.1 million, or $0.55 per boe, for the quarters ended September 30, 2026 and 2025, respectively. |
Magnolia Oil & Gas Corporation
Non-GAAP Financial Measures
Reconciliation of net cash provided by operating activities to adjusted free cash flow
Free cash flow and adjusted free cash flow are non-GAAP financial measures. Free cash flow is defined as cash flows from operations before net change in operating assets and liabilities less additions to oil and natural gas properties and changes in working capital associated with additions to oil and natural gas properties. Adjusted free cash flow is defined as free cash flow excluding transaction and integration costs. Management believes free cash flow and adjusted free cash flow are useful for investors and widely accepted by those following the oil and gas industry as financial indicators of a company’s ability to generate cash to internally fund drilling and completion activities, fund acquisitions, and service debt. It is also used by research analysts to value and compare oil and gas exploration and production companies and are frequently included in published research when providing investment recommendations. Free cash flow and adjusted free cash flow are used by management as an additional measure of liquidity. Free cash flow and adjusted free cash flow are not a measure of financial performance under GAAP and should not be considered alternatives to cash flows from operating, investing, or financing activities.
| For the Quarters Ended | |||||||
| (In thousands) | September 30, 2026 | September 30, 2025 | |||||
| Net cash provided by operating activities | $ | 368,979 | $ | 247,054 | |||
| Add back: net change in operating assets and liabilities | (46,257 | ) | 256 | ||||
| Cash flows from operations before net change in operating assets and liabilities | 322,722 | 247,310 | |||||
| Additions to oil and natural gas properties | (150,759 | ) | (119,048 | ) | |||
| Changes in working capital associated with additions to oil and natural gas properties | (11,550 | ) | 5,667 | ||||
| Free cash flow | 160,413 | 133,929 | |||||
| Adjustments: | |||||||
| Transaction and integration costs(1) | 63,285 | — | |||||
| Adjusted free cash flow | $ | 223,698 | $ | 133,929 | |||
| (1) Transaction and integration costs exclude non-cash stock based compensation of $5.5 million for the quarter ended September 30, 2026. |
Magnolia Oil & Gas Corporation
Non-GAAP Financial Measures
Reconciliation of loss on derivatives to settlement of derivative contracts
Cash paid to settle derivative contracts differs from the loss on derivatives reported in the consolidated statements of operations because certain settlements relate to derivative liabilities established in connection with the WildFire Acquisition. The following table reconciles loss on derivatives, net, to settlements of derivative contracts for the period presented.
| For the Quarter Ended | |||
| (In thousands) | September 30, 2026 | ||
| Loss on derivatives, net | $ | (41,287 | ) |
| Add back: Unrealized loss on derivatives, net | 39,874 | ||
| Realized loss on derivatives, net | (1,413 | ) | |
| Settlements of derivatives assumed in the WildFire Acquisition, at their closing fair value (1) | (19,027 | ) | |
| Total settlement of derivative contracts | $ | (20,440 | ) |
| (1) Derivative contracts taken on in the WildFire acquisition were recorded at fair value as a liability on the acquisition date. When these contracts settle, the portion of the cash payment equal to their acquisition-date fair value reduces that liability and is not recognized as a realized loss. |
Magnolia Oil & Gas Corporation
N****on-GAAP Financial Measures
Reconciliation of long-term debt, net to net debt
Net debt, or outstanding debt obligations less cash and cash equivalents, is a non-GAAP financial measure. Management uses net debt as a measure of the Company’s outstanding debt obligations that would not be readily satisfied by its cash and cash equivalents on hand. The following table reconciles long-term debt, net, to net debt for the periods presented.
| (In thousands) | September 30, 2026 | December 31, 2025 | |||||
| Long-term debt, net | $ | 1,937,799 | $ | 393,251 | |||
| Unamortized premiums | (18,479 | ) | — | ||||
| Unamortized deferred financing costs | 15,680 | 6,749 | |||||
| Total long-term debt | 1,935,000 | 400,000 | |||||
| Less: Cash and cash equivalents | (17,493 | ) | (266,785 | ) | |||
| Net debt | $ | 1,917,507 | $ | 133,215 |
View source version on businesswire.com: https://www.businesswire.com/news/home/20261104007215/en/
Investors
Tom Fitter
(713) 331-4802
Media
Christina Kuhl
(713) 314-4849
Source: Magnolia Oil & Gas Corporation
Link to homepage

Magnolia Logo
© 2026 Magnolia Oil & Gas Operating LLC
990 Town & Country Blvd STE 900
Houston, TX 77024
713.842.9050
Register for Email Alerts
Sign up for email alerts below to be kept up to date with news from Magnolia Oil & Gas.
Field Operating Emergency: