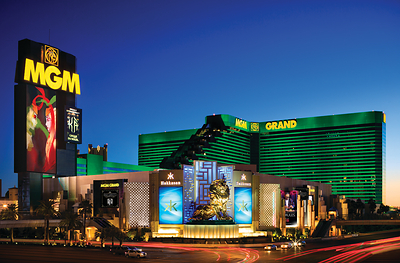
MGM Resorts International is a global gaming and entertainment company incorporated in 1986 that operates integrated casino resorts, hotels, and online gaming platforms. The company is organized into four reportable segments: Las Vegas Strip Resorts, Regional Operations, MGM China, and MGM Digital. Its Las Vegas portfolio includes Aria, Bellagio, The Cosmopolitan, MGM Grand, Mandalay Bay, Luxor, New York-New York, Excalibur, and Park MGM. Regional properties include MGM Grand Detroit, Beau Rivage, Borgata, MGM National Harbor, MGM Springfield, Empire City, and MGM Northfield Park. Through its controlling interest in MGM China, the company operates the MGM Macau and MGM Cotai casino resorts in Macau. The MGM Digital segment comprises LeoVegas, an online gaming platform operating primarily in Europe and Brazil, and the company holds an interest in BetMGM North America Venture for U.S. sports betting and iGaming. MGM Resorts also holds an interest in MGM Osaka Corporation, which is developing an integrated resort in Japan. The company serves leisure and business travelers, high-limit gaming customers, and online users across the United States, Macau, and international markets.

Summarised from the company's own disclosures, fiscal year ended Feb 2026

Industry Resorts & Casinos Homepage mgmresorts.com
Sector Consumer Cyclical IR page investors.mgmresorts.com
Tags
casino gaming, hotel operations, online sports betting, igaming, live entertainment, convention facilities, food and beverage, luxury hospitality, digital gaming, Aria, Vdara, Bellagio, The Cosmopolitan of Las Vegas, MGM Grand Las Vegas, The Signature, Mandalay Bay, W Las Vegas, Four Seasons, Luxor, New York-New York, The Park, Excalibur, Park MGM, The Reserve at Park MGM, MGM Grand Detroit, Beau Rivage, Borgata, MGM National Harbor, MGM Springfield, Empire City, MGM Northfield Park, MGM China Holdings Limited, MGM Grand Paradise S.A., MGM Macau, MGM Cotai, MGM Osaka Corporation, LV Lion Holding Limited, LeoVegas, BetMGM LLC, BetMGM North America Venture, Michael Jackson ONE by Cirque du Soleil, BATHHOUSE Spa, Nurture Spa & Salon, Sahra Spa Salon & Hammam, IMMERSE Spa, Spa Toccare, Luxxe Spa, Tailgate Beach Club, Liquid Pool Lounge, Marquee, Moorea Beach Club, Temptation Sundays, Palm Tree Beach Club, Bellagio Gallery of Fine Art, HERSHEY’S Chocolate World, SJP by Sarah Jessica Parker
Press page investors.mgmresorts.com/news-releases

Metrics

Valuation  
Market cap $ 7.608B
Market cap (USD) $ 7.608B
P/E 11.45
PEG —
P/BV 3.04
P/S 0.43
P/OCF 3.29
P/FCF 5.43
Dividend yield 0.03%
Turnover / mcap —
Returns  
ROE 7.5%
ROI 2.4%
ROIC 11.6%
Profit margin 1.2%
Growth  
Revenue growing Yes
Profits growing No
Revenue up 3y Yes
Revenue up 5y Yes
Earnings growth 3y (net profit CAGR) -47.3%
Quality  
Profitable Yes
Margin expanding No
Buying back stock Yes
Diluting (TTM) No
Debt/Equity 226.4%
Podcast bulls (TTM) Sign up
Podcast bears (TTM) Sign up
Podcast sentiment (TTM) Sign up
Podcast sentiment % (TTM) Sign up
News sentiment (TTM) 32
Quality score 42.1%
Insiders  
Buys, 1w Sign up
Buys, 1m Sign up
Buys, 1y Sign up
Sells, 1w Sign up
Sells, 1m Sign up
Sells, 1y Sign up

Sign up to see this company's insider trades

Figure FY 2025 FY 2024 FY 2023 FY 2022 FY 2021 FY 2020 FY 2019 FY 2018 FY 2017 FY 2016 FY 2015 FY 2014 FY 2013 FY 2012 FY 2011 FY 2010 FY 2009 FY 2008 FY 2007 FY 2006 FY 2005 FY 2004 FY 2003 FY 2002 FY 2001 FY 2000 FY 1999 FY 1998
Revenue 17.538B 17.241B 16.164B 13.127B 9.68B 5.162B 12.9B 11.763B 10.774B 9.455B 9.19B 10.082B 9.81B 9.161B 7.849B 6.019B 6.644B 7.884B 8.398B 7.797B 7.084B 4.672B 4.324B 4.46B 4.417B 3.519B — —
Net profit 205.862M 746.558M 1.142B 1.473B 1.254B -1.033B 2.049B 466.772M 1.96B 1.101B -447.72M -149.873M -156.606M -1.768B -30.308M -1.437B -1.292B -855.286M 1.584B 648.264M 443.256M 412.332M 243.697M 292.435M 169.815M 160.744M 86.058M 68.948M
Free cash flow 1.46B 1.212B 1.759B 991.395M 882.726M -1.764B 1.071B 235.696M 342.329M -728.501M -461.74M 258.629M 748.324M 486.588M 373.882M 296.523M 451.064M -28.722M -1.923B -642.101M 422.847M 126.385M 152.734M 527.919M 465.81M 481.059M -85.383M -190.262M

Figure FY 2025 FY 2024 FY 2023 FY 2022 FY 2021 FY 2020 FY 2019 FY 2018 FY 2017 FY 2016 FY 2015 FY 2014 FY 2013 FY 2012 FY 2011 FY 2010 FY 2009 FY 2008 FY 2007 FY 2006 FY 2005 FY 2004 FY 2003 FY 2002 FY 2001 FY 2000 FY 1999 FY 1998
Share price 36.49 34.65 44.68 33.53 44.88 31.51 33.27 24.26 33.39 28.83 22.72 21.38 23.52 11.64 10.43 14.85 7 13.76 88.58 56.06 — — — — — — — —
Price performance 12m 0.05 -0.22 0.33 -0.25 0.42 -0.05 0.37 -0.27 0.16 0.27 0.06 -0.09 1.02 0.12 -0.3 1.12 -0.49 -0.84 0.58 — — — — — — — — —

Filed figures

Figure Dec 2016 Dec 2017 Dec 2018 Dec 2019 Dec 2020 Dec 2021 Dec 2022 Dec 2023 Dec 2024 Dec 2025
Balance sheet detail
Trade receivables (USD) 543M 541M 657M 613M 317M 584M 852M 929M 1.07B 1.12B
↳ YoY growth +13.0% -0.4% +21.6% -6.8% -48.3% +84.5% +45.9% +9.0% +15.3% +4.8%
↳ 5y CAGR +2.0% +4.0% +6.1% +5.3% -8.0% +1.5% +9.5% +7.2% +11.8% +28.8%
Borrowings, current (USD) 8.38M 158M 43.4M 0.00 0.00 1B 1.29B 0.00 — —
Borrowings, non-current (USD) 13B 12.8B 15.1B 11.2B 12.4B 11.8B 7.43B 6.34B 6.36B 6.23B
Lease liabilities (USD) — — 0.00 4.44B 8.64B 12B 25.4B 25.3B 25.5B 25.3B
Cash and deposits (USD) 1.45B 1.5B 1.53B 2.33B 5.1B 4.7B 5.91B 2.93B 2.42B 2.06B
Intangible assets (USD) 4.09B 3.88B 3.94B 3.83B 3.64B 3.62B 1.55B 1.72B 1.72B 1.36B
Right-of-use assets (USD) — — 656M 4.39B 8.29B 11.5B 24.5B 24B 23.5B 23B
Net debt (borrowings + leases - cash) (USD) 11.5B 11.4B 13.6B 13.3B 15.9B 20.1B 28.2B 28.7B 29.4B 29.5B
Cash flow detail
Operating cash flow (USD) 1.53B 2.21B 1.72B 1.81B -1.49B 1.37B 1.76B 2.69B 2.36B 2.53B
Purchases of property, plant and equipment (USD) -2.26B -1.86B -1.49B -739M -271M -491M -765M -932M -1.15B -1.07B
Purchases of intangible assets (USD) 0.00 — — — — — — — — —
Change in receivables (cash effect) (USD) -33.2M -18.4M -150M -727M 960M -236M -212M -132M -158M -90.1M
Change in inventories (cash effect) (USD) 10.8M -4.66M -7.86M 6.52M 14.7M 3.11M -26.6M -15.5M 1.28M 15.7M
Change in payables (cash effect) (USD) 273M 420M 21.5M 466M -1.38B 443M 184M 410M -107M -82.4M
Dividends paid (cash effect) (USD) 0.00 -252M -261M -271M -77.6M -4.79M -4.05M 0.00 0.00 —
Share buybacks (cash effect) (USD) 0.00 -328M -1.28B -1.03B -354M -1.75B -2.78B -2.29B -1.36B -1.23B
Interest paid (cash effect) (USD) -661M -659M -724M -827M -640M -706M -574M -452M -406M -389M
Income taxes paid (cash effect) (USD) -68.2M -182M 10.1M -28.5M -8.54M -43M -23M -344M -267M 34.6M
Share-based compensation (USD) 55.5M 62.5M 70.2M 88.8M 107M 65.2M 71.3M 73.6M 80.2M 90.5M
Operating cash flow before change in receivables (USD) 1.57B 2.22B 1.87B 2.54B -2.45B 1.61B 1.97B 2.82B 2.52B 2.62B
Free cash flow (OCF - PPE - intangibles) (USD) -729M 342M 236M 1.07B -1.76B 883M 991M 1.76B 1.21B 1.46B
Income detail
Total comprehensive income (USD) 1.24B 2.06B 574M 2.21B -1.37B 1.22B 272M 1.43B 863M 902M
Comprehensive income to owners (USD) 1.1B 1.94B 462M 2.05B -1.06B 1.25B 1.52B 1.25B 541M 588M
Provision for credit losses (USD) 10.9M 20.6M 39.8M 39.3M 71.4M 21.9M 22.7M 49M 61.1M 61.1M
Credit cost ratio (credit losses / average receivables) (%) 2.1% 3.8% 6.6% 6.2% 15.4% 4.9% 3.2% 5.5% 6.1% 5.6%
Reported Mar 1, 2018 Mar 1, 2018 May 7, 2019 Feb 27, 2020 Nov 3, 2021 Feb 25, 2022 Feb 24, 2023 Feb 23, 2024 Feb 18, 2025 Feb 11, 2026

Operating KPIs — quarters

KPI Dec 24 Mar 25 Jun 25 Sep 25 Dec 25 Mar 26 Jun 26 Sep 26
Occupancy (%) 94.0% 94.0% 93.0% 89.0% 91.0% 92.0% 93.0% 89.0%
RevPAR (USD) 254 242 235 210 228 238 224 193
↳ YoY growth -5.9% -6.2% -2.1% -8.3% -10.2% -1.7% -4.7% -8.1%
Average daily rate (USD) 271 257 252 236 251 257 242 218
↳ YoY growth -8.1% -7.2% +1.6% -2.9% -7.4% 0% -4.0% -7.6%
Reported Feb 12, 2025 Apr 30, 2025 Jul 30, 2025 Oct 29, 2025 Feb 5, 2026 Apr 29, 2026 Jul 29, 2026 Oct 28, 2026

Operating KPIs — years

KPI Dec 2020 Dec 2021 Dec 2022 Dec 2023 Dec 2024 Dec 2025
Occupancy (%) 38.0% 86.0% 91.0% 91.0% 94.0% 91.0%
RevPAR (USD) — — 238 270 — —
↳ YoY growth +13.4%
Average daily rate (USD) — — 260 295 — —
↳ YoY growth +13.5%
Reported Feb 9, 2022 Feb 9, 2022 Feb 13, 2024 Feb 13, 2024 Feb 12, 2025 Feb 5, 2026

Sign up to see institutional holdings

Sign Up

Podcast Mentions

Sign up to see podcast mentions and sentiment

Sign Up

LAS VEGAS, Oct. 28, 2026 /PRNewswire / -- MGM Resorts International ("MGM Resorts" or the "Company") today announced that it has amended its existing Voting Agreement with People Incorporated ("People") (as amended, the "Agreement"). The amendment follows People's withdrawal of its previously announced proposal to acquire MGM Resorts.

MGM Resorts International

Key terms of the Agreement include, among other things, that People, Barry Diller and certain associated persons (the "Covered Entities") have agreed, subject to certain conditions, to vote all their MGM Resorts shares in accordance with the Board's recommendation in connection with a change of control transaction. The Covered Entities have also agreed to not purchase additional shares of MGM Resorts if doing so would result in their aggregate ownership exceeding 29.9% of the Company's outstanding shares. For so long as the Covered Entities remain in compliance with the Agreement, MGM Resorts has agreed not to take defensive measures or actions designed to be adverse to the Covered Entities.

"This agreement provides the Board with a clear path to maximize value through share repurchases and a change of control transaction, if applicable, in accordance with the Board's fiduciary duties," said Paul Salem, Chairman of the MGM Resorts Board. "We value People, our largest shareholder, and Barry Diller, an MGM Resorts Director, both of whom will continue to help maximize value for all shareholders."

The Agreement does not obligate MGM Resorts or the Covered Entities to pursue or enter into any transaction and none is contemplated. MGM Resorts remains committed to executing its operational strategy and acting in the best interests of the Company and its shareholders.

About MGM Resorts International

MGM Resorts International (NYSE: MGM) is an S&P 500® global gaming and entertainment company with national and international destinations featuring best-in-class hotels and casinos, state-of-the-art meetings and conference spaces, incredible live and theatrical entertainment experiences, and an extensive array of restaurant, nightlife and retail offerings. MGM Resorts creates immersive, iconic experiences through its suite of Las Vegas-inspired brands. The MGM Resorts portfolio encompasses 30 unique hotel and gaming destinations globally, including some of the most recognizable resort brands in the industry. The Company's 50/50 venture, BetMGM, LLC, offers sports betting and online gaming in North America through market-leading brands, including BetMGM and partypoker, and the Company's subsidiary, LV Lion Holding Limited, offers sports betting and online gaming through market-leading brands in several jurisdictions throughout Europe and Brazil. The Company is currently pursuing targeted expansion in Asia through an integrated resort development in Japan. Through its Focused on What Matters philosophy, MGM Resorts commits to creating a more sustainable future, while striving to make a bigger difference in the lives of its employees, guests and in the communities where it operates. The global employees of MGM Resorts are proud of their company for being recognized as one of FORTUNE® Magazine's World's Most Admired Companies®. For more information, please visit us at www.mgmresorts.com . Please also connect with us @MGMResortsIntl on X as well as Facebook and Instagram.

Forward Looking Statements

Statements in this release that are not historical facts are forward-looking statements, within the meaning of the Private Securities Litigation Reform Act of 1995, as amended, and involve risks and/or uncertainties, including those described in the Company's public filings with the Securities and Exchange Commission. Forward-looking statements can be identified by the use of forward-looking terminology such as "believes," "expects," "could," "may," "will," "should," "seeks," "likely," "intends," "plans," "projects," "estimates" or "anticipates" or the negative of these words and phrases or similar words or phrases that are predictions of or indicate future events or trends and that do not relate solely to historical matters. The Company has based forward-looking statements on management's current expectations and assumptions and not on historical facts. Forward-looking statements depend on assumptions, data or methods that may be incorrect or imprecise, and the Company may not be able to realize them. These forward-looking statements involve a number of risks and uncertainties. Among the important factors that could cause actual results to differ materially from those indicated in such forward-looking statements include risks relating to any strategic transaction the Company may undertake and the effects of such a transaction, or the completion or failure to complete such a transaction, on the Company's business, the effects of economic conditions and market conditions in the markets in which the Company operates and competition with other destination travel locations throughout the United States and the world, the design, timing and costs of expansion projects, risks relating to international operations, permits, licenses, financings, approvals and other contingencies in connection with growth in new or existing jurisdictions, the risks in the Company's execution of its strategic plan and additional risks and uncertainties described in the Company's Form 10-K, Form 10-Q and Form 8-K reports (including all amendments to those reports). In providing forward-looking statements, the Company is not undertaking any duty or obligation to update these statements publicly as a result of new information, future events or otherwise, except as required by law. If the Company updates one or more forward-looking statements, no inference should be drawn that it will make additional updates with respect to those other forward-looking statements.

MGM RESORTS CONTACTS:

Investment Community
SARAH ROGERS
Senior Vice President of Corporate Finance & Treasurer
[email protected]

HOWARD WANG
Vice President of Investor Relations
[email protected]  

News Media
BRIAN AHERN
Executive Director of Communications
[email protected]  

SOURCE MGM Resorts International

MGM Rewards Credit Cards

Apply now

Sign in or join

Receive offers

Online sportsbook and gaming

BetMGM U.S. BetMGM U.K. LeoVegas

Company information

Investor relations MGM Resorts Vacations Travel agents Press & newsroom Supplier information Corporate responsibility Sustainability Global procurement Gamesense About us

Inquiries

MGM Rewards rules FAQs Leasing opportunities Careers Contact us Casino photos/filming

Guest services

Gift cards Parking Find reservation Trips Marketing preferences Cookie settings Responsible gaming

Scan to get started on the MGM Rewards app

QR code to download app

MGM Rewards Credit Cards

Apply now

Sign in or join

Receive offers

Online sportsbook and gaming

BetMGM U.S. BetMGM U.K. LeoVegas

Company information

Investor relations MGM Resorts Vacations Travel agents Press & newsroom Supplier information Corporate responsibility Sustainability Global procurement Gamesense About us

Inquiries

MGM Rewards rules FAQs Leasing opportunities Careers Contact us Casino photos/filming

Guest services

Gift cards Parking Find reservation Trips Marketing preferences Cookie settings Responsible gaming

MGM Resorts

Bellagio Resort & Casino ARIA Resort & Casino Vdara Hotel & Spa at ARIA Las Vegas The Cosmopolitan of Las Vegas MGM Grand Hotel & Casino The Signature at MGM Grand Mandalay Bay Resort and Casino W Las Vegas Park MGM Las Vegas The Reserve New York-New York Hotel & Casino Luxor Hotel & Casino Excalibur Hotel & Casino Beau Rivage Resort & Casino Borgata Hotel Casino & Spa MGM Grand Detroit Empire City Casino MGM National Harbor MGM Springfield Bellagio Shanghai MGM Macau MGM Grand Sanya MGM Cotai Diaoyutai MGM Hospitality

Download the MGM Rewards app

Download on the App Store Get it on Google Play

The Reserve

MGM Rewards

If you gamble, use your GameSense . GameSense is a registered trademark of British Columbia Lottery Corporation, used under license by MGM Resorts International.

Copyright © 2026 MGM Resorts International. All rights reserved. Powered by Cision

Do Not Sell/Share My Personal Information Opt-out of Online Targeted Advertising Washington Health Privacy Notice California Privacy Notice MGM Privacy Policy Terms of Use Cision Privacy Policy

(opens in a new window)

LAS VEGAS, Oct. 28, 2026 /PRNewswire / -- MGM Resorts International (NYSE: MGM) ("MGM Resorts" or the "Company") today reported financial results for the quarter ended September 30, 2026.

MGM Resorts International

"MGM Resorts remains highly focused on the successful operations of our businesses. Our trailing twelve months Las Vegas Strip Resorts Segment Adjusted EBITDAR has grown by nearly 70% since calendar year 2019 and, while lower room rates during the third quarter impacted our results, October has rebounded favorably. Our diverse portfolio remains an advantage, with MGM China achieving 5% revenue growth and strong market share performance, while our digital businesses - including our BetMGM North America Venture and MGM Digital - reported strong topline growth during the third quarter," said Bill Hornbuckle, President & CEO of MGM Resorts International. "MGM Resorts remains dedicated to our mission to be the world's largest gaming and entertainment company with global integrated resorts, a leading digital presence, and, notably, an enviable growth pipeline with MGM Osaka to drive future value."

"The amended voting agreement announced earlier today establishes a highly supportive framework that enables MGM Resorts to confidently pursue value-creating share repurchases as part of our ongoing commitment to enhancing shareholder value and driving longer-term growth," said Jonathan Halkyard, Chief Financial Officer of MGM Resorts International. "The combination of our attractive stock valuation, the repurchase of nearly half of our outstanding share count over the past five years, and pivotal growth drivers - including our digital portfolio and MGM Osaka - positions the company as a premier long-term opportunity."

Third Quarter 2026 Financial Highlights:

Consolidated Results

  • Consolidated revenue of $4.2 billion, a decrease of 1% compared to the prior year quarter
  • Net loss attributable to MGM Resorts was $17 million in the current quarter compared to net loss attributable to MGM Resorts of $285 million in the prior year quarter
  • Consolidated Adjusted EBITDA of $403 million in the current quarter compared to $506 million in the prior year quarter
  • Diluted loss per share of $0.07 in the current quarter compared to a loss per share of $1.05 in the prior year quarter
  • Adjusted diluted earnings (loss) per share ("Adjusted EPS") of $(0.11) in the current quarter compared to $0.24 in the prior year quarter

Las Vegas Strip Resorts

  • Revenue of $2.0 billion in the current quarter, a decrease of 2% compared to the prior year quarter
  • Segment Adjusted EBITDAR of $531 million in the current quarter compared to $601 million in the prior year quarter, a decrease of 12%

Regional Operations

  • Revenue of $883 million in the current quarter compared to $957 million in the prior year quarter, a decrease of 8%
  • Same-store revenue (adjusted for dispositions) of $883 million in the current quarter compared to $873 million in the prior year quarter, an increase of 1%
  • Segment Adjusted EBITDAR of $243 million in the current quarter compared to $296 million in the prior year quarter, a decrease of 18%
  • Same-Store Segment Adjusted EBITDAR of $243 million in the current quarter compared to $260 million in the prior year quarter, a decrease of 7%

MGM China

  • Revenue of $1.1 billion in the current quarter, an increase of 5% compared to the prior year quarter
  • Segment Adjusted EBITDAR of $264 million in the current quarter compared to $284 million in the prior year quarter, a decrease of 7%
  • Intercompany branding license fee expense increased by $22 million over the prior year quarter

MGM Digital (1)

  • Revenue of $184 million in the current quarter compared to $174 million in the prior year quarter, an increase of 6%
  • Segment Adjusted EBITDAR loss of $4 million in the current quarter compared to a loss of $23 million in the prior year quarter

(1) MGM Digital consists of LeoVegas and other consolidated subsidiaries that offer interactive gaming; it does not include the BetMGM North America Venture.

Adjusted EPS

The following table reconciles diluted loss per share ("EPS") to Adjusted EPS (approximate EPS impact shown, per share; positive adjustments represent charges to income):

Three Months Ended September 30, 2026 2025
Diluted loss per share $                                        (0.07) $                                        (1.05)
Property transactions, net (0.06) 0.37
Goodwill impairment — 0.94
Non-operating items:
Loss related to debt and equity investments 0.18 0.01
Foreign currency transaction gain (0.06) (0.06)
Change in the fair value of foreign currency contracts (0.10) 0.15
Income tax impact on net income adjustments(1) — (0.12)
Adjusted EPS $                                        (0.11) $                                          0.24
(1)  The income tax impact includes current and deferred income tax expense based upon the nature of the adjustment and the jurisdiction in      which it occurs.

Las Vegas Strip Resorts

The following table shows key gaming statistics for Las Vegas Strip Resorts:

Three Months Ended September 30, 2026 2025 % Change
(Dollars in millions)
Casino revenue $                                488 $                                450 8 %
Table games drop $                             1,435 $                             1,363 5 %
Table games win $                                363 $                                309 17 %
Table games win % 25.3 % 22.6 %
Slot handle $                             6,200 $                             6,155 1 %
Slot win $                                582 $                                570 2 %
Slot win % 9.4 % 9.3 %

The following table shows key hotel statistics for Las Vegas Strip Resorts:

Three Months Ended September 30, 2026 2025 % Change
Room revenue (in millions) $                                622 $                                660 (6) %
Occupancy 89 % 89 %
Average daily rate (ADR) $                                218 $                                236 (8) %
Revenue per available room (RevPAR) $                                193 $                                210 (8) %

Regional Operations

The following table shows key gaming statistics for Regional Operations:

Three Months Ended September 30, 2026 2025 % Change
(Dollars in millions)
Casino revenue $                                626 $                                696 (10) %
Table games drop $                             1,050 $                             1,061 (1) %
Table games win $                                200 $                                205 (2) %
Table games win % 19.1 % 19.4 %
Slot handle $                             6,309 $                             6,969 (9) %
Slot win $                                629 $                                706 (11) %
Slot win % 10.0 % 10.1 %

MGM China

The following table shows key gaming statistics for MGM China:

Three Months Ended September 30, 2026 2025 % Change
(Dollars in millions)
Casino revenue $                                981 $                                947 4 %
Main floor table games drop $                             3,682 $                             4,072 (10) %
Main floor table games win $                             1,021 $                             1,006 1 %
Main floor table games win % 27.7 % 24.7 %

Intercompany branding license fee expense for MGM China, which eliminates in consolidation, was $41 million in the current quarter and $19 million in the prior year quarter.

Unconsolidated Affiliates

The following table summarizes information related to the Company's share of operating income from unconsolidated affiliates:

Three Months Ended September 30, 2026 2025
(In thousands)
BetMGM North America Venture $                                     26,743 $                                     23,725
Other 4,621 1,917
$                                     31,364 $                                     25,642

Conference Call Details 

MGM Resorts will host a conference call at 5:00 p.m. Eastern Time today, which will include a brief discussion of the results followed by a question and answer session. In addition, supplemental slides will be posted prior to the start of the call on MGM's Investor Relations website at http://investors.mgmresorts.com . 

The call will be accessible via the internet through http://investors.mgmresorts.com/events-and-presentations/  or by calling 1-888-317-6003 for domestic callers and 1-412-317-6061 for international callers. The conference call access code is 9250061.

A replay of the call will be available through November 4, 2026. The replay may be accessed by dialing 1-855-669-9658 or 1-412-317-0088. The replay access code is 9853875.

"Segment Adjusted EBITDAR" is our reportable segment GAAP measure, which we utilize as the primary profit measure for our reportable segments and underlying operating segments. Segment Adjusted EBITDAR is a measure defined as earnings before interest and other non-operating income (expense), income taxes, depreciation and amortization, preopening and start-up expenses, property transactions, net, triple net lease rent expense, income from unconsolidated affiliates, goodwill impairment, and also excludes corporate expense and stock compensation expense, which are not allocated to each operating segment. Triple net lease rent expense is the expense for rent to landlords under triple net operating leases for its domestic properties, the ground subleases of Beau Rivage and MGM National Harbor, and the land concessions at MGM China.

"Same-Store Segment Adjusted EBITDAR" is Segment Adjusted EBITDAR further adjusted to exclude the Segment Adjusted EBITDAR of disposed operating segments from the beginning of the reporting period through the date of disposition. Accordingly, for Regional Operations, we have excluded the Segment Adjusted EBITDAR of MGM Northfield Park for the periods prior to its disposition on April 21, 2026, as applicable.

Same-Store Segment Adjusted EBITDAR is a non-GAAP measure and is presented solely as a supplemental disclosure to reported GAAP measures because management believes this measure is useful in providing meaningful period-to-period comparisons of the results of the Company's operations for operating segments that were consolidated for the full period presented to assist users of the financial statements in reviewing operating performance over time. Same-Store Segment Adjusted EBITDAR should not be viewed as a measure of overall operating performance, considered in isolation, or as an alternative to the Company's reportable segment GAAP measure or net income, or as an alternative to any other measure determined in accordance with generally accepted accounting principles, because this measure is not presented on a GAAP basis, and is provided for the limited purposes discussed herein. In addition, Same-Store Segment Adjusted EBITDAR may not be defined in the same manner by all companies and, as a result, may not be comparable to similarly titled non-GAAP financial measures of other companies, and such differences may be material. A reconciliation of the Company's reportable segment Segment Adjusted EBITDAR GAAP measure to Same-Store Segment Adjusted EBITDAR is included in the financial schedules in this release.

"Consolidated Adjusted EBITDA" is earnings before interest and other non-operating income (expense), income taxes, depreciation and amortization, preopening and start-up expenses, property transactions, net, and goodwill impairment. Consolidated Adjusted EBITDA information is a non-GAAP measure that is presented solely as a supplemental disclosure to reported GAAP measures because it is among the measures used by management to evaluate our operating performance, and because we believe this measure is widely used by analysts, lenders, financial institutions, and investors as a measure of operating performance in the gaming industry and as a principal basis for the valuation of gaming companies. We believe that while items excluded from Consolidated Adjusted EBITDA may be recurring in nature and should not be disregarded in evaluation of our earnings performance, it is useful to exclude such items when analyzing current results and trends compared to other periods because these items can vary significantly depending on specific underlying transactions or events that may not be comparable between the periods being presented. Also, we believe excluded items may not relate specifically to current operating trends or be indicative of future results. For example, preopening and start-up expenses will be significantly different in periods when we are developing and constructing a major expansion project and will depend on where the current period lies within the development cycle, as well as the size and scope of the project(s). Property transactions, net includes normal recurring disposals, gains and losses on sales of assets related to specific assets within our properties, but also includes gains or losses on sales of an entire operating resort or a group of resorts and impairment charges on entire asset groups or investments in unconsolidated affiliates, which may not be comparable period over period. However, Consolidated Adjusted EBITDA has limitations as an analytical tool, and should not be construed as an alternative or substitute to any measure determined in accordance with generally accepted accounting principles. For example, we have significant uses of cash flows, including capital expenditures, interest payments, income taxes, and debt principal repayments, which are not reflected in Consolidated Adjusted EBITDA. Accordingly, while we believe that Consolidated Adjusted EBITDA is a relevant measure of performance, Consolidated Adjusted EBITDA should not be construed as an alternative to or substitute for operating income or net income as an indicator of our performance, or as an alternative to or substitute for cash flows from operating activities as a measure of liquidity. In addition, other companies in the gaming and hospitality industries that report Consolidated Adjusted EBITDA may calculate Consolidated Adjusted EBITDA in a different manner and such differences may be material. A reconciliation of GAAP net income to Consolidated Adjusted EBITDA is included in the financial schedules in this release.

"Adjusted EPS" is diluted earnings or loss per share adjusted to exclude property transactions, net, goodwill impairment, net gain/loss related to equity investments for which we have elected the fair value option of ASC 825 and equity investments accounted for under ASC 321 for which there is a readily determinable fair value and net gain/loss related to our investments in debt securities, foreign currency transaction net gain/loss, and change in the fair value of foreign currency contracts.

Adjusted EPS is a non-GAAP measure and is presented solely as a supplemental disclosure to reported GAAP measures because we believe this measure is useful in providing period-to-period comparisons of the results of our continuing operations to assist investors in reviewing our operating performance over time. We believe that while certain items excluded from Adjusted EPS may be recurring in nature and should not be disregarded in evaluating our earnings performance, it is useful to exclude such items when comparing current performance to prior periods because these items can vary significantly depending on specific underlying transactions or events. Also, we believe certain excluded items, and items further discussed with respect to Consolidated Adjusted EBITDA above, may not relate specifically to current operating trends or be indicative of future results. Adjusted EPS should not be construed as an alternative to GAAP earnings per share as an indicator of our performance. In addition, Adjusted EPS may not be defined in the same manner by all companies and, as a result, may not be comparable to similarly titled non-GAAP financial measures of other companies. A reconciliation of Adjusted EPS to diluted earnings per share can be found under "Adjusted EPS" included in this release.

RevPAR is hotel revenue per available room.

About MGM Resorts International

MGM Resorts International (NYSE: MGM) is an S&P 500® global gaming and entertainment company with national and international destinations featuring best-in-class hotels and casinos, state-of-the-art meetings and conference spaces, incredible live and theatrical entertainment experiences, and an extensive array of restaurant, nightlife and retail offerings. MGM Resorts creates immersive, iconic experiences through its suite of Las Vegas-inspired brands. The MGM Resorts portfolio encompasses 30 unique hotel and gaming destinations globally, including some of the most recognizable resort brands in the industry. The Company's 50/50 venture, BetMGM, LLC, offers sports betting and online gaming in North America through market-leading brands, including BetMGM and partypoker, and the Company's subsidiary, LV Lion Holding Limited, offers sports betting and online gaming through market-leading brands in several jurisdictions throughout Europe. The Company is currently pursuing targeted expansion in Asia through an integrated resort development in Japan. Through its Focused on What Matters philosophy, MGM Resorts commits to creating a more sustainable future, while striving to make a bigger difference in the lives of its employees, guests and in the communities where it operates. The global employees of MGM Resorts are proud of their company for being recognized as one of FORTUNE® Magazine's World's Most Admired Companies®. For more information, please visit us at www.mgmresorts.com. Please also connect with us @MGMResortsIntl on X as well as Facebook and Instagram.

Cautionary Statement Concerning Forward-Looking Statements

Statements in this release that are not historical facts are forward-looking statements, within the meaning of the Private Securities Litigation Reform Act of 1995 and involve risks and/or uncertainties, including those described in the Company's public filings with the Securities and Exchange Commission. The Company has based forward-looking statements on management's current expectations and assumptions and not on historical facts. Examples of these statements include, but are not limited to: the Company's expectations regarding its financial outlook; any benefits expected to be received from the Company's transactions and capital investments; the Company's ability to execute on its strategic plans, including the Company's development project in Japan; expectations regarding growth at MGM Digital, BetMGM North America Venture, or MGM China; and the Company's ability to return capital to shareholders (including the timing and amount of any share repurchases). These forward-looking statements involve a number of risks and uncertainties. Among the important factors that could cause actual results to differ materially from those indicated in such forward-looking statements include: the effects of economic conditions and market conditions in the markets in which the Company and its unconsolidated affiliates (including BetMGM North America Venture) operate and competition with online gaming and sports betting operators and destination travel locations throughout the United States and the world; the design, timing and costs of expansion and capital investment projects in Japan and Dubai; changes in applicable laws or regulations, particularly with respect to iGaming and online sports betting; risks relating to domestic and international operations, permits, licenses, financings, approvals and other contingencies in connection with growth in new or existing jurisdictions; disruptions in the availability of the Company's information and other systems or those of third parties on which the Company relies , through cyber-attacks, or otherwise; and additional risks and uncertainties described in the Company's Form 10-K, Form 10-Q and Form 8-K reports (including all amendments to those reports). Any forward-looking statement made by the Company in this release speaks only as of the date on which it is made. In providing forward-looking statements, the Company is not undertaking any duty or obligation to update these statements publicly as a result of new information, future events or otherwise, except as required by law. If the Company updates one or more forward-looking statements, no inference should be drawn that it will make additional updates with respect to those other forward-looking statements.

MGM RESORTS CONTACTS: 

Investment Community
SARAH ROGERS
Senior Vice President of Corporate Finance & Treasurer
[email protected]
HOWARD WANG
Vice President of Investor Relations
[email protected]
News Media
BRIAN AHERN
Executive Director of Communications
[email protected]
MGM RESORTS INTERNATIONAL AND SUBSIDIARIES
CONSOLIDATED STATEMENTS OF OPERATIONS
(In thousands, except per share data)
(Unaudited)
Three Months Ended Nine Months Ended
September 30, September 30, September 30, September 30,
2026 2025 2026 2025
Revenue
Casino $ 2,304,393 $ 2,293,996 $ 7,066,433 $ 6,875,942
Rooms 762,999 795,236 2,479,996 2,519,045
Food and beverage 741,476 748,597 2,348,648 2,296,949
Entertainment, retail and other 403,023 412,635 1,222,525 1,240,480
4,211,891 4,250,464 13,117,602 12,932,416
Expenses
Casino 1,354,872 1,321,774 4,053,705 3,899,934
Rooms 281,278 266,767 842,944 819,682
Food and beverage 576,304 554,554 1,735,318 1,691,482
Entertainment, retail and other 266,022 261,772 782,788 759,081
General and administrative 1,228,504 1,240,178 3,774,596 3,618,767
Corporate expense 133,485 125,257 402,138 391,704
Preopening and start-up expenses 129 31 1,218 965
Property transactions, net 7,578 101,775 (264,897) 117,368
Goodwill impairment - 256,133 111,019 256,133
Depreciation and amortization 276,399 260,717 822,439 739,136
4,124,571 4,388,958 12,261,268 12,294,252
Income from unconsolidated affiliates 31,364 25,642 67,228 38,606
Operating income (loss) 118,684 (112,852) 923,562 676,770
Non-operating income (expense)
Interest expense, net of amounts capitalized (102,607) (102,287) (305,425) (315,140)
Non-operating items from unconsolidated affiliates (1,780) 5,942 (1,762) 2,149
Other, net 7,597 (10,390) 21,288 (182,826)
(96,790) (106,735) (285,899) (495,817)
Income (loss) before income taxes 21,894 (219,587) 637,663 180,953
Benefit (provision) for income taxes 17,313 12,858 (100,875) (42,857)
Net income (loss) 39,207 (206,729) 536,788 138,096
Less: Net income attributable to noncontrolling interests (56,315) (78,526) (136,327) (225,846)
Net income (loss) attributable to MGM Resorts International $ (17,108) $ (285,255) $ 400,461 $ (87,750)
Earnings per share
Basic $ (0.07) $ (1.05) $ 1.54 $ (0.32)
Diluted $ (0.07) $ (1.05) $ 1.52 $ (0.32)
Weighted average common shares outstanding
Basic 251,964 272,517 254,105 277,610
Diluted 251,964 272,517 257,442 277,610
MGM RESORTS INTERNATIONAL AND SUBSIDIARIES
CONSOLIDATED BALANCE SHEETS
(In thousands, except share data)
(Unaudited)
September 30, December 31,
2026 2025
ASSETS
Current assets
Cash and cash equivalents $ 2,395,957 $ 2,062,994
Accounts receivable, net 1,072,242 1,122,940
Inventories 123,509 124,535
Income tax receivable 36,114 220,154
Prepaid expenses and other 560,981 486,419
Assets held for sale - 315,382
Total current assets 4,188,803 4,332,424
Property and equipment, net 6,170,440 6,305,614
Investments in and advances to unconsolidated affiliates 673,379 536,066
Goodwill 4,765,627 4,901,960
Other intangible assets, net 1,229,520 1,356,676
Operating lease right-of-use assets, net 21,547,868 23,002,707
Deferred income taxes 128,321 89,792
Other long-term assets, net 770,114 848,547
$ 39,474,072 $ 41,373,786
LIABILITIES AND STOCKHOLDERS' EQUITY
Current liabilities
Accounts and construction payable $ 425,490 $ 421,502
Accrued interest on long-term debt 95,314 71,845
Other accrued liabilities 2,864,055 2,993,179
Liabilities related to assets held for sale - 25,581
Total current liabilities 3,384,859 3,512,107
Deferred income taxes 2,591,836 2,617,067
Long-term debt, net 5,668,986 6,230,141
Operating lease liabilities 23,749,751 24,962,742
Other long-term obligations 701,378 775,411
Total liabilities 36,096,810 38,097,468
Redeemable noncontrolling interests 8,527 21,777
Stockholders' equity
Common stock, $0.01 par value: authorized 1,000,000,000 shares,
issued and outstanding 251,601,576 and 258,323,143 shares 2,516 2,583
Capital in excess of par value 11,536 -
Retained earnings 2,291,614 2,106,836
Accumulated other comprehensive income 198,743 320,498
Total MGM Resorts International stockholders' equity 2,504,409 2,429,917
Noncontrolling interests 864,326 824,624
Total stockholders' equity 3,368,735 3,254,541
$ 39,474,072 $ 41,373,786
MGM RESORTS INTERNATIONAL AND SUBSIDIARIES
SUPPLEMENTAL DATA - REVENUE
(In thousands)
(Unaudited)
Three Months Ended Nine Months Ended
September 30, September 30, September 30, September 30,
2026 2025 2026 2025
Las Vegas Strip Resorts $ 1,954,340 $ 1,984,637 $ 6,304,815 $ 6,275,449
Regional Operations 883,204 956,875 2,725,212 2,821,906
MGM China 1,138,167 1,087,728 3,361,083 3,225,293
MGM Digital 183,666 174,027 562,715 465,946
Management and other operations 52,514 47,197 163,777 143,822
$ 4,211,891 $ 4,250,464 $ 13,117,602 $ 12,932,416
MGM RESORTS INTERNATIONAL AND SUBSIDIARIES
SUPPLEMENTAL DATA - SEGMENT ADJUSTED EBITDAR AND CONSOLIDATED ADJUSTED EBITDA
(In thousands)
(Unaudited)
Three Months Ended Nine Months Ended
September 30, September 30, September 30, September 30,
2026 2025 2026 2025
Las Vegas Strip Resorts $ 530,781 $ 600,869 $ 2,015,106 $ 2,122,525
Regional Operations 242,622 295,521 782,275 883,219
MGM China 263,978 283,990 794,161 870,897
MGM Digital (1) (4,209) (23,248) (60,695) (83,339)
Unconsolidated affiliates - BetMGM and other (2) 31,364 25,642 67,228 38,606
Management and other operations 25,117 16,273 83,273 58,267
Stock compensation (15,022) (14,274) (65,792) (59,350)
Triple net lease rent expense (548,903) (564,658) (1,665,718) (1,693,549)
Corporate (3) (122,938) (114,311) (356,497) (346,904)
Consolidated Adjusted EBITDA $ 402,790 $ 505,804 $ 1,593,341 $ 1,790,372
Additional Information:
Non-cash rent (4) $ 91,603 $ 104,011 $ 290,104 $ 321,360
(1) MGM Digital consists of LeoVegas and other consolidated subsidiaries that offer interactive gaming.
(2) Represents the Company's share of operating income of unconsolidated affiliates.
(3) Includes amounts related to MGM China of $17 million and $47 million for current quarter and current year, respectively, and of $13 million and $36 million for prior year quarter and prior year, respectively.
(4) Represents the excess of expense over cash paid related to triple net operating and ground leases.
MGM RESORTS INTERNATIONAL AND SUBSIDIARIES
RECONCILIATION OF NET INCOME ATTRIBUTABLE TO MGM RESORTS INTERNATIONAL TO CONSOLIDATED ADJUSTED EBITDA
(In thousands)
(Unaudited)
Three Months Ended Nine Months Ended
September 30, September 30, September 30, September 30,
2026 2025 2026 2025
Net income (loss) attributable to MGM Resorts International $ (17,108) $ (285,255) $ 400,461 $ (87,750)
Plus: Net income attributable to noncontrolling interests 56,315 78,526 136,327 225,846
Net income (loss) 39,207 (206,729) 536,788 138,096
Provision (benefit) for income taxes (17,313) (12,858) 100,875 42,857
Income (loss) before income taxes 21,894 (219,587) 637,663 180,953
Non-operating (income) expense:
Interest expense, net of amounts capitalized 102,607 102,287 305,425 315,140
Other, net (5,817) 4,448 (19,526) 180,677
96,790 106,735 285,899 495,817
Operating income (loss) 118,684 (112,852) 923,562 676,770
Preopening and start-up expenses 129 31 1,218 965
Property transactions, net 7,578 101,775 (264,897) 117,368
Goodwill impairment - 256,133 111,019 256,133
Depreciation and amortization 276,399 260,717 822,439 739,136
Consolidated Adjusted EBITDA $ 402,790 $ 505,804 $ 1,593,341 $ 1,790,372
MGM RESORTS INTERNATIONAL AND SUBSIDIARIES
RECONCILIATIONS OF REGIONAL OPERATIONS REVENUE TO REGIONAL OPERATIONS SAME-STORE REVENUE
AND REGIONAL OPERATIONS SEGMENT ADJUSTED EBITDAR TO REGIONAL OPERATIONS SAME-STORE SEGMENT ADJUSTED EBITDAR
(In thousands)
(Unaudited)
Three Months Ended Nine Months Ended
September 30, September 30, September 30, September 30,
2026 2025 2026 2025
Regional Operations revenue $ 883,204 $ 956,875 $ 2,725,212 $ 2,821,906
Dispositions (1) - (83,667) (104,468) (247,672)
Regional Operations same-store revenue $ 883,204 $ 873,208 $ 2,620,744 $ 2,574,234
Regional Operations Segment Adjusted EBITDAR $ 242,622 $ 295,521 $ 782,275 $ 883,219
Dispositions (1) - (35,790) (44,464) (106,956)
Regional Operations Same-Store Segment Adjusted EBITDAR $ 242,622 $ 259,731 $ 737,811 $ 776,263
(1) Reflects the revenue and Segment Adjusted EBITDAR of MGM Northfield Park, as applicable, for the period prior to its disposition.

SOURCE MGM Resorts International

MGM Rewards Credit Cards

Apply now

Sign in or join

Receive offers

Online sportsbook and gaming

BetMGM U.S. BetMGM U.K. LeoVegas

Company information

Investor relations MGM Resorts Vacations Travel agents Press & newsroom Supplier information Corporate responsibility Sustainability Global procurement Gamesense About us

Inquiries

MGM Rewards rules FAQs Leasing opportunities Careers Contact us Casino photos/filming

Guest services

Gift cards Parking Find reservation Trips Marketing preferences Cookie settings Responsible gaming

Scan to get started on the MGM Rewards app

QR code to download app

MGM Rewards Credit Cards

Apply now

Sign in or join

Receive offers

Online sportsbook and gaming

BetMGM U.S. BetMGM U.K. LeoVegas

Company information

Investor relations MGM Resorts Vacations Travel agents Press & newsroom Supplier information Corporate responsibility Sustainability Global procurement Gamesense About us

Inquiries

MGM Rewards rules FAQs Leasing opportunities Careers Contact us Casino photos/filming

Guest services

Gift cards Parking Find reservation Trips Marketing preferences Cookie settings Responsible gaming

MGM Resorts

Bellagio Resort & Casino ARIA Resort & Casino Vdara Hotel & Spa at ARIA Las Vegas The Cosmopolitan of Las Vegas MGM Grand Hotel & Casino The Signature at MGM Grand Mandalay Bay Resort and Casino W Las Vegas Park MGM Las Vegas The Reserve New York-New York Hotel & Casino Luxor Hotel & Casino Excalibur Hotel & Casino Beau Rivage Resort & Casino Borgata Hotel Casino & Spa MGM Grand Detroit Empire City Casino MGM National Harbor MGM Springfield Bellagio Shanghai MGM Macau MGM Grand Sanya MGM Cotai Diaoyutai MGM Hospitality

Download the MGM Rewards app

Download on the App Store Get it on Google Play

The Reserve

MGM Rewards

If you gamble, use your GameSense . GameSense is a registered trademark of British Columbia Lottery Corporation, used under license by MGM Resorts International.

Copyright © 2026 MGM Resorts International. All rights reserved. Powered by Cision

Do Not Sell/Share My Personal Information Opt-out of Online Targeted Advertising Washington Health Privacy Notice California Privacy Notice MGM Privacy Policy Terms of Use Cision Privacy Policy

(opens in a new window)

Tickets On Sale Friday, Oct. 30 at 10 a.m. PT

Click here to download "The MGM Slam" assets and video announcement from Rafael Nadal

KEY TAKEAWAYS:

  • Nadal Returns: 22-time Grand Slam champion Rafael Nadal will headline "The MGM Slam Presented by Capital One" on Sunday, Feb. 28, 2027 at T-Mobile Arena in Las Vegas, marking his first competitive appearance since retiring in late 2024.

  • Tickets On Sale: MGM Rewards and AXS members get exclusive ticket access from Tuesday, Oct. 27 to Thursday, Oct. 29; public sales start Friday, Oct. 30 at 10 a.m. PT.

LAS VEGAS, Oct. 26, 2026 /PRNewswire / -- Rafael Nadal, a 22-time Grand Slam singles champion, will return to the hard courts for the first time since retiring from professional tennis in November 2024 to headline "The MGM Slam Presented by Capital One" Sunday, Feb. 28, 2027 at T-Mobile Arena in Las Vegas.

The MGM Slam Presented by Capital One

"I remember how impressive it was to feel the energy of a full arena in a city like Las Vegas," said Nadal. "After that match in 2024, now I return in a different stage of my life, without the pressure of the tour but with the same passion for this sport. I have always loved competing, and even if my professional career is finished, that feeling never really goes away. I want to thank MGM Resorts and Capital One for the invitation and for making this event possible. Being on court again at T-Mobile Arena, against one of today's top players, is a beautiful opportunity to enjoy tennis and give something back to the fans who supported me for so many years. I hope everyone who comes has a great time, and I will do my best to give them a night to remember."

MGM Rewards and AXS members will have priority access for pre-sale tickets to "The MGM Slam Presented by Capital One" from Tuesday, Oct. 27 at 10 a.m. PT to Thursday, Oct. 29 at 10 p.m. PT, or while pre-sale tickets last. The public on-sale is scheduled to begin Friday, Oct. 30 at 10 a.m. PT via AXS.com . In the coming weeks, Capital One rewards cardholders will have the opportunity to secure exclusive ticket packages featured on Capital One Entertainment.

For the fourth consecutive year, "The MGM Slam Presented by Capital One" will represent a cornerstone of the spring professional tennis calendar, featuring Nadal, along with some of the world's current top professional tennis players all competing for a top prize pool. The additional players, the official event format, and broadcast partner will be announced in the coming weeks.

Ryan Abboushi, MGM Resorts' President of Entertainment, said, "Las Vegas is the stage for champions, and we are ecstatic to have Rafael Nadal, one of the greatest champions in tennis history, return for 'The MGM Slam.' His presence elevates the entire event and reinforces our reputation for delivering world-class sports and entertainment."

Nadal, who won a record 14 French Open singles titles, faced fellow Spaniard Carlos Alcaraz at T-Mobile Arena in 2024 in a sold-out match streamed worldwide on Netflix. In 2026, at "The MGM Slam Presented by Capital One," eight ATP men's stars, including top-ranked American Taylor Fritz, competed in an exciting 10-point tiebreaker format. Brazil's teenage superstar Joao Fonseca defeated American Reilly Opelka to win the event.

Prompts

MGM Resorts International (ticker MGM), listed in United States.

Company History

Date Change Detail
Sep 1, 2022 Acquired Acquired LeoVegas AB (CIK 549300Z1CNOA0L1K8J51). Its filings from before the deal are on its own company page, not shown here.
Jun 18, 2010 Renamed MGM MIRAGE → MGM RESORTS INTERNATIONAL
Sep 8, 2000 Renamed MGM GRAND INC → MGM MIRAGE

ETFs Holding MGM Resorts International

ETF Weight in ETF Shares Market value As of
NITE 4.52% 31,486 $ 1.403M Jul 31, 2026
DUSA 4.37% 1,247,675 $ 55.609M Jul 31, 2026
DWLD 3.40% 465,808 $ 20.761M Jul 31, 2026
YALL 1.45% 32,185 $ 1.07M Nov 17, 2026
HGRO 1.19% 33,657 $ 1.5M Jul 31, 2026
TAX 1.17% 7,206 $ 298.04K Aug 31, 2026
WTV 0.74% 458,147 $ 21.904M Jun 30, 2026
CDX short -0.20% -14,430.2737 $ -481.25K Nov 17, 2026
EBI 0.19% 31,482 $ 1.302M Aug 31, 2026
REMC 0.19% 131 $ 6,263.11 Jun 30, 2026
SHRT 0.16% 625 $ 20.769K Nov 17, 2026
IEDI 0.16% 985 $ 43.901K Jul 31, 2026
VFMF 0.15% 34,232 $ 1.416M Aug 31, 2026
IALT 0.13% 317,113 $ 10.538M Nov 16, 2026
GVLU 0.10% 7,826 $ 260.058K Nov 17, 2026
ACVF 0.08% 2,835 $ 126.356K Jul 31, 2026
MSSM 0.07% 11,950 $ 494.252K Aug 31, 2026
AVMC 0.06% 9,988 $ 331.901K Nov 16, 2026
VFMO 0.06% 27,539 $ 1.139M Aug 31, 2026
VSLU 0.06% 6,495 $ 310.526K Jun 30, 2026
DFUV 0.04% 210,095 $ 6.984M Nov 12, 2026
GSPY 0.03% 6,426 $ 213.536K Nov 17, 2026
DFAC 0.02% 641,243 $ 21.315M Nov 12, 2026
VFVA 0.02% 5,390 $ 222.93K Aug 31, 2026
SFGV 0.02% 5,297 $ 180K Nov 18, 2026
DCOR 0.02% 262,371 $ 8.721M Nov 12, 2026
DXUV 0.02% 29,806 $ 990.751K Nov 12, 2026
DFSU 0.01% 9,695 $ 322.262K Nov 12, 2026
DFAU 0.01% 44,333 $ 1.474M Nov 12, 2026
HCMT 0.01% 1,338 $ 59.635K Jul 31, 2026
AVUS 0.01% 23,002 $ 764.356K Nov 16, 2026
AVLC 0.01% 4,243 $ 140.995K Nov 16, 2026
JUSA 0.01% 2,354 $ 78.506K Nov 17, 2026
MSLC 0.01% 8,828 $ 365.126K Aug 31, 2026
DFUS 0.01% 57,488 $ 1.911M Nov 12, 2026
DFAT 0.01% 54,163 $ 1.8M Nov 12, 2026
FMDE 0.00% 288 $ 13.769K Jun 30, 2026
CSHP 0.00% 130 $ 4,319.90 Nov 16, 2026
CORO 0.00% 111 $ 3,684.38 Nov 16, 2026