May 6, 2026 PDF Version Annapolis Mall Aerial Aerial view of Annapolis Mall in Annapolis, Maryland. (Courtesy: Macerich) Annapolis Mall Exterior Exterior view of Annapolis Mall in Annapolis, Maryland. (Courtesy: Macerich) Attractive Yield Including…
May 6, 2026
PDF Version
Annapolis Mall Aerial
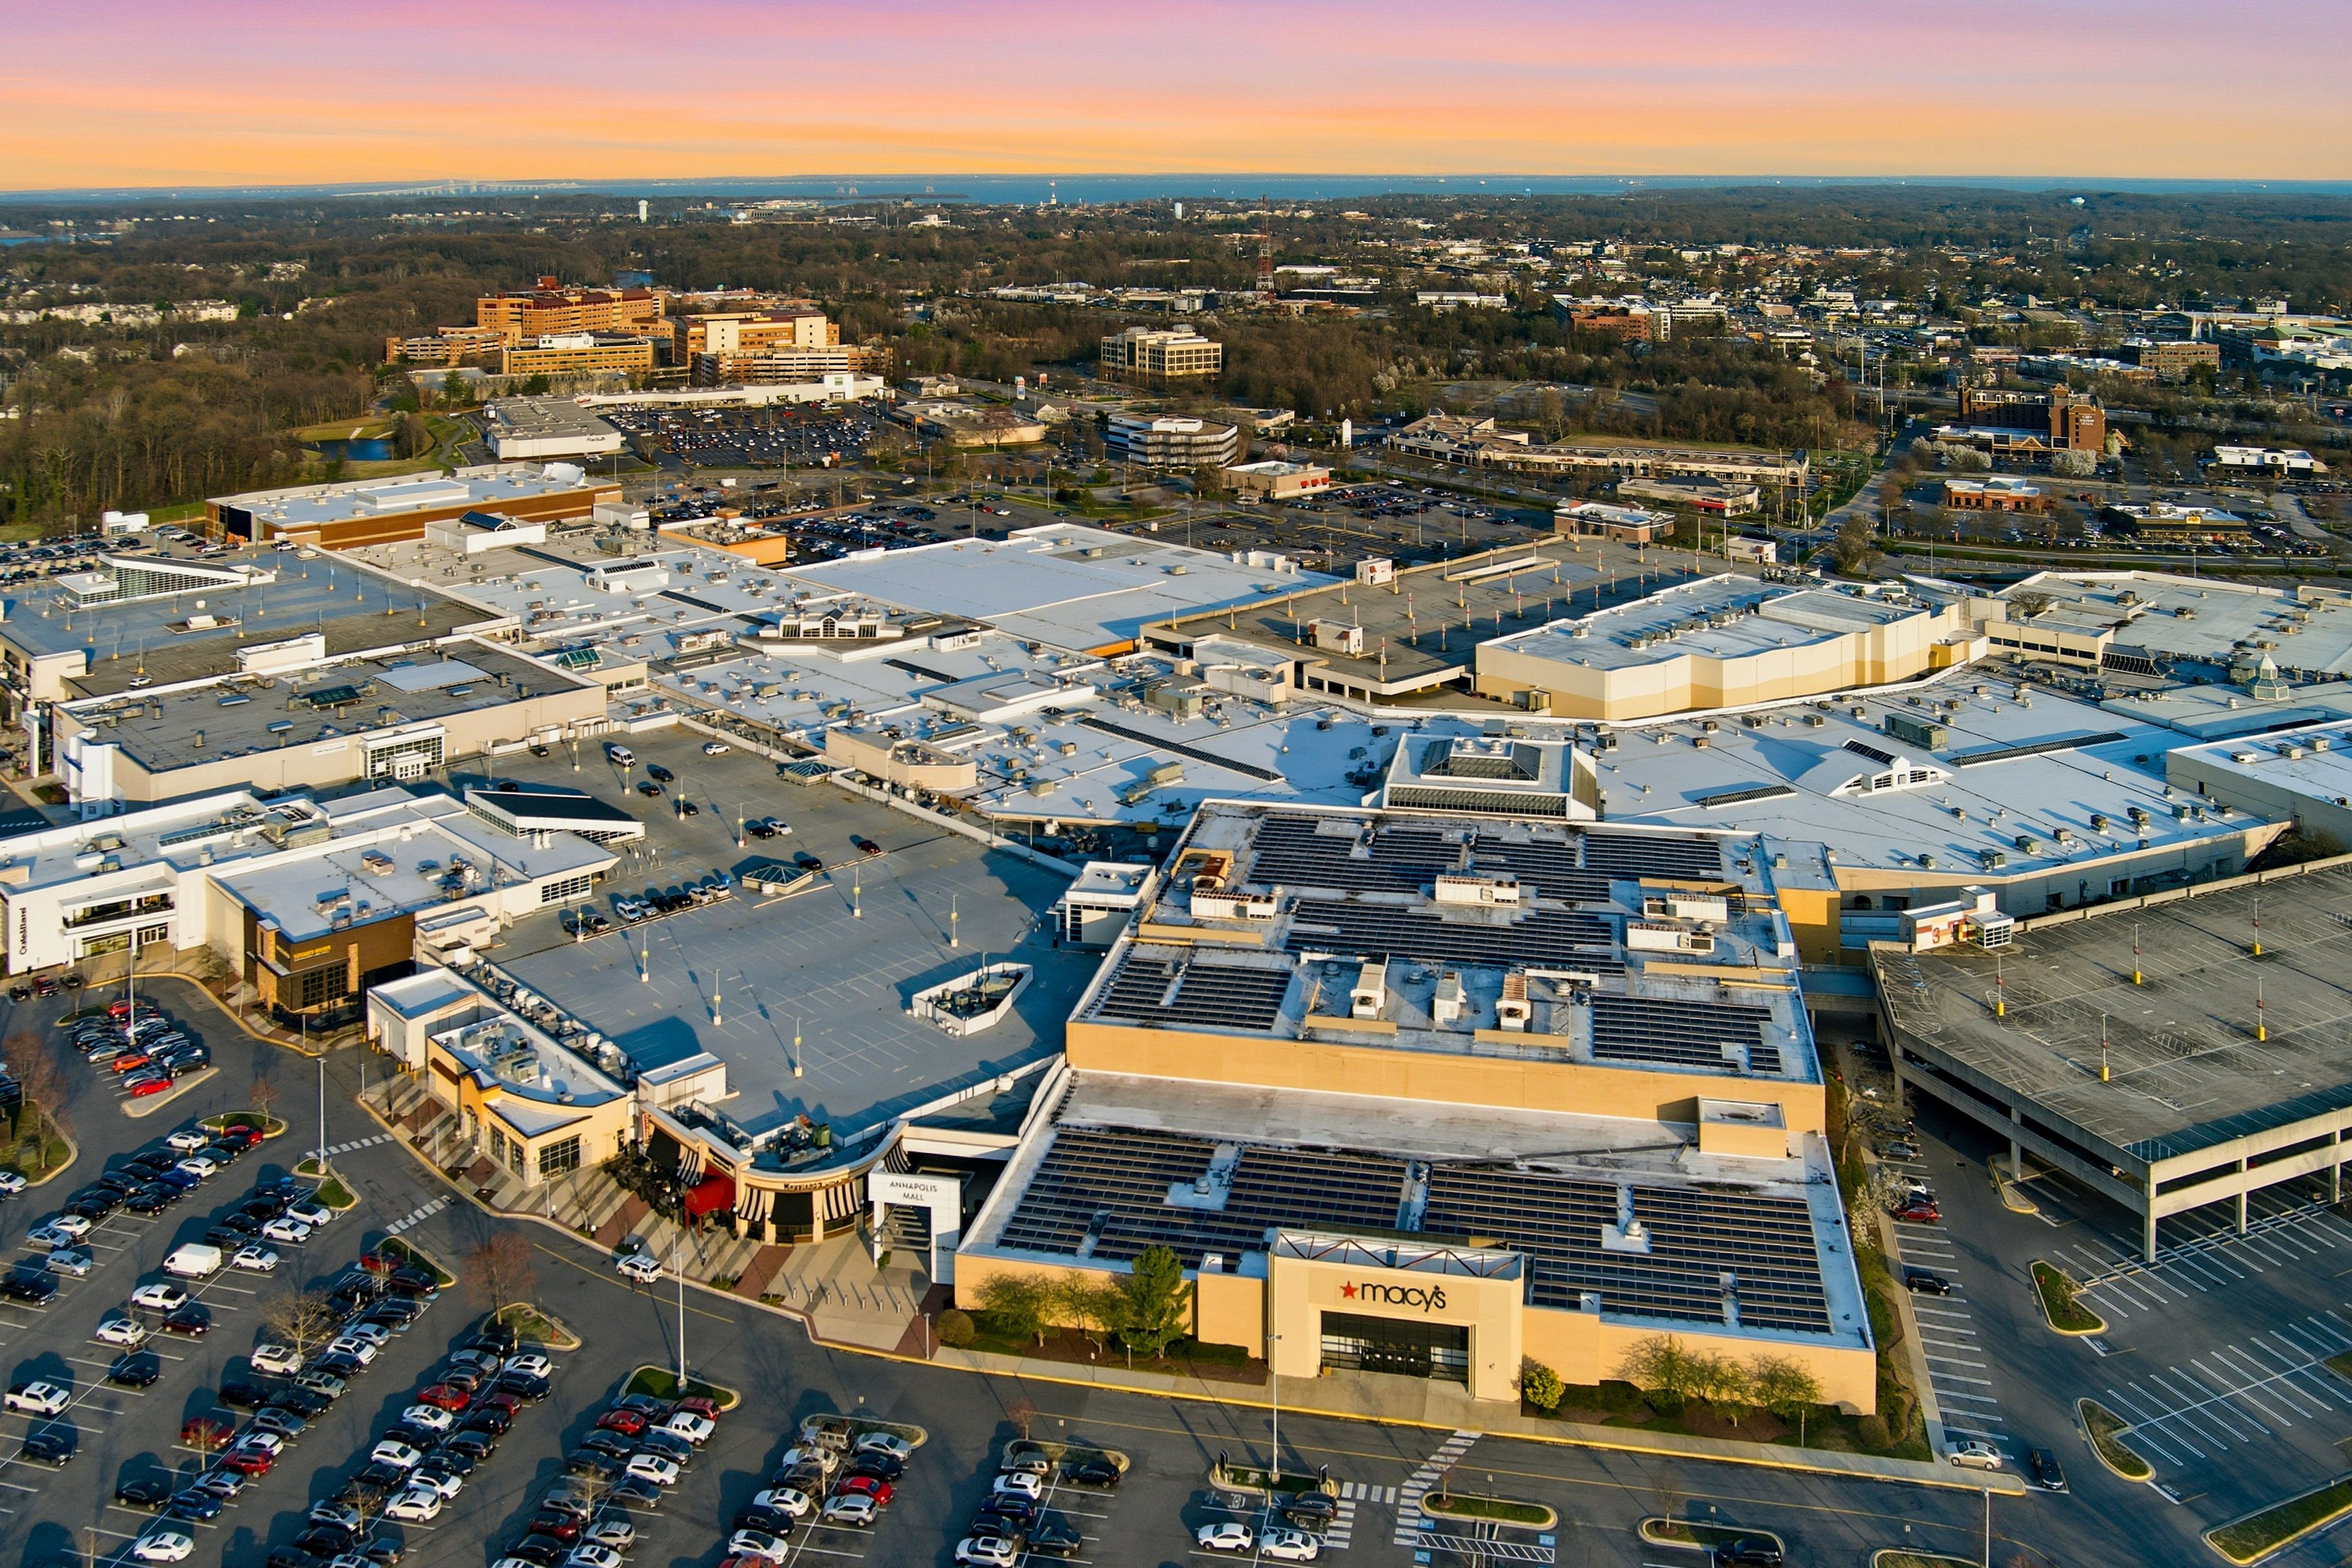
Aerial view of Annapolis Mall in Annapolis, Maryland. (Courtesy: Macerich)
Annapolis Mall Exterior
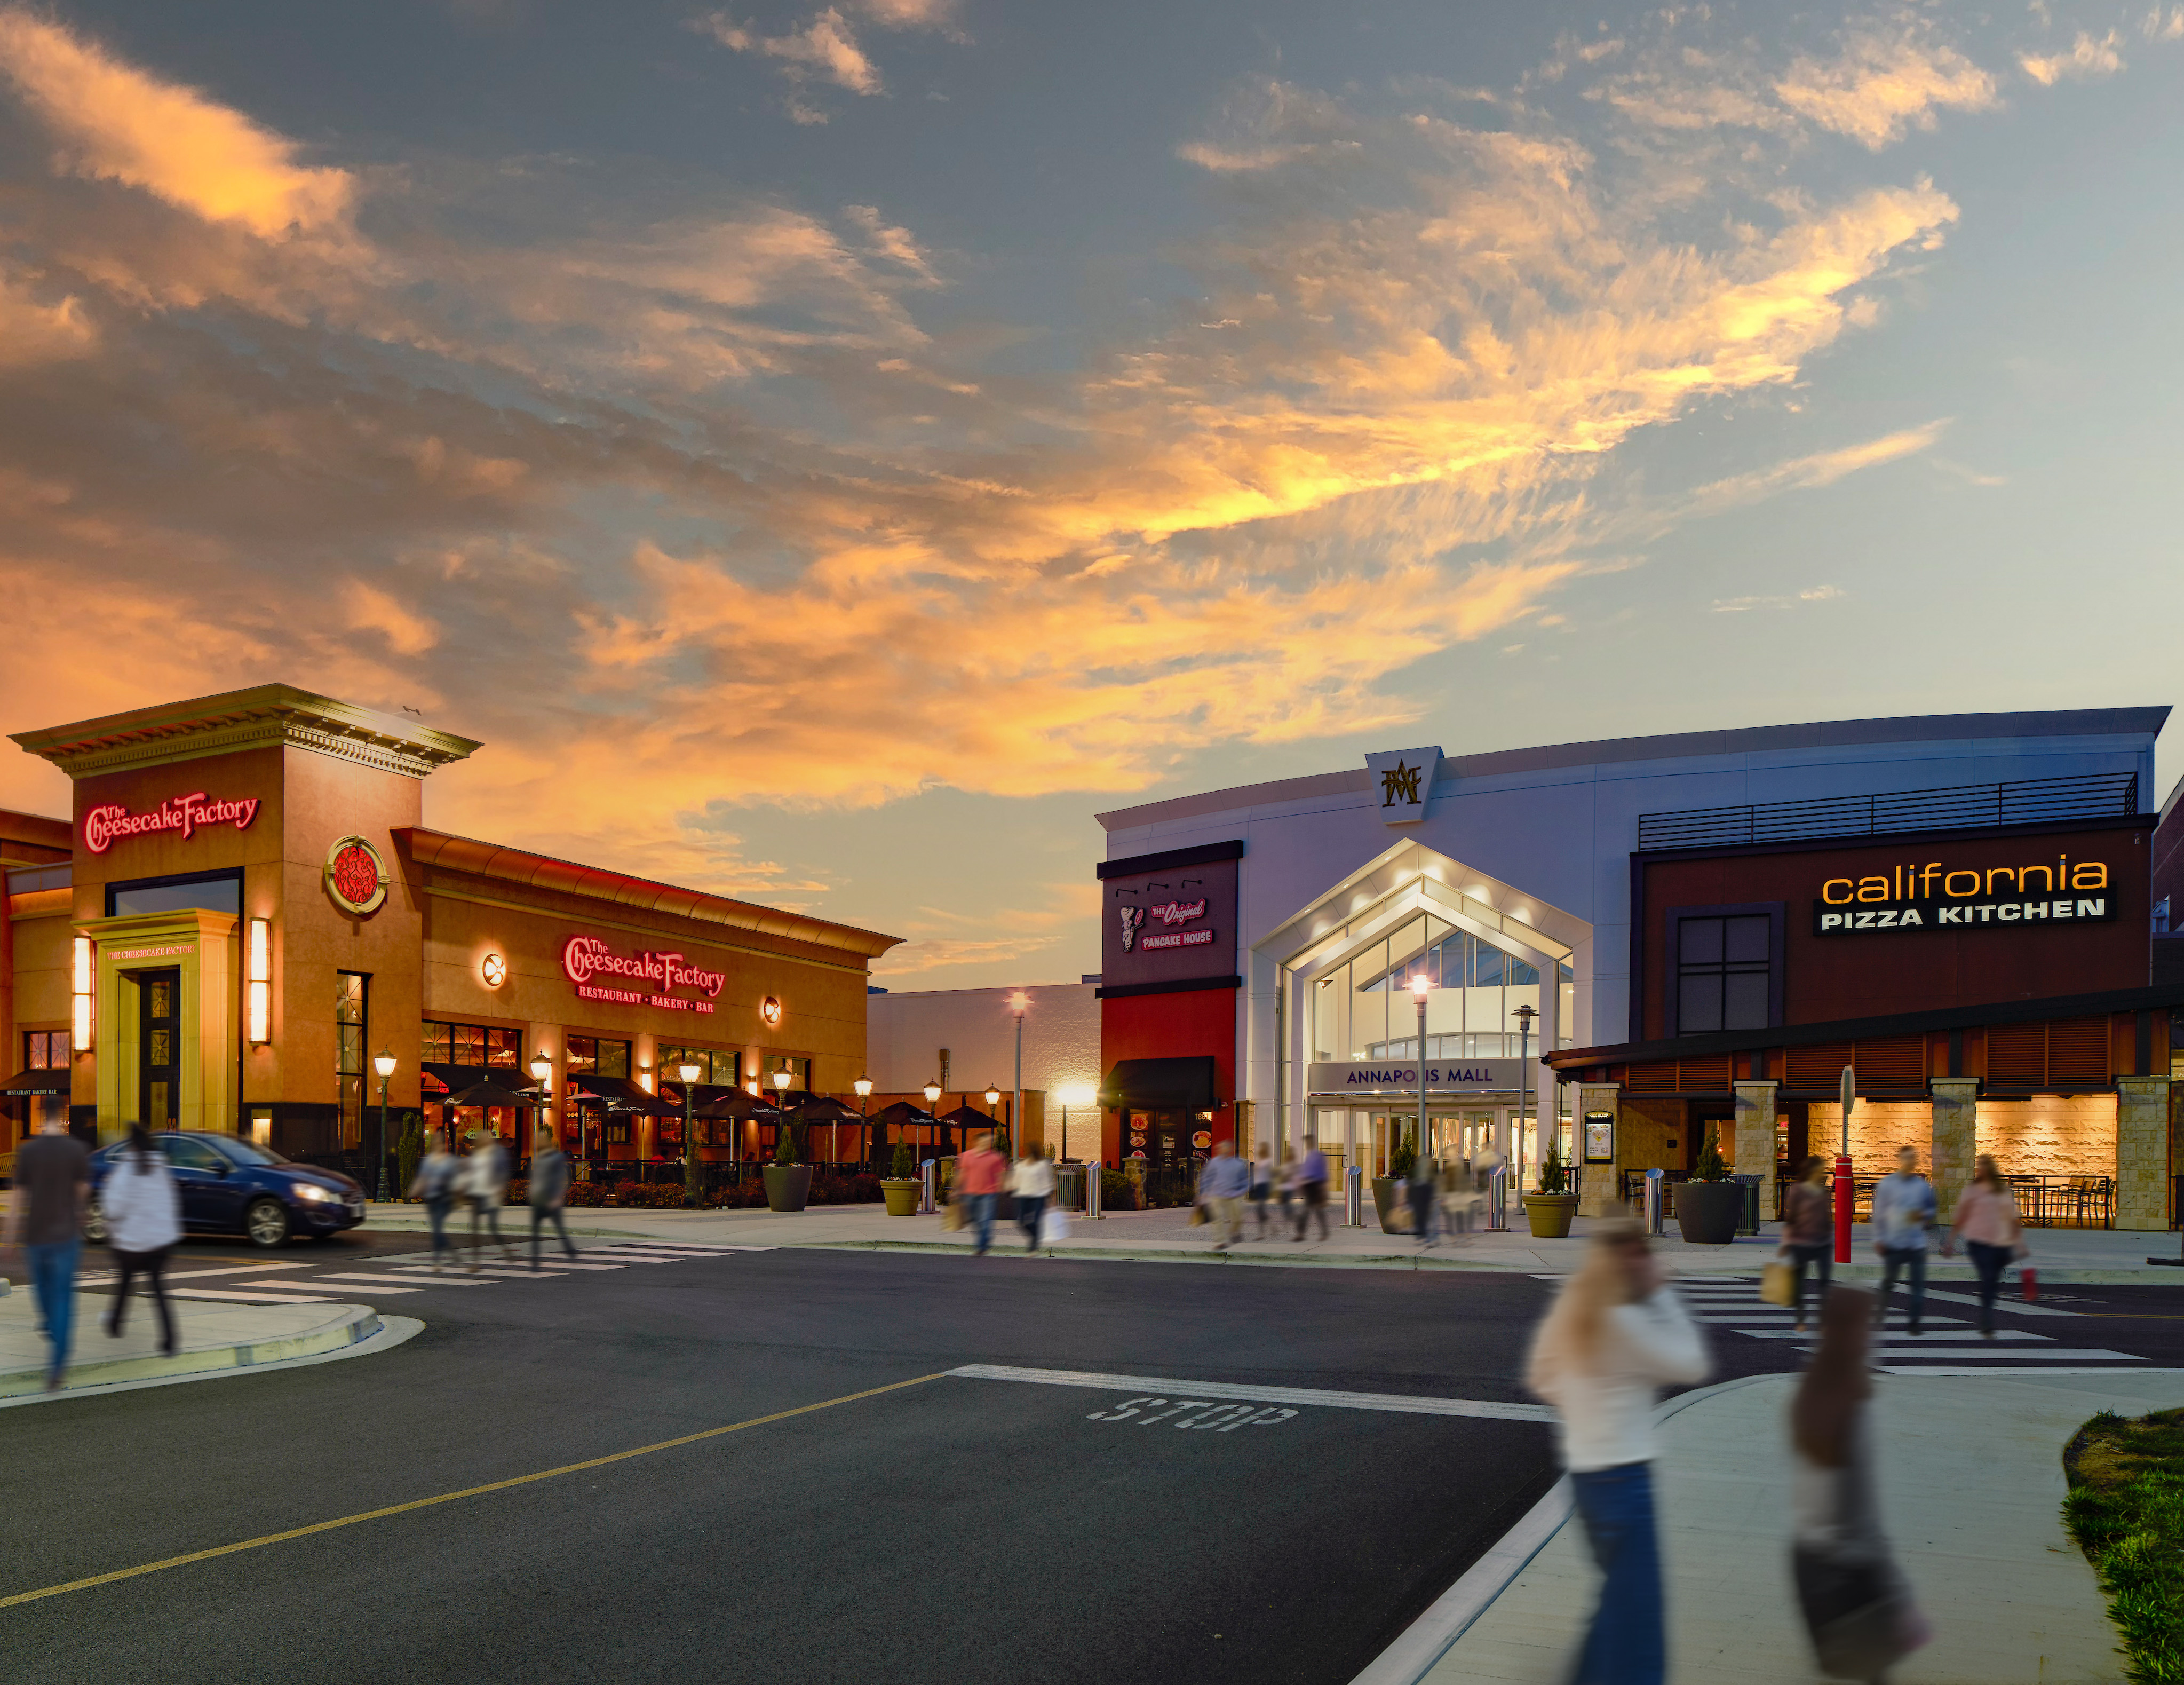
Exterior view of Annapolis Mall in Annapolis, Maryland. (Courtesy: Macerich)
Attractive Yield Including SNO of Approximately 10.5% with Compelling Opportunity to Elevate and Transform Through New Remerchandising Plan; Accretive to Path Forward Plan
SANTA MONICA, Calif., May 06, 2026 (GLOBE NEWSWIRE) -- The Macerich Company (NYSE: MAC) (the “Company” or “Macerich”), a leading owner, operator and developer of major retail properties in top markets, today announced it has acquired Annapolis Mall, a Class A retail center totaling approximately 1.5 million square feet (1.2 million square feet owned) in Annapolis, MD for $260 million, plus the adjacent 13.1-acre vacant Sears parcel for $12 million.
“Annapolis is exactly the kind of acquisition we said we would pursue,” said Jackson Hsieh, President and Chief Executive Officer, Macerich. “It’s located within a strong trade area with limited competition, the property is undergoing a significant elevation and transformation of its merchandising plan and tenant mix, including a new Dick’s House of Sport store opening in the Fall, and there is a clear path to durable NOI growth that is accretive to our 2028 target FFO ranges under the Path Forward Plan. This off market transaction was completed with the prior ownership group who did an excellent job over the past two years starting a significant elevation and transformation of the center’s merchandising plan and tenant mix. We believe applying the resources of Macerich will replicate the success we’ve experienced at Crabtree and across our Go-Forward portfolio.”
Macerich expects a yield on the Annapolis Mall acquisition of approximately 9.2% based on estimated Year 1 net operating income (“NOI”) of approximately $24 million and a yield of approximately 10.5% based on an estimated Year 1 NOI of approximately $29 million, which includes annualized signed-not-open leases (“SNO”). The SNO leases represent 353,000 square feet expected to commence in 2026 and 2027. The stabilized pro forma yield is expected to increase to approximately 11.0% by 2030. Following the acquisition, the Company plans to implement a strategic investment plan at the property that includes investing approximately $40 million of leasing capital in addition to significant capital invested over the past two years by the prior owner to begin the transformation and repositioning of the center.
The SNO pipeline includes Dick’s House of Sport, which will open a 116,000-square-foot store in August 2026, as well as Dave & Busters, Tesla, Uniqlo, lululemon (expansion), OFFLINE by Aerie, Aeropostale, Abercombie & Fitch, Pop Mart, Jack & Jones and others. Several new inline tenants including Urban Planet, DTLR, Talbots, upgraded Hollister, and others have already opened at the center in the first quarter of 2026.
The acquisition excludes the Macy’s anchor, which is not owned, and a vacant JCPenney anchor store that is being actively retenanted. The adjacent 13.1-acre vacant Sears parcel, acquired separately for $12 million, sits on the most heavily trafficked corner of the property and provides optionality for future retail, mixed-use or alternative development.
Macerich has funded the acquisition with cash on hand, which includes approximately $85 million of proceeds through the Company’s ATM program, and $150 million of borrowings on its revolving line of credit. The financing of the acquisition is expected to keep the Company within its previously stated de-leveraging targets under the Path Forward Plan.
Hsieh added, “This property complements Tysons Corner and gives us control of the dominant retail position east of Washington, D.C. There is strong initial leasing momentum underway with 353,000 square feet of committed tenants opening in 2026 to 2027. Deploying our leasing, management and marketing platforms will drive total occupancy toward 93%-plus, and we expect to capture significant NOI growth upside as well as lift sales productivity to over $800 per square foot.”
The Annapolis market benefits from its proximity to Washington, D.C. and Baltimore, a strong military and government employment base anchored by the United States Naval Academy, Fort Meade and the National Security Agency, and a highly educated and affluent consumer demographic. Anne Arundel County has a median household income above the national average and a population that has grown steadily over the past decade. Annapolis Mall’s trade area is well-insulated, with limited new retail supply and no competing enclosed regional mall of comparable scale.
About Annapolis Mall
Annapolis Mall is a dominant enclosed regional mall serving the greater Annapolis and Anne Arundel County market. The center totals approximately 1.5 million square feet and features Macy’s, AMC Theatres, Zara, Apple, The Cheesecake Factory, Urban Outfitters, Foot Locker, Hollister, American Eagle, Lululemon, Crate & Barrel and Maggiano’s, among many others.
About Macerich (NYSE: MAC)
Macerich (NYSE: MAC) is a fully integrated, self-managed, self-administered real estate investment trust (REIT). As a leading owner, operator, and developer of high-quality retail real estate in densely populated and attractive U.S. markets, Macerich’s portfolio is concentrated in California, the Pacific Northwest, Phoenix/Scottsdale, and the Metro New York to Washington, D.C. corridor. Developing and managing properties that serve as community cornerstones, Macerich currently owns approximately 41 million square feet of real estate, consisting primarily of interests in 39 retail centers. Macerich is firmly dedicated to advancing environmental goals, social good and sound corporate governance. For more information, please visit www.Macerich.com.
Macerich uses, and intends to continue to use, its Investor Relations website, which can be found at investing.macerich.com, as a means of disclosing material nonpublic information and for complying with its disclosure obligations under Regulation FD. Additional information about Macerich can be found through social media platforms such as LinkedIn. Reconciliations of non-GAAP financial measures, including NOI and FFO, to the most directly comparable GAAP measures are included in the earnings release and supplemental filed on Form 8-K with the SEC, which are posted on the Investor Relations website at investing.macerich.com.
Forward-Looking Information
This release contains statements that constitute forward-looking statements, which can be identified by the use of words, such as “will,” “expects,” “pro forma”, “anticipates,” “assumes,” “believes,” “estimated,” “guidance,” “potential,” “target,” “projects,” “scheduled” and similar expressions that do not relate to historical matters, and includes expectations regarding the Company’s future operational results, including in connection with the acquisition of the Annapolis Mall and the Path Forward Plan and its ability to meet the established goals under such Plan, including de-leveraging targets, growth rates and acquisition and disposition goals, as well as development, redevelopment and expansion activities. Stockholders are cautioned that any such forward-looking statements are not guarantees of future performance and involve risks, uncertainties and other factors that may cause actual results, performance or achievements of the Company to vary materially from those anticipated, expected or projected. Such factors include, among others, general industry, as well as global, national, regional and local economic and business conditions, including the impact of geopolitical tensions, tariffs, elevated interest rates and inflation, which will, among other things, affect demand for retail space or retail goods, availability and creditworthiness of current and prospective tenants, anchor or tenant bankruptcies, closures, mergers or consolidations, lease rates, terms and payments, elevated interest rates and its impact on the financial condition and results of operations of the Company, including as a result of any increased borrowing costs on the Company’s outstanding floating-rate debt and defaults on mortgage loans, availability, terms and cost of financing and operating expenses; adverse changes in the real estate markets including, among other things, competition from other companies, retail formats and technology, risks of real estate development and redevelopment (including elevated inflation, supply chain disruptions and construction delays), acquisitions and dispositions; adverse impacts from any pandemic, epidemic or outbreak of any highly infectious disease on the U.S., regional and global economies and the financial condition and results of operations of the Company and its tenants; the liquidity of real estate investments; government shutdowns and other governmental actions and initiatives (including legislative and regulatory changes); environmental and safety requirements; and terrorist activities or other acts of violence, which could adversely affect all of the above factors. The reader is directed to the Company’s various filings with the Securities and Exchange Commission, including the Annual Report on Form 10-K for the year ended December 31, 2025, for a discussion of such risks and uncertainties, which discussion is incorporated herein by reference. You are cautioned not to place undue reliance on these forward-looking statements, which speak only as of the date of this release. The Company does not intend, and undertakes no obligation, to update any forward-looking information to reflect events or circumstances after the date of this release or to reflect the occurrence of unanticipated events unless required by law to do so.
**INVESTOR CONTACT:**Investor Relations, [email protected]
**MEDIA CONTACT:**Arun Khosla, VP Corporate Communications
[email protected]
Photos accompanying this announcement are available at
https://www.globenewswire.com/NewsRoom/AttachmentNg/5e3d6ce6-7eb7-4125-9620-2f2e3b3768fa
https://www.globenewswire.com/NewsRoom/AttachmentNg/45620ff8-0edd-4f00-93cf-f99991f22416


