October 21, 2026
DENVER--(BUSINESS WIRE)-- Liberty Energy Inc. (NYSE: LBRT; “Liberty” or the “Company”) today reported third quarter 2026 financial and operational results.
Summary Results and Highlights
- Revenue of $1.2 billion, a 26% year-over-year increase
- Net loss of $39 million, or $(0.24) fully diluted earnings per share (“EPS”) and Adjusted Net Income1 of $10 million, or $0.06 Adjusted Net Income per Diluted Share1
- Adjusted EBITDA2 of $142 million
- Distributed $15 million to shareholders through cash dividends
- Increased quarterly cash dividend by 11% to $0.10 per share beginning fourth quarter of 2026
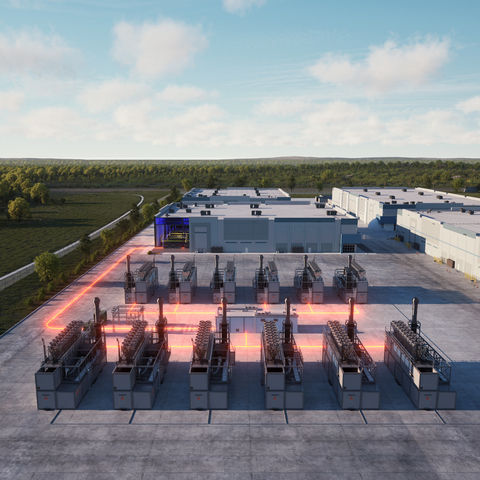
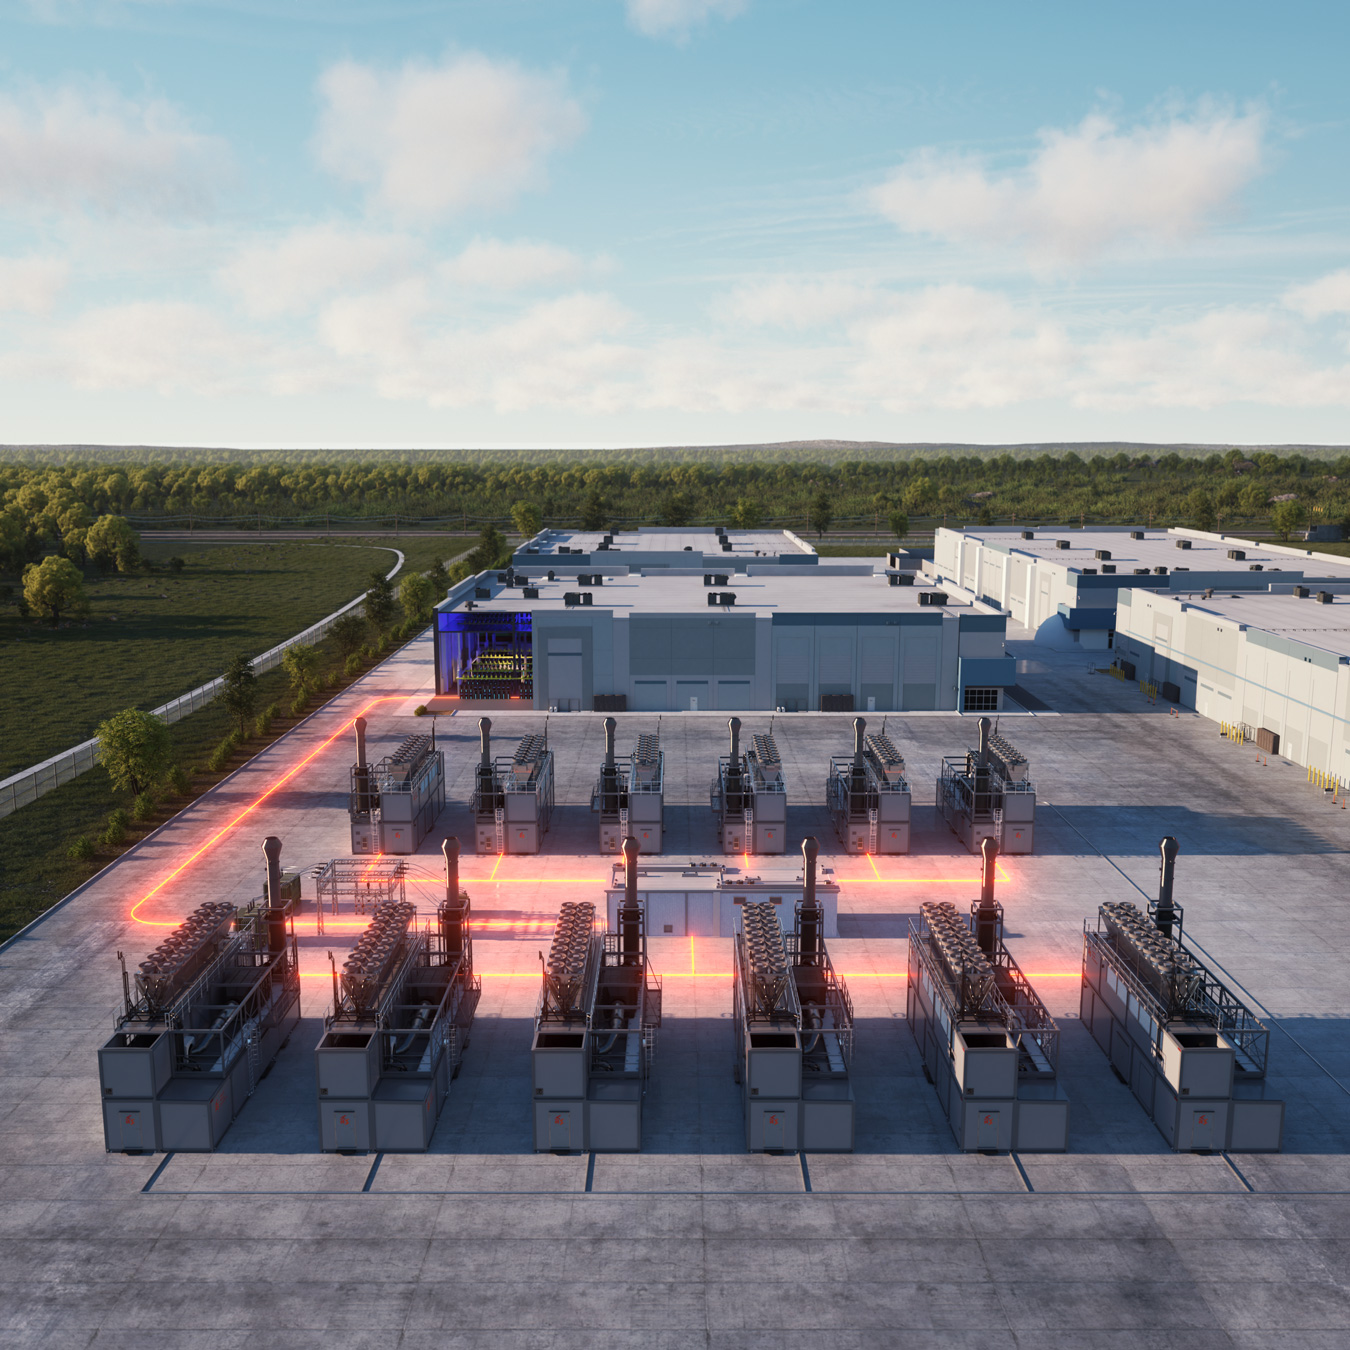
- Executed a strategic development agreement with a leading frontier AI lab and a dedicated infrastructure platform to deliver 1.2 GW of integrated power services at data center campuses
- Collaborated with the U.S. Department of Energy’s National Laboratory of the Rockies at its advanced grid simulation testbed, successfully validating Liberty’s power technologies under real-world grid conditions
- Achieved record natural gas substitution across our frac fleets, driven by continued investment in natural gas fueled equipment and optimization through Liberty’s digital intelligence layer
“Liberty's completions trajectory has improved meaningfully from early year cyclical lows. Strong customer engagement and strengthening market fundamentals provide a more constructive outlook as we close out the year. Third quarter revenue of $1.2 billion and Adjusted EBITDA of $142 million reflected strong operational execution and modest price increases, partially offset by drilling-related delays and cost inflation headwinds,” commented Ron Gusek, Chief Executive Officer. “During the quarter, we delivered significantly lower fuel costs for our customers. Record natural gas substitution of over 60% of the total fuel consumed by our fleets provided annualized fuel savings of over $1 billion for our customers. This achievement reflects continued investment in natural gas fueled equipment and a concerted focus on the digital intelligence layer that drives meaningful operational optimization of equipment and widens the performance gap amongst industry frac fleets.”
“In power, we are excited to share that Liberty Power Innovations (“LPI”) entered into a strategic development agreement with a leading frontier AI lab and a dedicated infrastructure platform for 1.2 GW of integrated power services at data center campuses. The agreement includes a significant prepayment of capacity fees and targeted execution of the first energy service agreement (“ESA”) contract for approximately 500 megawatts ("MW") by December 2026. The agreement also establishes a phased energization schedule from Q4 2027 through Q1 2029 and includes the substantive commercial terms for the additional long-term ESAs. This is the culmination of months of work on engineering and design between our teams, defining the integrated power architecture tailored to the generation, power quality, reliability and dynamic AI load requirements,” commented Mr. Gusek. “We see significant opportunity to expand this relationship and are already working together to advance additional projects across other sites, including gas supply, interconnection, permitting and construction planning.”
“We are building a durable portfolio across completions and power, anchored by the principles that have long defined Liberty: a relentless focus on our customers, continuous technology innovation, and disciplined execution. In completions, these capabilities have helped our customers improve performance and economics year after year, and we are applying that same approach in power as we develop differentiated solutions to meet the increasingly complex objectives of technology customers,” continued Mr. Gusek. “These dual investments are strengthening our competitive advantage and expanding our market opportunities, positioning us to generate strong returns through cycles. Earlier this week we announced an 11% increase in our quarterly cash dividend, reflecting confidence in our strategy and a continued commitment to delivering long-term shareholder value.”
Outlook
Global oil and refined product prices strengthened during the third quarter, as the ongoing conflicts in the Middle East and Ukraine continue to impact markets. While flows through the Strait of Hormuz partially recovered, Gulf exports remain vulnerable to operational disruption, sustaining a risk premium in crude oil prices. Renewed attacks on energy infrastructure have exacerbated refined product shortages, with low diesel inventories emerging as a critical constraint. Elevated maritime freight costs and longer trade routes have further compounded these pressures, increasing delivered crude and product costs. Expectations for a prolonged supply disruption and an eventual replenishment of strategic petroleum reserves have sustained the oil risk premium and lifted forward prices.
North American natural gas fundamentals remain more balanced, as strong summer power demand was outpaced by record production and ample inventories. Disruptions to Qatari gas supply have also increased reliance on U.S. LNG, including replacement cargoes required to fulfill existing customer commitments. Longer term, LNG exports and growing power consumption from AI and data center development are expected to drive significant demand growth.
Against this backdrop, producer well economics have strengthened meaningfully, with a more constructive forward curve providing attractive 2027 oil hedging opportunities and enhancing E&P revenue visibility. These improving fundamentals further reinforce already tight frac market dynamics, where modestly higher completions activity has absorbed much of the industry’s available capacity. Ongoing fleet attrition, equipment cannibalization and industry underinvestment have constrained supply, particularly in next generation equipment with compelling gas arbitrage economics. Increasing completion intensity and complexity also favor scaled providers with integrated services and advanced digital technologies. Together, these dynamics are supporting more durable frac markets and continued improvement in service pricing.
As AI accelerates demand for compute capacity, infrastructure developers are increasingly leveraging co-located integrated power solutions for data center campuses and other large load sites to address growing community considerations around power costs, availability, and other concerns. Beyond accelerating energization timelines and enabling tailored energy configurations, co-location can reduce pressure on existing grid infrastructure and limit the need for costly transmission investment, helping mitigate impacts on local ratepayers and communities. Liberty’s partnerships broaden the capabilities we can bring to these projects, combining our power services with complementary technologies and infrastructure solutions, including hybrid power systems, advanced energy management and waste-heat recovery. Over time, this integrated approach creates opportunities to address overall energy efficiency while providing customers greater flexibility to address environmental and community priorities specific to each site.
“Today’s announcement with a frontier AI lab underscores the strength of our integrated power platform and its ability to advance our customers’ broader strategic objectives. Our relationship has been built on trust, collaboration, and a shared commitment to advancing AI infrastructure at scale,” commented Mr. Gusek. “Over the past year, we have built a strong foundation spanning power design and architecture, power quality and load management, testing and validation, and long-term operations needed to support this project and others like it. We are excited to support a growing base of customers seeking reliable, high-performance power infrastructure for data centers and other industrial applications.”
“North American oil and gas markets are increasingly constructive as global energy consumers place greater emphasis on secure, reliable energy supplies. Our disciplined investment in leading edge digital and equipment technologies through cycles expands our competitive advantage and increases our market opportunities over the coming years,” commented Mr. Gusek. “Looking forward, we expect fourth quarter weather and holiday seasonality to be partially offset by continued strength in demand, including activity deferred from the third quarter. We’re proud of the Liberty team’s continued focus on ingenuity, innovation, and execution. We are well positioned today to serve the demand for energy services in the years ahead.”
Cash Dividend
During the quarter ended September 30, 2026, the Company paid a quarterly cash dividend of $0.09 per share of Class A common stock, or approximately $15 million in aggregate to shareholders.
On October 20, 2026, the Board declared a cash dividend of $0.10 per share of Class A common stock, to be paid on December 18, 2026 to holders of record as of December 4, 2026.
Future declarations of quarterly cash dividends are subject to approval by the Board of Directors and to the Board’s continuing determination that the declarations of dividends are in the best interests of Liberty and its stockholders. Future dividends may be adjusted at the Board’s discretion based on market conditions and capital availability.
Third Quarter Results
For the third quarter of 2026, revenue was $1.2 billion, an increase of 26% from $0.9 billion in the third quarter of 2025 and an increase of 1% from $1.2 billion in the second quarter of 2026.
Net loss (after taxes) totaled $39 million for the third quarter of 2026 compared to net income of $43 million in the third quarter of 2025 and net income of $43 million in the second quarter of 2026.
Adjusted Net Income1 totaled $10 million for the third quarter of 2026 compared to an adjusted net loss of $10 million in the third quarter of 2025 and an adjusted net income of $14 million in the second quarter of 2026.
Adjusted EBITDA2 of $142 million for the third quarter of 2026 increased 11% from $128 million in the third quarter of 2025 and decreased 6% from $151 million in the second quarter of 2026.
Fully diluted earnings per share of $(0.24) for the third quarter of 2026 compared to $0.26 for the third quarter of 2025 and $0.26 for the second quarter of 2026.
Adjusted Net Income per Diluted Share1 of $0.06 for the third quarter of 2026 compared to $(0.06) for the third quarter of 2025 and $0.09 for the second quarter of 2026.
Please refer to the tables at the end of this earnings release for a reconciliation of Adjusted EBITDA, Adjusted Net Income, and Adjusted Net Income per Diluted Share (each, a non-GAAP financial measure) to the most directly comparable GAAP financial measures.
Balance Sheet and Liquidity
As of September 30, 2026, Liberty had cash on hand of $119 million and total debt of approximately $1.3 billion, primarily consisting of the senior convertible notes issued during the first quarter of 2026. As of September 30, 2026, the Company had no balance drawn on the secured asset-based revolving credit facility, except for $30.2 million in letters of credit outstanding. Total liquidity, including availability under the credit facility, was approximately $669 million as of September 30, 2026.
Conference Call
Liberty will host a conference call to discuss the results at 8:00 a.m. Mountain Time (10:00 a.m. Eastern Time) on Thursday, October 22, 2026. Presenting Liberty’s results will be Ron Gusek, President and Chief Executive Officer, and Michael Stock, Chief Financial Officer.
Individuals wishing to participate in the conference call should dial (833) 255-2827, or for international callers, (412) 902-6704. Participants should ask to join the Liberty Energy call. A live webcast will be available at http://investors.libertyenergy.com . The webcast can be accessed for 90 days following the call. A telephone replay will be available shortly after the call and can be accessed by dialing (855) 669-9658, or for international callers (412) 317-0088. The passcode for the replay is 3483884. The replay will be available until October 29, 2026.
About Liberty
Liberty Energy Inc. (NYSE: LBRT) is a leading energy services company. Liberty is one of the largest providers of completion services and technologies to onshore oil, natural gas, and enhanced geothermal energy producers in North America. Liberty also owns and operates Liberty Power Innovations LLC, providing advanced distributed power and energy storage solutions, supported by strategic relationships across advanced nuclear, enhanced geothermal, and battery energy storage systems, serving the commercial and industrial, data center, energy, and mining industries. Liberty was founded in 2011 with a relentless focus on value creation through a culture of innovation and excellence and the development of next generation technology. Liberty is headquartered in Denver, Colorado. For more information, please visit www.libertyenergy.com and www.libertypowerinnovations.com , or contact Investor Relations at [email protected] .
| 1 “Adjusted Net Income” and “Adjusted Net Income per Diluted Share” are not presented in accordance with U.S. GAAP. Please see the supplemental financial information in the table under “Reconciliation of Net Income and Net Income per Diluted Share to Adjusted Net Income and Adjusted Net Income per Diluted Share” at the end of this earnings release for a reconciliation of the non-GAAP financial measures of Adjusted Net Income and Adjusted Net Income per Diluted Share to the most directly comparable GAAP financial measures. |
| 2 “Adjusted EBITDA” is not presented in accordance with generally accepted accounting principles in the United States (“U.S. GAAP”). Please see the supplemental financial information in the table under “Reconciliation of Net Income to EBITDA and Adjusted EBITDA” at the end of this earnings release for a reconciliation of the non-GAAP financial measure of Adjusted EBITDA to its most directly comparable GAAP financial measure. |
Non-GAAP Financial Measures
This earnings release includes unaudited non-GAAP financial and operational measures, including EBITDA, Adjusted EBITDA, Adjusted Net Income, Adjusted Net Income per Diluted Share, and Adjusted Pre-Tax Return on Capital Employed (“ROCE”). We believe that the presentation of these non-GAAP financial and operational measures provides useful information about our financial performance and results of operations. We define Adjusted EBITDA as EBITDA adjusted to eliminate the effects of items such as non-cash stock-based compensation, new fleet or new basin start-up costs, fleet lay-down costs, gain or loss on the disposal of assets, gain or loss on investments, net, bad debt reserves, transaction and other costs, the loss or gain on remeasurement of liability under our tax receivable agreements, and other expenses that management does not consider in assessing ongoing performance.
Our board of directors, management, investors, and lenders use EBITDA and Adjusted EBITDA to assess our financial performance because it allows them to compare our operating performance on a consistent basis across periods by removing the effects of our capital structure (such as varying levels of interest expense), asset base (such as depreciation, depletion, and amortization) and other items that impact the comparability of financial results from period to period. We present EBITDA and Adjusted EBITDA because we believe they provide useful information regarding the factors and trends affecting our business in addition to measures calculated under U.S. GAAP.
We present Adjusted Net (Loss) Income and Adjusted Net (Loss) Income per Diluted Share because we believe such measures provide useful information to investors regarding our operating performance by excluding the after-tax impacts of unusual or one-time benefits or costs, including items such as gain or loss on investments, net and transaction and other costs, primarily because management views the excluded items to be outside of our normal operating results. We define Adjusted Net (Loss) Income as net income after eliminating the effects of such excluded items and Adjusted Net (Loss) Income per Diluted Share as Adjusted Net (Loss) Income divided by the number of weighted average diluted shares outstanding. Management analyzes net income without the impact of these items as an indicator of performance to identify underlying trends in our business.
We define ROCE as the ratio of adjusted pre-tax net income (adding back income tax and certain adjustments that include tax receivable agreement impacts, gain or loss on investments, net, and transaction and other costs, when applicable) for the twelve months ended September 30, 2026 to Average Capital Employed. Average Capital Employed is the simple average of total capital employed (both debt and equity) as of September 30, 2026 and September 30, 2025. ROCE is presented based on our management’s belief that this non-GAAP measure is useful information to investors when evaluating our profitability and the efficiency with which management has employed capital over time. Our management uses ROCE for that purpose. ROCE is not a measure of financial performance under U.S. GAAP and should not be considered an alternative to net income, as defined by U.S. GAAP.
Non-GAAP financial and operational measures do not have any standardized meaning and are therefore unlikely to be comparable to similar measures presented by other companies. The presentation of non-GAAP financial and operational measures is not intended to be a substitute for, and should not be considered in isolation from, the financial measures reported in accordance with U.S. GAAP. See the tables entitled Reconciliation and Calculation of Non-GAAP Financial and Operational Measures for a reconciliation or calculation of the non-GAAP financial or operational measures to the most directly comparable GAAP financial measure.
Forward-Looking and Cautionary Statements
The information above includes “forward-looking statements” within the meaning of Section 27A of the Securities Act of 1933, as amended (the “Securities Act”), and Section 21E of the Securities Exchange Act of 1934, as amended (the “Exchange Act”), including, among others, our expected growth from recent acquisitions, expected performance, expectations regarding the success of our distributed power business, future operating results, oil and natural gas demand and prices and the outlook for the oil and gas industry, power demand and outlook for the power industry, future global economic conditions, the impact of worldwide political, military and armed conflict (including the impact of the ongoing conflict with Iran and the closure of the Strait of Hormuz), the impact of announcements and changes in oil production quotas by oil exporting countries, improvements in operating procedures and technology, our business strategy and the business strategies of our customers, the impact of policy, legislative, and regulatory changes, the deployment of fleets in the future, planned capital expenditures, future cash flows and borrowings, pursuit of potential acquisition opportunities, our financial position, return of capital to stockholders, business strategy and objectives for future operations in addition to other estimates, and beliefs. For this purpose, any statement that is not a statement of historical fact should be considered a forward-looking statement. We may use the words “estimate,” “outlook,” “project,” “forecast,” “position,” “potential,” “likely,” “believe,” “anticipate,” “assume,” “plan,” “expect,” “intend,” “achievable,” “may,” “will,” “continue,” “should,” “could” and similar expressions to help identify forward-looking statements. However, the absence of these words does not mean that the statements are not forward-looking. We cannot assure you that our assumptions and expectations will prove to be correct. Important factors, many of which are beyond our control, could cause our actual results to differ materially from those indicated or implied by forward-looking statements, including but not limited to the risks and uncertainties described in our most recently filed Annual Report on Form 10-K for the year ended December 31, 2025, (the “Annual Report”), and other filings that we make with the U.S. Securities and Exchange Commission (the “SEC”). We undertake no intention or obligation to update or revise any forward-looking statements, except as required by law, whether as a result of new information, future events or otherwise and readers should not rely on the forward-looking statements as representing the Company’s views as of any date subsequent to the date of this release. These forward-looking statements are based on management’s current belief, based on currently available information, as to the outcome and timing of future events.
All forward-looking statements, expressed or implied, included in this release are expressly qualified in their entirety by this cautionary statement. This cautionary statement should also be considered in connection with any subsequent written or oral forward-looking statements that we or persons acting on our behalf may issue.
| Liberty Energy Inc. | |||||||||||||||||||
| Selected Financial Data | |||||||||||||||||||
| (unaudited) | |||||||||||||||||||
| Three Months Ended | Nine Months Ended | ||||||||||||||||||
| September 30, | June 30, | September 30, | September 30, | ||||||||||||||||
| 2026 | 2026 | 2025 | 2026 | 2025 | |||||||||||||||
| Statement of Operations Data: | (amounts in thousands, except for per share data) | ||||||||||||||||||
| Revenue | $ | 1,196,156 | $ | 1,188,596 | $ | 947,397 | $ | 3,405,936 | $ | 2,967,379 | |||||||||
| Costs of services (exclusive of depreciation, depletion, and amortization shown separately below) | 995,049 | 980,255 | 769,761 | 2,819,121 | 2,343,484 | ||||||||||||||
| General and administrative (1) | 69,479 | 67,169 | 58,284 | 196,191 | 182,403 | ||||||||||||||
| Transaction and other costs | (215 | ) | 7,691 | — | 7,476 | 811 | |||||||||||||
| Depreciation, depletion, and amortization | 113,704 | 114,213 | 122,981 | 341,976 | 380,089 | ||||||||||||||
| (Gain) loss on disposal of assets, net | (1,165 | ) | 6,552 | (1,210 | ) | (13,126 | ) | 7,766 | |||||||||||
| Total operating costs and expenses | 1,176,852 | 1,175,880 | 949,816 | 3,351,638 | 2,914,553 | ||||||||||||||
| Operating income (loss) | 19,304 | 12,716 | (2,419 | ) | 54,298 | 52,826 | |||||||||||||
| Loss (gain) on investments, net | 62,892 | (42,913 | ) | (68,353 | ) | 2,663 | (155,883 | ) | |||||||||||
| Interest expense, net | 5,898 | 3,354 | 10,902 | 16,983 | 30,607 | ||||||||||||||
| Net (loss) income before income taxes | (49,486 | ) | 52,275 | 55,032 | 34,652 | 178,102 | |||||||||||||
| Income tax (benefit) expense | (10,423 | ) | 9,154 | 11,977 | 8,036 | 43,920 | |||||||||||||
| Net (loss) income | (39,063 | ) | 43,121 | 43,055 | 26,616 | 134,182 | |||||||||||||
| Net (loss) income per common share: | |||||||||||||||||||
| Basic | $ | (0.24 | ) | $ | 0.26 | $ | 0.27 | $ | 0.16 | $ | 0.83 | ||||||||
| Diluted (2) | $ | (0.24 | ) | $ | 0.26 | $ | 0.26 | $ | 0.16 | $ | 0.81 | ||||||||
| Weighted average common shares outstanding: | |||||||||||||||||||
| Basic | 163,191 | 163,016 | 161,959 | 162,755 | 161,921 | ||||||||||||||
| Diluted (2) | 163,191 | 167,663 | 165,066 | 166,855 | 165,126 | ||||||||||||||
| Other Financial and Operational Data | |||||||||||||||||||
| Capital expenditures (3) | $ | 621,933 | $ | 221,484 | $ | 113,034 | $ | 976,843 | $ | 367,958 | |||||||||
| Adjusted EBITDA (4) | $ | 141,630 | $ | 151,145 | $ | 127,679 | $ | 418,625 | $ | 476,627 |
| ________________ | |
| (1) | General and administrative costs for the nine months ended September 30, 2025 include $10.2 million of non-cash stock-based compensation expense related to the resignation of the Company’s former Chief Executive Officer upon confirmation as Secretary of Energy of the United States. |
| (2) | For the three months ended September 30, 2026, the Company reported a net loss. Accordingly, approximately 3.8 million potential common shares related to outstanding restricted stock units and performance stock units were excluded from the calculation of diluted loss per share because their inclusion would have been anti-dilutive. |
| (3) | Net capital expenditures presented above include investing cash flows from purchase of property and equipment, excluding acquisitions, net of proceeds from the sales of assets. |
| (4) | Adjusted EBITDA is a non-GAAP financial measure. See the tables entitled “Reconciliation and Calculation of Non-GAAP Financial and Operational Measures” below. |
| Liberty Energy Inc. | |||||||
| Condensed Consolidated Balance Sheets | |||||||
| (unaudited, amounts in thousands) | |||||||
| September 30, | December 31, | ||||||
| 2026 | 2025 | ||||||
| Assets | |||||||
| Current assets: | |||||||
| Cash and cash equivalents | $ | 118,973 | $ | 27,554 | |||
| Accounts receivable and unbilled revenue | 756,765 | 605,370 | |||||
| Inventories | 181,071 | 188,125 | |||||
| Prepaids and other current assets | 61,448 | 56,921 | |||||
| Total current assets | 1,118,257 | 877,970 | |||||
| Property and equipment, net | 2,775,804 | 2,054,185 | |||||
| Operating and finance lease right-of-use assets | 379,020 | 407,452 | |||||
| Investments | 127,300 | 123,888 | |||||
| Other assets | 89,480 | 94,810 | |||||
| Total assets | $ | 4,489,861 | $ | 3,558,305 | |||
| Liabilities and Equity | |||||||
| Current liabilities: | |||||||
| Accounts payable and accrued liabilities | $ | 739,148 | $ | 598,658 | |||
| Current portion of operating and finance lease liabilities | 106,034 | 116,598 | |||||
| Current portion of long-term debt | 11,906 | 5,097 | |||||
| Total current liabilities | 857,088 | 720,353 | |||||
| Long-term debt, net of current portion and deferred financing costs | 1,278,666 | 241,510 | |||||
| Noncurrent portion of operating and finance lease liabilities | 206,928 | 255,081 | |||||
| Deferred tax liability | 159,611 | 195,602 | |||||
| Payable pursuant to tax receivable agreements | 66,870 | 66,870 | |||||
| Total liabilities | 2,569,163 | 1,479,416 | |||||
| Stockholders’ equity: | |||||||
| Common stock | 1,632 | 1,620 | |||||
| Additional paid in capital | 842,975 | 978,384 | |||||
| Retained earnings | 1,094,997 | 1,112,747 | |||||
| Accumulated other comprehensive loss | (18,906 | ) | (13,862 | ) | |||
| Total stockholders’ equity | 1,920,698 | 2,078,889 | |||||
| Total liabilities and equity | $ | 4,489,861 | $ | 3,558,305 |
| Liberty Energy Inc. | |||||||||||||||||||
| Reconciliation and Calculation of Non-GAAP Financial and Operational Measures | |||||||||||||||||||
| (unaudited, amounts in thousands) | |||||||||||||||||||
| Reconciliation of Net Income to EBITDA and Adjusted EBITDA | |||||||||||||||||||
| Three Months Ended | Nine Months Ended | ||||||||||||||||||
| September 30, | June 30, | September 30, | September 30, | ||||||||||||||||
| 2026 | 2026 | 2025 | 2026 | 2025 | |||||||||||||||
| Net (loss) income | $ | (39,063 | ) | $ | 43,121 | $ | 43,055 | $ | 26,616 | $ | 134,182 | ||||||||
| Depreciation, depletion, and amortization | 113,704 | 114,213 | 122,981 | 341,976 | 380,089 | ||||||||||||||
| Interest expense, net | 5,898 | 3,354 | 10,902 | 16,983 | 30,607 | ||||||||||||||
| Income tax (benefit) expense | (10,423 | ) | 9,154 | 11,977 | 8,036 | 43,920 | |||||||||||||
| EBITDA | $ | 70,116 | $ | 169,842 | $ | 188,915 | $ | 393,611 | $ | 588,798 | |||||||||
| Stock-based compensation expense | 10,002 | 9,973 | 7,301 | 28,001 | 33,482 | ||||||||||||||
| Loss (gain) on investments, net | 62,892 | (42,913 | ) | (68,353 | ) | 2,663 | (155,883 | ) | |||||||||||
| (Gain) loss on disposal of assets, net | (1,165 | ) | 6,552 | (1,210 | ) | (13,126 | ) | 7,766 | |||||||||||
| Transaction and other costs | (215 | ) | 7,691 | — | 7,476 | 811 | |||||||||||||
| Provision for credit losses | — | — | 1,026 | — | 1,653 | ||||||||||||||
| Adjusted EBITDA | $ | 141,630 | $ | 151,145 | $ | 127,679 | $ | 418,625 | $ | 476,627 |
| Reconciliation of Net Income and Net Income per Diluted Share to Adjusted Net Income and Adjusted Net Income per Diluted Share | ||||||||||||||||||
| Three Months Ended | Nine Months Ended | |||||||||||||||||
| September 30, | June 30, | September 30, | September 30, | |||||||||||||||
| 2026 | 2026 | 2025 | 2026 | 2025 | ||||||||||||||
| Net (loss) income | $ | (39,063 | ) | $ | 43,121 | $ | 43,055 | $ | 26,616 | $ | 134,182 | |||||||
| Adjustments: | ||||||||||||||||||
| Less: Loss (gain) on investments, net | 62,892 | (42,913 | ) | (68,353 | ) | 2,663 | (155,883 | ) | ||||||||||
| Add back: Transaction and other costs | (215 | ) | 7,691 | — | 7,476 | 811 | ||||||||||||
| Total adjustments, before income taxes | 62,677 | (35,222 | ) | (68,353 | ) | 10,139 | (155,072 | ) | ||||||||||
| Income tax effect of adjustments | 13,858 | (6,450 | ) | (15,756 | ) | 2,352 | (38,303 | ) | ||||||||||
| Adjusted Net Income | $ | 9,756 | $ | 14,349 | $ | (9,542 | ) | $ | 34,403 | $ | 17,413 | |||||||
| Diluted weighted average common shares outstanding (1) | 166,967 | 167,663 | 165,066 | 166,855 | 165,126 | |||||||||||||
| Net (loss) income per diluted share | $ | (0.24 | ) | $ | 0.26 | $ | 0.26 | $ | 0.16 | $ | 0.81 | |||||||
| Adjusted Net Income per Diluted Share (1) | $ | 0.06 | $ | 0.09 | $ | (0.06 | ) | $ | 0.21 | $ | 0.11 |
| (1) | For the three months ended September 30, 2026, the Company reported Adjusted Net Income. Accordingly, approximately 3.8 million common shares related to outstanding restricted stock units and performance stock units were included in the calculation of diluted loss per share. |
| Calculation of Adjusted Pre-Tax Return on Capital Employed | ||||||
| Twelve Months Ended | ||||||
| September 30, | ||||||
| 2026 | 2025 | |||||
| Net income | $ | 40,306 | ||||
| Add back: Income tax expense | 11,435 | |||||
| Less: Gain on remeasurement of liability under tax receivable agreements (1) | (147 | ) | ||||
| Less: Gain on investments, net | (4,096 | ) | ||||
| Add back: Transaction and other costs | 7,505 | |||||
| Adjusted Pre-tax net income | $ | 55,003 | ||||
| Capital Employed | ||||||
| Total debt | $ | 1,290,572 | $ | 253,000 | ||
| Total equity | 1,920,698 | 2,069,665 | ||||
| Total Capital Employed | $ | 3,211,270 | $ | 2,322,665 | ||
| Average Capital Employed (2) | $ | 2,766,968 | ||||
| Adjusted Pre-Tax Return on Capital Employed (3) | 2 | % |
| (1) | Gain on remeasurement of the liability under tax receivable agreements is a result of a change in the estimated future effective tax rate and should be excluded in the determination of adjusted pre-tax return on capital employed. |
| (2) | Average Capital Employed is the simple average of Total Capital Employed as of September 30, 2026 and 2025. |
| (3) | Adjusted Pre-tax Return on Capital Employed is the ratio of Adjusted pre-tax net income for the twelve months ended September 30, 2026 to Average Capital Employed. |
View source version on businesswire.com: https://www.businesswire.com/news/home/20261021907753/en/
Michael Stock
Chief Financial Officer
Anjali Voria, CFA
Vice President of Investor Relations
303-515-2851
Source: Liberty Energy Inc.
Investor Email Alerts
Receive SEC Filings, Events, Press Releases and Stock Price Alerts.


Copyright © Liberty Energy, Inc. 2026 - All Rights Reserved