On November 6, 2026, Lazard, Inc., a Delaware corporation (the “Company”) filed with the Securities and Exchange Commission a prospectus supplement pursuant to Rule 424(b) under the Securities Act of 1933, as amended, relating to the possible resale of up to 9,416,817 shares of the Company’s common stock, par value $0.01 per share (“Common Stock”), issued to the selling stockholders in connection with the previously announced acquisition of one hundred percent of the outstanding ownership interests of Campbell Lutyens Holdings Limited. The Company is filing as Exhibit 5.1 to this Current Report on Form 8-K an opinion of its counsel, Sullivan & Cromwell LLP, regarding the validity of the securities. This Current Report on Form 8-K shall not constitute an offer to sell or the solicitation of an offer to buy, nor shall there be any sale of these securities in any state in which such offer, solicitation or sale would be unlawful prior to registration or qualification under the securities laws of any such state.
|
Lazard, Inc. is a financial advisory and asset management firm founded in 1848. The company operates through two primary business segments: Financial Advisory and Asset Management. Its Financial Advisory division provides services including mergers and acquisitions, capital markets, capital solutions, restructuring, liability management, and geopolitical advisory to corporations, governments, partnerships, family offices, and high-net-worth individuals. The Asset Management segment offers investment solutions and wealth management services. Lazard serves clients across North and South America, Europe, the Middle East, Asia, and Australia, with a significant presence in the United States, United Kingdom, and France. The firm advises on cross-border transactions and sovereign debt matters through its Sovereign Advisory Group. Lazard Frères & Co. was originally established as a dry goods merchant before expanding into banking and foreign exchange. Summarised from the company's own disclosures, fiscal year ended Feb 2026 |
Industry Asset Management | Homepage lazard.com |
| Sector Financial Services | IR page lazard.com | |
|
Tags
financial advisory, mergers and acquisitions, restructuring, liability management, sovereign advisory, capital markets, wealth management, institutional investment, geopolitical advisory, shareholder advisory, Lazard Frères & Co., Sovereign Advisory Group
|
Press page — |
Metrics
| Valuation | |
|---|---|
| Market cap | $ 3.977B |
| Market cap (USD) | $ 3.977B |
| P/E | 22.09 |
| PEG | — |
| P/BV | 4.19 |
| P/S | 1.18 |
| P/OCF | 5.68 |
| P/FCF | 5.81 |
| Dividend yield | 5.5% |
| Turnover / mcap | — |
| Returns | |
|---|---|
| ROE | 31.4% |
| ROI | 9.2% |
| ROIC | 9.8% |
| Profit margin | 7.4% |
| Growth | |
|---|---|
| Revenue growing | Yes |
| Profits growing | No |
| Revenue up 3y | No |
| Revenue up 5y | No |
| Earnings growth 3y (net profit CAGR) | -13.1% |
| Quality | |
|---|---|
| Profitable | Yes |
| Margin expanding | No |
| Buying back stock | No |
| Diluting (TTM) | No |
| Debt/Equity | 178.1% |
| Podcast bulls (TTM) | Sign up |
| Podcast bears (TTM) | Sign up |
| Podcast sentiment (TTM) | Sign up |
| Podcast sentiment % (TTM) | Sign up |
| News sentiment (TTM) | 26 |
| Quality score | 21.1% |
| Insiders | |
|---|---|
| Buys, 1w | Sign up |
| Buys, 1m | Sign up |
| Buys, 1y | Sign up |
| Sells, 1w | Sign up |
| Sells, 1m | Sign up |
| Sells, 1y | Sign up |
Sign up to see this company's insider trades
| Figure | FY 2025 | FY 2024 | FY 2023 | FY 2022 | FY 2021 | FY 2020 | FY 2019 | FY 2018 | FY 2017 | FY 2016 | FY 2015 | FY 2014 | FY 2013 | FY 2012 | FY 2011 | FY 2010 | FY 2009 | FY 2008 | FY 2007 | FY 2006 | FY 2005 | FY 2004 |
|---|---|---|---|---|---|---|---|---|---|---|---|---|---|---|---|---|---|---|---|---|---|---|
| Revenue | 3.186B | 3.14B | 2.593B | 2.855B | 3.274B | 2.647B | 2.667B | 2.885B | 2.698B | 2.384B | 2.405B | 2.363B | 2.065B | 1.994B | 1.92B | 2.003B | — | — | — | — | — | — |
| Net profit | 236.831M | 279.912M | -75.479M | 357.517M | 528.064M | 402.461M | 286.5M | 527.125M | 253.583M | 387.698M | 986.373M | 427.277M | 160.212M | 84.309M | 174.917M | 174.979M | -130.242M | 3.138M | — | — | — | — |
| Free cash flow | 487.379M | 697.33M | 136.365M | 784.473M | 826.381M | 511.645M | 635.196M | 649.445M | 987.772M | 562.538M | 860.667M | 713.833M | 465.733M | 392.607M | 351.364M | 155.416M | 232.862M | 487.381M | 55.289M | 227.876M | 885.788M | 515.041M |
| Figure | FY 2025 | FY 2024 | FY 2023 | FY 2022 | FY 2021 | FY 2020 | FY 2019 | FY 2018 | FY 2017 | FY 2016 | FY 2015 | FY 2014 | FY 2013 | FY 2012 | FY 2011 | FY 2010 | FY 2009 | FY 2008 | FY 2007 | FY 2006 | FY 2005 | FY 2004 |
|---|---|---|---|---|---|---|---|---|---|---|---|---|---|---|---|---|---|---|---|---|---|---|
| Share price | 48.56 | 51.48 | 34.8 | 34.67 | 43.63 | 42.3 | 39.96 | 36.91 | 52.5 | 41.09 | 45.01 | 50.03 | 45.32 | 29.84 | 25.42 | 39.5 | 37 | 28.21 | 39.01 | 45.42 | — | — |
| Price performance 12m | -0.06 | 0.48 | 0 | -0.21 | 0.03 | 0.06 | 0.08 | -0.3 | 0.28 | -0.09 | -0.1 | 0.1 | 0.52 | 0.17 | -0.36 | 0.07 | 0.31 | -0.28 | -0.14 | — | — | — |
Filed figures
Lines the statements and their notes report beside the headline figures, read from the filings' XBRL as filed (no restatement applied), with figures computed from one filing's own lines. Cash-flow lines carry their cash direction: an outflow is negative. Each period links to its filing; a figure's period, report date and tag are in its tooltip.
| Figure | Dec 2016 | Dec 2017 | Dec 2018 | Dec 2019 | Dec 2020 | Dec 2021 | Dec 2022 | Dec 2023 | Dec 2024 | Dec 2025 |
|---|---|---|---|---|---|---|---|---|---|---|
| Balance sheet detail | ||||||||||
| Lease liabilities (USD) | — | — | 580M | 644M | 607M | 553M | 514M | 485M | 505M | 485M |
| Cash and deposits (USD) | 1.16B | 1.48B | 1.25B | 1.23B | 1.39B | 1.47B | 1.23B | 971M | 1.31B | 1.47B |
| Intangible assets (USD) | 8.91M | 6.07M | 3.76M | 1.82M | 210,000 | 150,000 | — | — | — | 0.00 |
| Right-of-use assets (USD) | — | — | 500M | 552M | 514M | 466M | 432M | 407M | 435M | 413M |
| Cash flow detail | ||||||||||
| Operating cash flow (USD) | 601M | 1.02B | 699M | 678M | 576M | 866M | 834M | 165M | 743M | 519M |
| Purchases of property, plant and equipment (USD) | -38.7M | -27.7M | -49.6M | -42.8M | -64.3M | -39.7M | -49.5M | -28.3M | -45.5M | -31.9M |
| Change in receivables (cash effect) (USD) | -156M | 96M | -132M | 35.7M | -72.2M | -81.6M | 141M | -101M | -3.58M | -62.3M |
| Dividends paid (cash effect) (USD) | -336M | -341M | -360M | -255M | -197M | -196M | -182M | -173M | -179M | -187M |
| Share buybacks (cash effect) (USD) | -300M | -307M | -553M | -495M | -95.2M | -406M | -692M | -102M | -59.5M | -91M |
| Interest paid (cash effect) (USD) | -46.3M | -49.6M | -50.8M | -70.4M | -78.3M | -78M | -77.4M | -73.7M | -84.4M | -80.3M |
| Income taxes paid (cash effect) (USD) | -72.4M | -48.7M | -102M | -89.4M | -43.8M | -74.1M | -144M | -44.2M | -34M | -119M |
| Share-based compensation (USD) | 261M | 273M | 268M | 253M | 218M | 234M | 241M | 251M | 278M | 360M |
| Operating cash flow before change in receivables (USD) | 757M | 919M | 831M | 642M | 648M | 948M | 693M | 265M | 746M | 582M |
| Free cash flow (OCF - PPE - intangibles) (USD) | 563M | 988M | 649M | 635M | 512M | 826M | 784M | 136M | 697M | 487M |
| Income detail | ||||||||||
| Total comprehensive income (USD) | 314M | 342M | 491M | 278M | 458M | 557M | 320M | -51.4M | 250M | 306M |
| Comprehensive income to owners (USD) | 308M | 335M | 486M | 267M | 458M | 543M | 286M | -69.6M | 243M | 292M |
| Provision for credit losses (USD) | 10.1M | 15.4M | 27.2M | -5.08M | 3.99M | 3.81M | 4.01M | 20.9M | 11.8M | -4.5M |
| Reported | Feb 24, 2017 | Feb 27, 2018 | Apr 30, 2019 | Feb 25, 2020 | Feb 26, 2021 | Feb 28, 2022 | Feb 23, 2023 | Feb 23, 2024 | Feb 24, 2025 | Jul 28, 2026 |
Operating KPIs — quarters
Business figures the company publishes beside its accounts (users, subscribers, same-store sales, production, occupancy ...), read from its results releases and reports, with the growth on the same period a year earlier beneath each: computed from the figures, and as the company states it where it does. Each figure links to its source; counts at a period end show under that period.
Sign up to see institutional holdings
Sign UpPodcast Mentions
Sign up to see podcast mentions and sentiment
Sign UpMaterial events reported to the SEC on Form 8-K or 6-K, newest first. The link opens the filing itself on EDGAR. Press releases from the company's own website, newest first.
November 05, 2026
Share
Private markets are being reshaped by disruption that is creating new opportunities as well as challenges. In secondaries, innovative transaction structures are expanding the possibilities for liquidity and capital formation, while in fundraising, specialized expertise and investor relationships are becoming critical differentiators.
In a recent interview with PEI, Lazard CL’s Holcombe Green and Gordon Bajnai discuss the launch of the combined business following six months of intensive integration work, and why they see this as a consequential moment for private capital advisory. They note that the strong response from clients reflects the opportunity ahead as the firm brings together complementary capabilities at a time when clients need them most.
Read the full interview in PEI here .
About Lazard
Founded in 1848, Lazard is the preeminent financial advisory, private capital advisory, and asset management firm, with operations in North and South America, Europe, the Middle East, Asia, and Australia. Lazard provides advice on mergers and acquisitions, capital markets and capital solutions, restructuring and liability management, geopolitics, and other strategic matters. Lazard also advises private markets sponsors and investors on primary fundraising, secondary transactions, and GP capital solutions, and provides asset management and investment solutions to institutions, corporations, governments, partnerships, family offices, and high net worth individuals. Lazard is listed on the New York Stock Exchange as Lazard, Inc. under the ticker LAZ. For more information, please visit Lazard.com and follow Lazard on LinkedIn.
Related News & Announcements
Private Capital Advisory News & Announcements
More News & Announcements
November 04, 2026
Lazard in the News
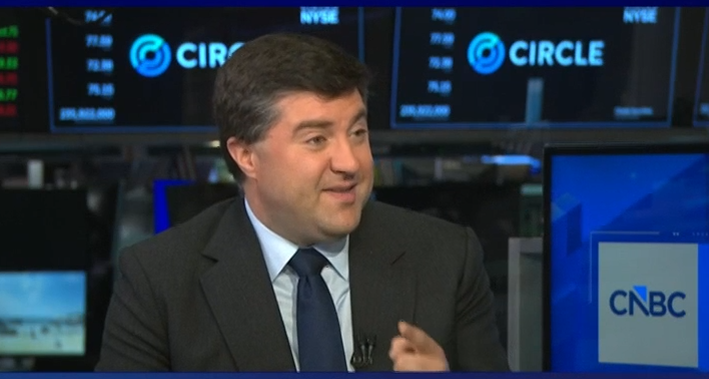
Lazard Asset Management CIO Eric Van Nostrand on CNBC
November 02, 2026
Press releases
Lazard Appoints Jessel Sheth as Managing Director, Technology Advisory
November 02, 2026
Press releases
Lazard Completes Its Acquisition of Campbell Lutyens and Launches Lazard CL, the Global Leader for the Next Era of Private Capital
View all news and announcements

About Lazard
Connect with us
Explore our Businesses
The Latest from Lazard
© 2026 Lazard
November 04, 2026
Share
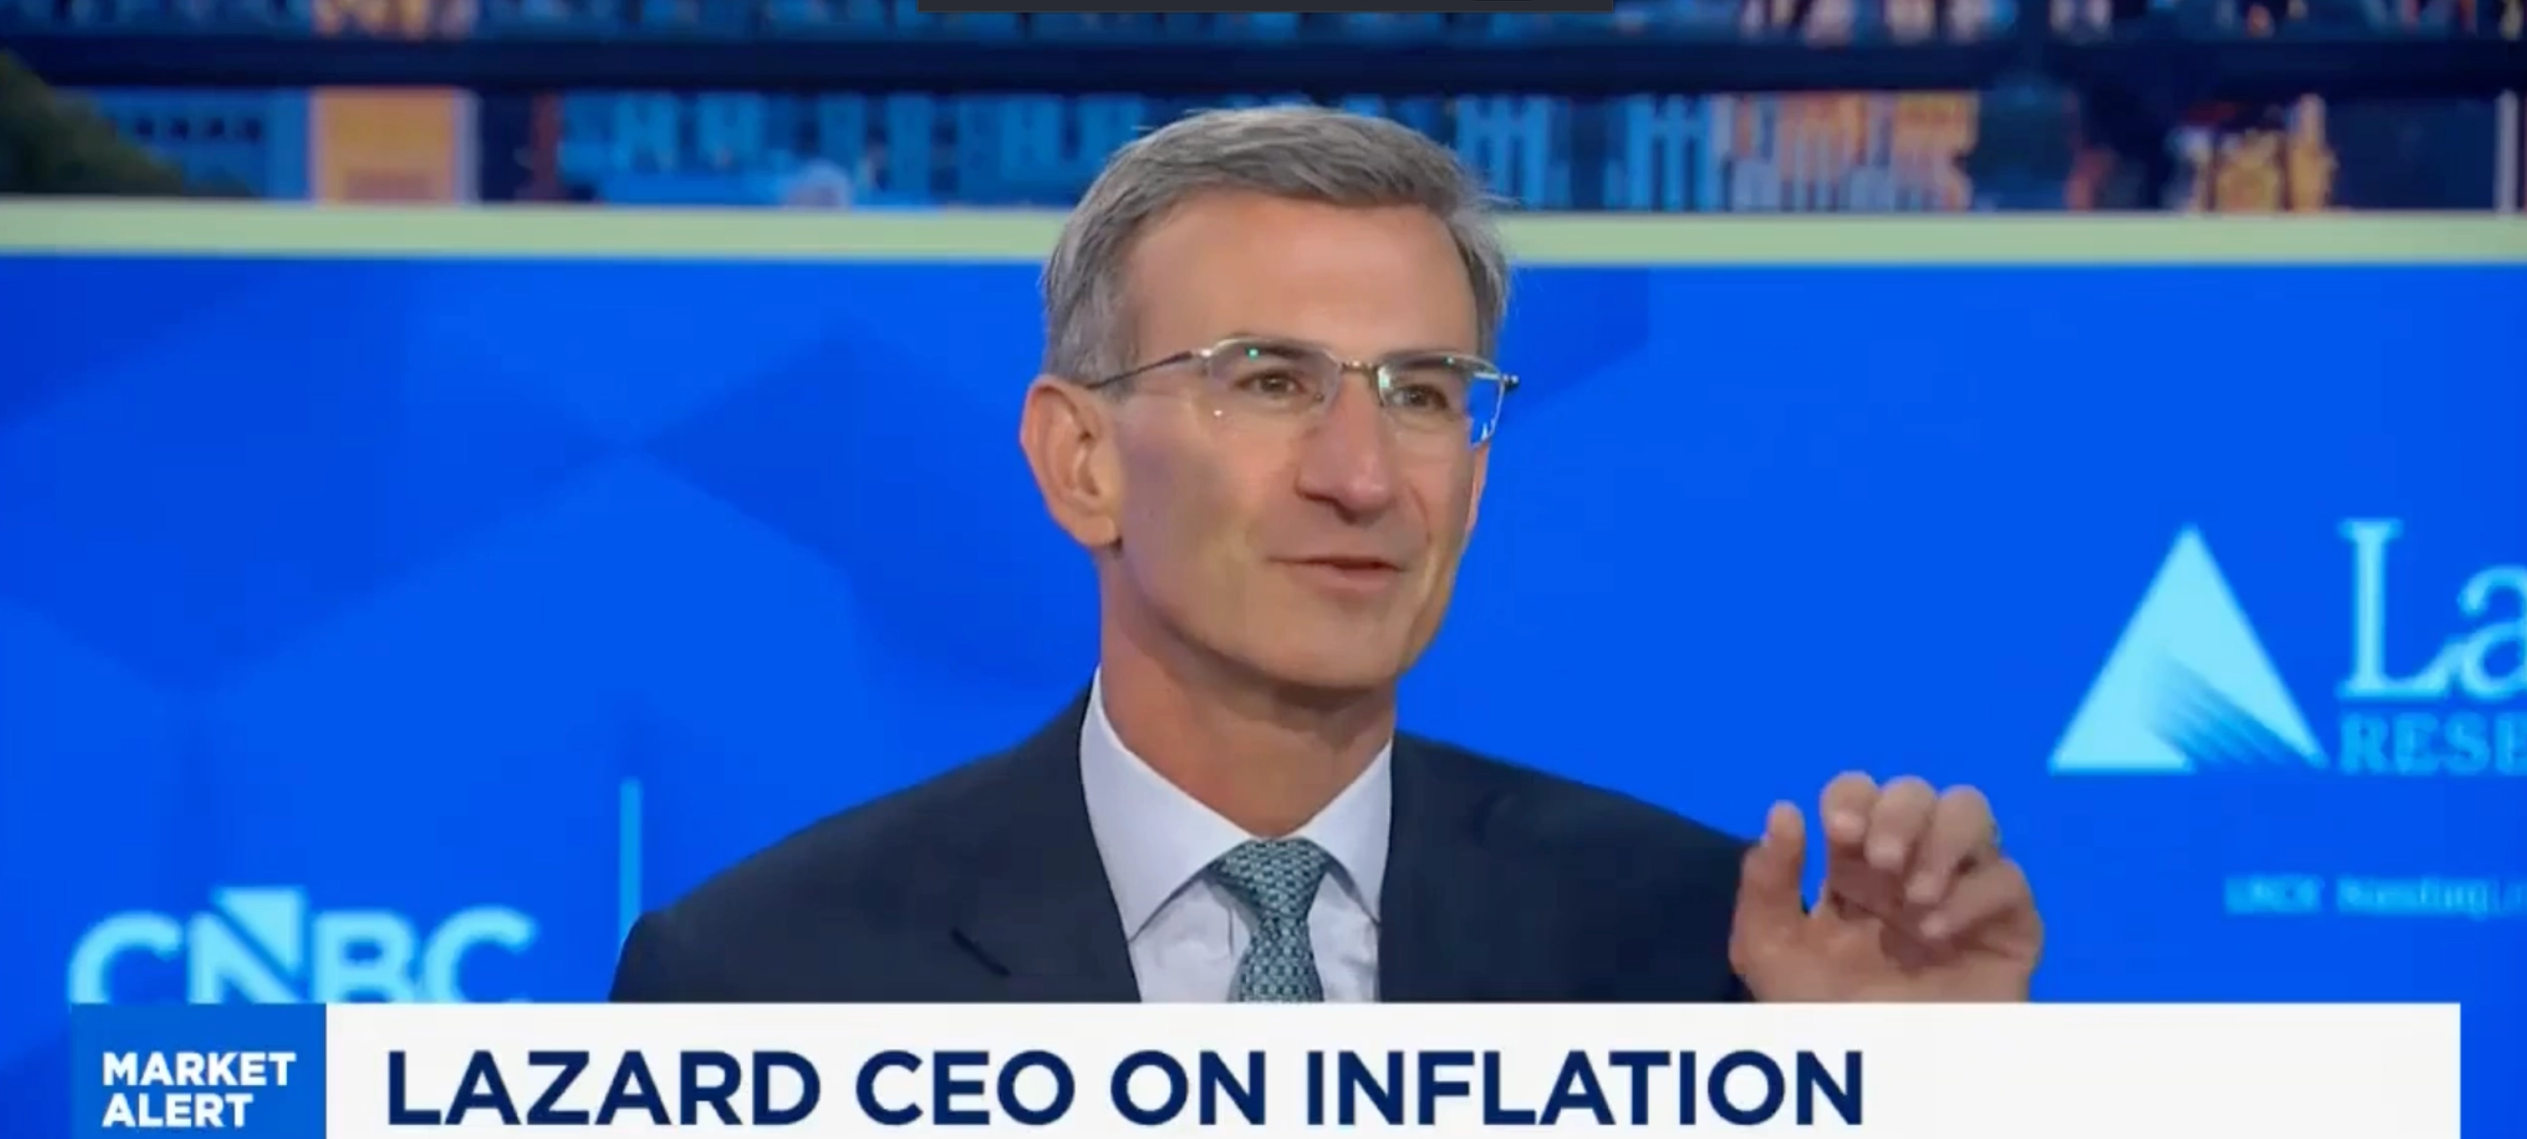
Lazard Asset Management CIO, Eric Van Nostrand, joined CNBC's Squawk on the Street to discuss how the new balance of power in Washington could reshape the supply-side policy landscape, and what investors should be watching as the administration's economic agenda evolves.
Beyond the immediate market reaction, changes in trade, regulation and other policy levers could have important implications for the economy's productive capacity, inflation and long-term growth.
Click here to view a clip from the discussion.
About Lazard
Founded in 1848, Lazard is the preeminent financial advisory, private capital advisory, and asset management firm, with operations in North and South America, Europe, the Middle East, Asia, and Australia. Lazard provides advice on mergers and acquisitions, capital markets and capital solutions, restructuring and liability management, geopolitics, and other strategic matters. Lazard also advises private markets sponsors and investors on primary fundraising, secondary transactions, and GP capital solutions, and provides asset management and investment solutions to institutions, corporations, governments, partnerships, family offices, and high net worth individuals. Lazard is listed on the New York Stock Exchange as Lazard, Inc. under the ticker LAZ. For more information, please visit Lazard.com and follow Lazard on LinkedIn.
Related News & Announcements
Lazard Asset Management Lazard in the News
More News & Announcements
November 05, 2026
News & Announcements
Holcombe Green and Gordon Bajnai Discuss Launch of Lazard CL in PEI Interview
November 02, 2026
Press releases
Lazard Appoints Jessel Sheth as Managing Director, Technology Advisory
November 02, 2026
Press releases
Lazard Completes Its Acquisition of Campbell Lutyens and Launches Lazard CL, the Global Leader for the Next Era of Private Capital
View all news and announcements
About Lazard
Connect with us
Explore our Businesses
The Latest from Lazard
© 2026 Lazard



Prompts
Click prompts to add them under the company line, click again to take one out, then copy the result into your AI chat. Shared by Asian Century Stocks and Uncovered Thai Stocks. Thank you.
ETFs Holding Lazard, Inc.
Exchange-traded funds whose newest published daily portfolio holds one of the company's listings, largest weight first.
| ETF | Weight in ETF | Shares | Market value | As of |
|---|---|---|---|---|
| CVSM | 2.11% | 47,063 | $ 1.995M | Jul 31, 2026 |
| FFND | 0.72% | 16,358 | $ 707.156K | Aug 31, 2026 |
| HIDV | 0.65% | 30,954 | $ 1.338M | Aug 31, 2026 |
| FFSM | 0.39% | 138,307 | $ 5.861M | Jul 31, 2026 |
| BTAL short | -0.32% | -21,758 | $ -912.531K | Jun 30, 2026 |
| AVSC | 0.17% | 136,501 | $ 5.404M | Nov 16, 2026 |
| RUSC | 0.10% | 1,886 | $ 79.099K | Jun 30, 2026 |
| DFAS | 0.09% | 777,537 | $ 31.778M | Nov 12, 2026 |
| SMDX | 0.09% | 2,860 | $ 113.227K | Nov 17, 2026 |
| TMSL | 0.09% | 56,784 | $ 2.382M | Jun 30, 2026 |
| DXUV | 0.03% | 50,067 | $ 2.046M | Nov 12, 2026 |
| AVSU | 0.03% | 3,244 | $ 128.43K | Nov 16, 2026 |
| MSSM | 0.02% | 3,449 | $ 149.1K | Aug 31, 2026 |
| AVUS | 0.02% | 61,379 | $ 2.43M | Nov 16, 2026 |
| DFSU | 0.02% | 10,968 | $ 448.262K | Nov 12, 2026 |
| DFAC | 0.02% | 333,815 | $ 13.643M | Nov 12, 2026 |
| EBI | 0.01% | 2,323 | $ 100.423K | Aug 31, 2026 |
| DCOR | 0.01% | 98,642 | $ 4.031M | Nov 12, 2026 |
| DFAU | 0.01% | 21,401 | $ 874.659K | Nov 12, 2026 |
| DFUS | 0.01% | 30,496 | $ 1.246M | Nov 12, 2026 |
| MSLC | 0.00% | 4,238 | $ 183.209K | Aug 31, 2026 |
| AVUQ | 0.00% | 160 | $ 6,334.40 | Nov 16, 2026 |