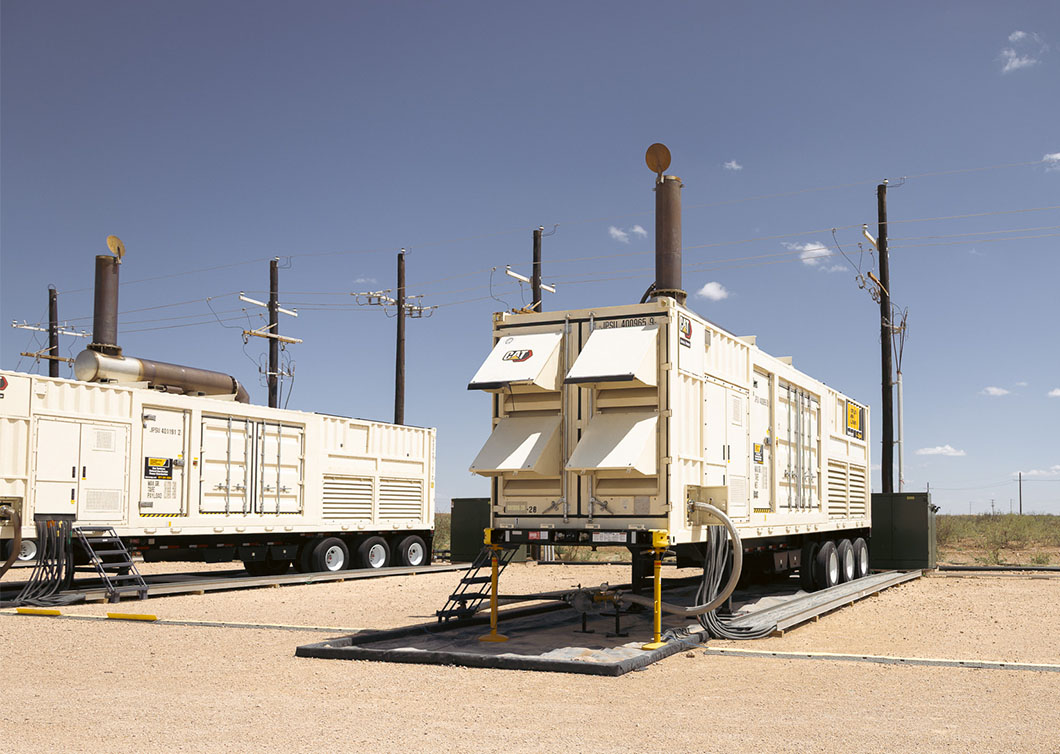
Kodiak Gas Services, Inc. is a provider and operator of large horsepower contract compression infrastructure in the United States. The company operates through two segments: Contract Services, which involves running company-owned and customer-owned compression, gas treating, and cooling infrastructure for natural gas and oil production, gathering, and transportation; and Other Services, which includes station construction, maintenance, overhaul, parts sales, and ancillary offerings. Kodiak serves upstream and midstream customers, with a significant concentration of assets in the Permian Basin and Eagle Ford Shale. The company was founded in 2010 and completed its initial public offering in 2023. Its subsidiary, Kodiak Services, was formed in 2011. Kodiak also offers enhanced oil recovery services and real-time emissions monitoring through its ecoView system.

Summarised from the company's own disclosures, fiscal year ended Feb 2026

Industry Oil & Gas Equipment & Services Homepage kodiakgas.com
Sector Energy IR page ir.kodiakgas.com
Tags
contract compression, natural gas, oil and gas, midstream, upstream, enhanced oil recovery, emissions monitoring, compressor stations, gas lift, maintenance and overhaul, Kodiak Services, ecoView, Pegasus Optimization Managers LLC
Press page ir.kodiakgas.com/news-events/press-releases

Metrics

Valuation  
Market cap $ 4.355B
Market cap (USD) $ 4.355B
P/E 24.83
PEG —
P/BV 1.98
P/S 2.96
P/OCF 7.75
P/FCF -123.27
Dividend yield 4.6%
Turnover / mcap —
Returns  
ROE 6.2%
ROI 2.1%
ROIC 6.5%
Profit margin 6.2%
Growth  
Revenue growing Yes
Profits growing Yes
Revenue up 3y Yes
Revenue up 5y —
Earnings growth 3y (net profit CAGR) -9.6%
Quality  
Profitable Yes
Margin expanding No
Buying back stock No
Diluting (TTM) Yes
Debt/Equity 125.6%
Podcast bulls (TTM) Sign up
Podcast bears (TTM) Sign up
Podcast sentiment (TTM) Sign up
Podcast sentiment % (TTM) Sign up
News sentiment (TTM) 30
Quality score 22.2%
Insiders  
Buys, 1w Sign up
Buys, 1m Sign up
Buys, 1y Sign up
Sells, 1w Sign up
Sells, 1m Sign up
Sells, 1y Sign up

Sign up to see this company's insider trades

Figure FY 2025 FY 2024 FY 2023 FY 2022 FY 2021
Revenue 1.308B 1.159B 850.381M 654.957M 583.07M
Net profit 80.521M 49.895M 20.066M 106.265M 180.963M
Free cash flow 284.268M -8.969M 46.531M -39.503M 48.044M

Figure FY 2025 FY 2024 FY 2023 FY 2022 FY 2021
Share price 37.4 40.83 20.08 — —
Price performance 12m -0.08 1.03 — — —

Filed figures

Figure Dec 2020 Dec 2021 Dec 2022 Dec 2023 Dec 2024 Dec 2025
Balance sheet detail
Trade receivables (USD) — 80.7M 97.6M 113M 254M 198M
↳ YoY growth +20.8% +16.0% +124.1% -22.1%
Borrowings, non-current (USD) — — 2.72B 1.79B 2.58B 2.56B
Lease liabilities (USD) — — 9.84M 34.5M 65.1M 55.8M
Cash and deposits (USD) 24.1M 28.8M 20.4M 5.56M 4.75M 3.18M
Intangible assets (USD) — — 132M 123M 163M 154M
Right-of-use assets (USD) — — 9.83M 33.7M 53.8M 42.2M
Net debt (borrowings + leases - cash) (USD) — — 2.71B 1.82B 2.64B 2.61B
Cash flow detail
Operating cash flow (USD) — 250M 220M 266M 328M 600M
Purchases of property, plant and equipment (USD) — -202M -259M -220M -337M -315M
Change in receivables (cash effect) (USD) — -14.9M -16.9M -22.7M -103M 43.8M
Change in inventories (cash effect) (USD) — -2.97M -24.3M -4.58M -1.34M 1.07M
Change in payables (cash effect) (USD) — -2.78M -1.52M 10.2M 4.97M 5.17M
Dividends paid (cash effect) (USD) — 0.00 0.00 -29.8M -134M -160M
Share buybacks (cash effect) (USD) — — 0.00 0.00 -40M -104M
Interest paid (cash effect) (USD) — -120M -143M -217M -147M -169M
Income taxes paid (cash effect) (USD) — -1.85M -2.18M -9.76M -14.7M -5.94M
Share-based compensation (USD) — 1.22M 971,000 5.91M 17.7M 24.5M
Operating cash flow before change in receivables (USD) — 265M 237M 289M 431M 556M
Free cash flow (OCF - PPE - intangibles) (USD) — 48M -39.5M 46.5M -8.97M 284M
Income detail
Total comprehensive income (USD) — — — 20.1M 50.3M 80M
Comprehensive income to owners (USD) — — — 20.1M 49.9M 78.9M
Provision for credit losses (USD) — -538,000 0.00 7.1M 4.66M 1.03M
Credit cost ratio (credit losses / average receivables) (%) — — 0.0% 6.7% 2.5% 0.5%
Reported Mar 7, 2024 Mar 7, 2024 Mar 7, 2025 Feb 26, 2026 Feb 26, 2026 Feb 26, 2026

Sign up to see institutional holdings

Sign Up

Podcast Mentions

Sign up to see podcast mentions and sentiment

Sign Up

THE WOODLANDS, Texas — November 9, 2026 — Kodiak Gas Services, Inc. (NYSE: KGS) (“Kodiak” or the “Company”) today reported financial and operating results for the quarter ended September 30, 2026. The Company also increased full year 2026 Adjusted EBITDA and discretionary cash flow guidance.

Third Quarter 2026 and Recent Highlights

•Record Compression Infrastructure(1) segment revenues of $318.4 million

•Compression Infrastructure segment gross margin percentage of 47.5% and adjusted gross margin percentage(2) of 70.0%

•Reported Power Infrastructure(1) segment revenues of $42.0 million, a 27.6% increase compared to the second quarter of 2026

•Power Infrastructure segment gross margin percentage of 65.8% and adjusted gross margin percentage(2) of 75.2%

•Net income and adjusted net income(2) attributable to common shareholders of $71.5 million, or $0.70 per diluted share(2)

•Record adjusted EBITDA(2) of $224.5 million, a 28.5% increase compared to third quarter 2025

•Quarterly net cash provided by operating activities of $196.3 million and discretionary cash flow(2) of $158.5 million, a 35.9% increase compared to third quarter 2025

•Declared a quarterly dividend of $0.51 per

Nov 9, 2026 11:00 am EST

Via phone – dial 877-407-4012 and ask for the Kodiak Gas Services call at least 10 minutes prior to the start time.

A telephonic replay will be available through November 23, 2026 and may be accessed by dialing 877-660-6853 and using access code 13763414.

Webcast

Audio

Contact Us

[email protected]

936.539.3300

9950 Woodloch Forest Dr. 19th Floor
The Woodlands, TX 77380

Facebook Twitter Linkedin Youtube

Ethics Help Link

Vendor Terms & Conditions

Privacy & Cookie Policy

© 2026 Kodiak Gas Services

Back to top ↑

Kodiak Gas Services Announces Quarterly Dividend Bull 3 Bear 0 Capital return

November 04, 2026 6:03 pm EST Download as PDF

THE WOODLANDS, Texas--(BUSINESS WIRE)-- Kodiak Gas Services, Inc. (NYSE: KGS), (“Kodiak”) today announced that its board of directors has declared a cash dividend of $0.51 per share of common stock for the third quarter of 2026, payable on November 25, 2026, to all stockholders of record as of the close of business on November 16, 2026.

The $0.51 per share dividend represents a 4.1% increase over both the prior quarter and the year-ago quarter. Since Kodiak initiated its dividend in 2023 at $0.38 per share, its quarterly dividend has increased by approximately 34%, reflecting the Company’s commitment to returning capital to stockholders as part of its shareholder return framework.

About Kodiak

Kodiak is a leading contract compression, distributed power, and energy infrastructure services provider in the United States. Headquartered in The Woodlands, Texas, Kodiak partners with customers across the energy and digital infrastructure sectors, including oil and gas producers, midstream operators, and data center developers and operators, to deliver safe, reliable, and innovative infrastructure solutions. Additional information is available at www.kodiakgas.com .

Cautionary Note Regarding Forward-Looking Statements

This news release contains “forward-looking statements” within the meaning of the safe harbor provisions of the U.S. Private Securities Litigation Reform Act of 1995. Forward-looking statements are neither historical facts nor assurances of future performance. Instead, they are based only on our current beliefs, expectations and assumptions regarding the future of our business, future plans and strategies, projections, anticipated events and trends, the economy and other future conditions. Forward-looking statements can be identified by words such as: “anticipate,” “intend,” “plan,” “goal,” “seek,” “believe,” “project,” “estimate,” “expect,” “strategy,” “future,” “likely,” “may,” “should,” “will” and similar references to future periods. Because forward-looking statements relate to the future, they are subject to inherent uncertainties, risks and changes in circumstances that are difficult to predict and many of which are outside of our control. A list and description of risks, uncertainties and other factors can be found in the Part I, Item 1A. “Risk Factors” and Part II, Item 7. “Management’s Discussion and Analysis of Financial Condition and Results of Operations” sections of our Annual Report on Form 10-K for the fiscal year ended December 31, 2025 and filed with the SEC on February 26, 2026 and any updates to those factors set forth in our subsequent quarterly reports on Form 10-Q or current reports on Form 8-K. Any forward-looking statement made by us in this news release is based only on information currently available to us and speaks only as of the date on which it is made. Except as may be required by applicable law, we undertake no obligation to publicly update any forward-looking statement whether as a result of new information, future developments or otherwise.

View source version on businesswire.com: https://www.businesswire.com/news/home/20261104797335/en/

Graham Sones, VP of Investor Relations
[email protected]

(936) 755-3259

Source: Kodiak Gas Services, Inc.

Released November 4, 2026

Contact Us

[email protected]

936.539.3300

9950 Woodloch Forest Dr. 19th Floor
The Woodlands, TX 77380

Facebook Twitter Linkedin Youtube

Ethics Help Link

Vendor Terms & Conditions

Privacy & Cookie Policy

© 2026 Kodiak Gas Services

Back to top ↑

Prompts

Kodiak Gas Services, Inc. (ticker KGS), listed in United States.

Company History

Date Change Detail
Dec 12, 2022 Renamed Frontier TopCo, Inc. → KODIAK GAS SERVICES, INC.

ETFs Holding Kodiak Gas Services, Inc.

ETF Weight in ETF Shares Market value As of
PIPE 4.17% 46,451 $ 2.727M Jul 31, 2026
USNG 3.88% 3,800 $ 285.494K Jun 30, 2026
VOLT 2.05% 251,488 $ 14.78M Aug 31, 2026
CPAI 1.92% 94,355 $ 7.089M Jun 30, 2026
BAMD 1.78% 29,906 $ 1.758M Aug 31, 2026
TPZ 0.99% 20,218 $ 1.188M Aug 31, 2026
FSEG 0.89% 680 $ 51.088K Jun 30, 2026
ELCV 0.79% 33,607 $ 1.973M Jul 31, 2026
FESM 0.71% 544,989 $ 40.945M Jun 30, 2026
OSCV 0.66% 79,662 $ 4.677M Jul 31, 2026
JPSV 0.53% 3,573 $ 151.638K Nov 17, 2026
RAAX 0.53% 134,218 $ 7.11M Sep 30, 2026
PSC 0.50% 155,716 $ 11.699M Jun 30, 2026
FSCC 0.37% 22,654 $ 1.331M Aug 31, 2026
SCDS 0.36% 769 $ 32.636K Nov 17, 2026
AVUV 0.34% 2,596,328 $ 110.785M Nov 16, 2026
RESM 0.30% 146 $ 10.969K Jun 30, 2026
RUSC 0.29% 3,018 $ 226.742K Jun 30, 2026
AFSM 0.20% 6,943 $ 296.258K Nov 16, 2026
FELV 0.16% 66,707 $ 5.012M Jun 30, 2026
AVSC 0.15% 109,657 $ 4.679M Nov 16, 2026
AFMC 0.14% 8,361 $ 356.764K Nov 16, 2026
MSSM 0.14% 16,911 $ 993.859K Aug 31, 2026
JMEE 0.13% 89,878 $ 3.814M Nov 17, 2026
FMDE 0.12% 119,837 $ 9.003M Jun 30, 2026
VFMO 0.12% 38,961 $ 2.29M Aug 31, 2026
EBI 0.12% 14,021 $ 824.014K Aug 31, 2026
FFF 0.10% 114 $ 6,038.58 Sep 30, 2026
DFAS 0.09% 690,802 $ 30.672M Nov 12, 2026
AVIE 0.07% 285 $ 12.161K Nov 16, 2026
SMDX 0.07% 2,025 $ 86.407K Nov 17, 2026
FELG 0.07% 51,874 $ 3.897M Jun 30, 2026
FEAC 0.05% 172 $ 12.922K Jun 30, 2026
CCNR 0.05% 3,510 $ 206.072K Jul 31, 2026
AVLV 0.04% 200,122 $ 8.539M Nov 16, 2026
DFSU 0.03% 17,247 $ 765.767K Nov 12, 2026
DXUV 0.03% 43,517 $ 1.932M Nov 12, 2026
AVUS 0.03% 96,210 $ 4.105M Nov 16, 2026
FELC 0.03% 29,179 $ 2.192M Jun 30, 2026
DFAT 0.02% 168,297 $ 7.472M Nov 12, 2026
DFUV 0.02% 67,321 $ 2.989M Nov 12, 2026
DFAC 0.02% 349,585 $ 15.522M Nov 12, 2026
DCOR 0.01% 109,680 $ 4.87M Nov 12, 2026
DFAU 0.01% 25,116 $ 1.115M Nov 12, 2026
FHEQ 0.01% 1,278 $ 75.031K Jul 31, 2026
DFUS 0.01% 26,812 $ 1.19M Nov 12, 2026
DFSV 0.00% 3,073 $ 136.441K Nov 12, 2026