JBL
Fiscal year ends August Quarters are offset from the calendar — Q1 is Sep–Nov

Jabil Inc. is a provider of engineering, manufacturing, and supply chain solutions that delivers design, production, and product management services across the entire product lifecycle. The company operates through three reportable segments: Regulated Industries, serving automotive, healthcare, packaging, and energy infrastructure customers; Intelligent Infrastructure, focusing on AI infrastructure, cloud and data center systems, and networking; and Connected Living and Digital Commerce, covering warehouse automation, robotics, and digital commerce. Jabil serves customers globally with manufacturing facilities in regions including China, Malaysia, Mexico, and the United States. Founded in 1966 by James Golden and Bill Morean, the company combines automated continuous flow manufacturing with advanced electronic design capabilities to support clients in reducing costs and accelerating time-to-market.

Summarised from the company's own disclosures, fiscal year ended Oct 2025

Industry Specialty Industrial Machinery Homepage jabil.com
Sector Industrials IR page investors.jabil.com/overview/default.aspx
Tags
electronics manufacturing services, supply chain management, automotive electronics, healthcare devices, data center infrastructure, warehouse automation, robotics, networking equipment, packaging, renewable energy infrastructure
Press page —

Metrics

Valuation  
Market cap $ 30.298B
Market cap (USD) $ 30.298B
P/E 29.74
PEG 3.54
P/BV 18.78
P/S 0.84
P/OCF 15.13
P/FCF 22.05
Dividend yield 0.11%
Turnover / mcap —
Returns  
ROE 66.7%
ROI 20.9%
ROIC 25.2%
Profit margin 2.9%
Growth  
Revenue growing Yes
Profits growing No
Revenue up 3y No
Revenue up 5y No
Earnings growth 3y (net profit CAGR) 8.4%
Quality  
Profitable Yes
Margin expanding No
Buying back stock Yes
Diluting (TTM) No
Debt/Equity 209.5%
Podcast bulls (TTM) Sign up
Podcast bears (TTM) Sign up
Podcast sentiment (TTM) Sign up
Podcast sentiment % (TTM) Sign up
News sentiment (TTM) 32
Quality score 5.3%
Insiders  
Buys, 1w Sign up
Buys, 1m Sign up
Buys, 1y Sign up
Sells, 1w Sign up
Sells, 1m Sign up
Sells, 1y Sign up

Sign up to see this company's insider trades

Figure FY 2026 FY 2025 FY 2024 FY 2023 FY 2022 FY 2021 FY 2020 FY 2019 FY 2018 FY 2017 FY 2016 FY 2015 FY 2014 FY 2013 FY 2012 FY 2011 FY 2010 FY 2009 FY 2008 FY 2007 FY 2006 FY 2005 FY 2004 FY 2003 FY 2002 FY 2001 FY 2000 FY 1999
Revenue 35.954B 29.802B 28.883B 34.702B 33.478B 29.285B 27.266B 25.282B 22.095B 19.063B 18.353B 17.899B 15.762B 18.337B 17.152B 16.519B 13.409B 11.685B 12.78B 12.291B 10.265B 7.524B 6.253B 4.729B 3.545B 4.331B 3.558B 2.238B
Net profit 1.042B 657M 1.388B 818M 996M 696M 53.912M 287.111M 86.33M 129.09M 254.095M 284.019M 241.313M 371.482M 394.687M 381.063M 168.84M -1.165B 133.892M 73.236M 164.518M 231.847M 166.9M 43.007M 34.715M 118.517M 145.648M 84.819M
Free cash flow 1.374B 1.172B 932M 704M 266M 274M 274.24M 187.586M -102.801M 540.158M -8.032M 277.137M -125.203M 477.031M 136.529M 369.02M 28.985M 265.071M 74.363M -118.301M 168.315M 333.152M 233.5M 146.278M 468.648M -126.423M -297.723M -58.209M

Figure FY 2026 FY 2025 FY 2024 FY 2023 FY 2022 FY 2021 FY 2020 FY 2019 FY 2018 FY 2017 FY 2016 FY 2015 FY 2014 FY 2013 FY 2012 FY 2011 FY 2010 FY 2009 FY 2008 FY 2007 FY 2006 FY 2005 FY 2004 FY 2003 FY 2002 FY 2001 FY 2000 FY 1999
Share price 299.63 199.85 117.04 108.82 59.29 62.72 35 31.95 29.48 31.32 20.23 21.29 21.5 22.79 21.53 16.61 11.39 7.42 16.22 24 24.47 28.06 — — — — — —
Price performance 12m 0.5 0.71 0.08 0.84 -0.05 0.79 0.1 0.08 -0.06 0.55 -0.05 -0.01 -0.06 0.06 0.3 0.46 0.54 -0.54 -0.32 -0.02 -0.13 — — — — — — —

Filed figures

Figure Aug 2017 Aug 2018 Aug 2019 Aug 2020 Aug 2021 Aug 2022 Aug 2023 Aug 2024 Aug 2025 Aug 2026
Balance sheet detail
Trade receivables (USD) — — — — 3.14B 4B 3.65B — — —
↳ YoY growth +27.2% -8.7%
Borrowings, current (USD) 445M 25.2M 375M 50.2M 0.00 300M 0.00 0.00 499M 499M
Borrowings, non-current (USD) 1.63B 2.49B 2.12B 2.68B 2.88B 2.58B 2.88B 2.88B 2.39B 2.88B
Lease liabilities (USD) — — — 581M 760M 854M 659M 731M 846M 960M
Cash and deposits (USD) 1.19B 1.26B 1.16B 1.39B 1.57B 1.48B 1.8B 2.2B 1.93B 1.74B
Intangible assets (USD) 285M 279M 257M 210M 182M 158M 142M 143M 273M 603M
Right-of-use assets (USD) — — — 363M 390M 500M 367M 360M 462M 614M
Net debt (borrowings + leases - cash) (USD) 888M 1.26B 1.33B 1.92B 2.07B 2.25B 1.73B 1.41B 1.8B 2.6B
Cash flow detail
Operating cash flow (USD) 1.26B 934M 1.19B 1.26B 1.43B 1.65B 1.73B 1.72B 1.64B 2B
Purchases of property, plant and equipment (USD) -716M -1.04B -1.01B -983M -1.16B -1.39B -1.03B -784M -468M -628M
Change in receivables (cash effect) (USD) -31.4M -316M -587M -136M -283M -878M 267M -200M -504M -2.39B
Change in inventories (cash effect) (USD) -445M -499M 483M -77.3M -1.28B -1.73B 370M 1.18B -431M -2.68B
Change in payables (cash effect) (USD) 744M 815M 962M 593M 1.31B 2.87B -853M 106M 1.43B 7.98B
Dividends paid (cash effect) (USD) -60M -57.8M -52M -50.5M -50M -48M -45M -42M -36M -35M
Share buybacks (cash effect) (USD) -307M -450M -350M -215M -428M -696M -487M -2.5B -1B -1.06B
Interest paid (cash effect) (USD) -131M -167M -186M -183M -124M -150M -211M -167M -162M -189M
Income taxes paid (cash effect) (USD) -188M -180M -168M -164M -211M -209M -319M -502M -330M -351M
Share-based compensation (USD) 48.5M 98.5M 61.3M 83.1M 102M 81M 95M 89M 107M 140M
Operating cash flow before change in receivables (USD) 1.29B 1.25B 1.78B 1.39B 1.72B 2.53B 1.47B 1.92B 2.14B 4.4B
Free cash flow (OCF - PPE - intangibles) (USD) 540M -103M 188M 274M 274M 266M 704M 932M 1.17B 1.37B
Income detail
Research and development expense (USD) 29.7M 38.5M 42.9M 44.1M 34M 33M 34M 39M 26M 30M
↳ 5y CAGR +2.8% +6.2% +8.4% +9.8% +1.2% +2.1% -2.5% -1.9% -10.0% -2.5%
Total comprehensive income (USD) 222M 13.5M 226M 105M 707M 979M 843M 1.36B 686M 1.05B
Comprehensive income to owners (USD) 224M 12.3M 224M 103M 705M 979M 843M 1.36B 686M 1.05B
Provision for credit losses (USD) 10.1M 38M 15.9M 32.1M 6M 0.00 — — — —
Credit cost ratio (credit losses / average receivables) (%) — — — — — 0.0% — — — —
Reported Oct 19, 2017 Oct 19, 2018 Oct 22, 2019 Oct 22, 2020 Oct 25, 2022 Oct 25, 2022 Oct 20, 2023 Oct 28, 2024 Oct 17, 2025 Oct 23, 2026

Sign up to see institutional holdings

Sign Up

Podcast Mentions

Sign up to see podcast mentions and sentiment

Sign Up

Jabil Declares Quarterly Dividend Bull 0 Bear 0 Capital return

October 22, 2026

ST. PETERSBURG, Fla.--(BUSINESS WIRE)-- Jabil Inc. (NYSE: JBL) today announced that its Board of Directors declared a quarterly dividend of $0.08 per share of common stock to shareholders of record as of November 16, 2026. The dividend is payable on December 2, 2026.

Jabil has paid consecutive quarterly cash dividends on its common shares since May 15, 2006.

About Jabil:

At Jabil (NYSE: JBL), we are proud to be a trusted partner for the world's top brands, offering comprehensive engineering, supply chain, and manufacturing solutions. With 60 years of experience across industries and a vast network of over 120 sites worldwide, Jabil combines global reach with local expertise to deliver both scalable and customized solutions. Our commitment extends beyond business success as we strive to build sustainable processes that minimize environmental impact and foster vibrant and diverse communities around the globe. Discover more at www.jabil.com .

**Investor Contact
**Adam Berry
Senior Vice President, Investor Relations and Corporate Affairs
[email protected]

**Media Contact
**Timur Aydin
Senior Director, Enterprise Marketing and Communications
[email protected]

Source: Jabil, Inc.

Multimedia Files:

View All News

Investor Contact

[email protected]

Quick Links

Investor Alerts Sign up

To opt-in for investor email alerts, please enter your email address in the field below and select at least one alert option. After submitting your request, you will receive an activation email to the requested email address. You must click the activation link in order to complete your subscription. You can sign up for additional alert options at any time.

At Jabil, we promise to treat your data with respect and will not share your information with any third party. You can unsubscribe to any of the investor alerts you are subscribed to by visiting the ‘unsubscribe’ section below. If you experience any issues with this process, please contact us for further assistance.

By providing your email address below, you are providing consent to Jabil to send you the requested Investor Email Alert updates.

* Required

Email Address * Mailing Lists *

Press Releases
Events/Presentations
Reports
SEC Filings
Stock Quote
Email preferences

Submit Sign Up

Email Alert Sign Up Confirmation

Jabil Logo

At Jabil we strive to make ANYTHING POSSIBLE and EVERYTHING BETTER. We are proud to be a trusted partner for the world's top brands, offering comprehensive engineering, manufacturing, and supply chain solutions. With over 50 years of experience across industries and a vast network of over 100 sites worldwide, Jabil combines global reach with local expertise to deliver both scalable and customized solutions. Our commitment extends beyond business success as we strive to build sustainable processes that minimize environmental impact and foster vibrant and diverse communities around the globe.

Follow Us

Twitter LinkedIn Facebook Instagram Blog

Tweets by Jabil

© Jabil Inc. 2026. All Rights Reserved

Powered By Q4 Inc. 5.190.1.9 (opens in new window)

October 13, 2026

  • Download (opens in new window)

  • The Memorandum of Understanding (MoU) sets out a proposed joint venture (JV) between Jabil and Adani for building a multi-gigawatt AI infrastructure platform in India — spanning AI racks, servers, networking, power and cooling systems.

  • The proposed JV aims to serve India’s accelerating data center demand, with industry forecasts projecting capacity of 5–8 GW by 2030 and more than $50 billion in planned hyperscaler spending across data center, cloud and AI ecosystems.

  • The companies estimate the global market opportunity at more than $3 trillion over the next seven years, as investment in AI compute infrastructure continues to surge.

  • Once established, the JV would serve the world’s leading AI ecosystem players — from hyperscalers and neoclouds to data center operators and enterprises — with infrastructure Made-in-India for India and for the world.

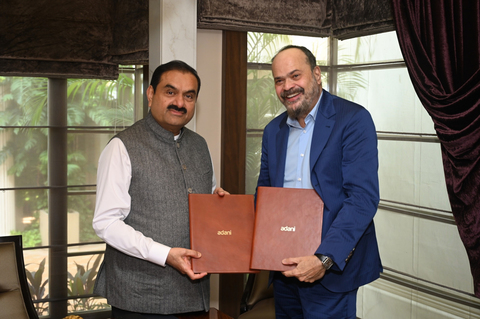
NEW DELHI, India & ST. PETERSBURG, Fla.--(BUSINESS WIRE)-- Adani Enterprises Limited (AEL), the flagship company of the Adani Group, and Jabil Inc. (NYSE: JBL), a global engineering, supply chain and manufacturing company, have signed a non-binding Memorandum of Understanding (MoU) setting out the framework for a proposed 50:50 joint venture to manufacture and assemble artificial intelligence (AI) and data center equipment in India.

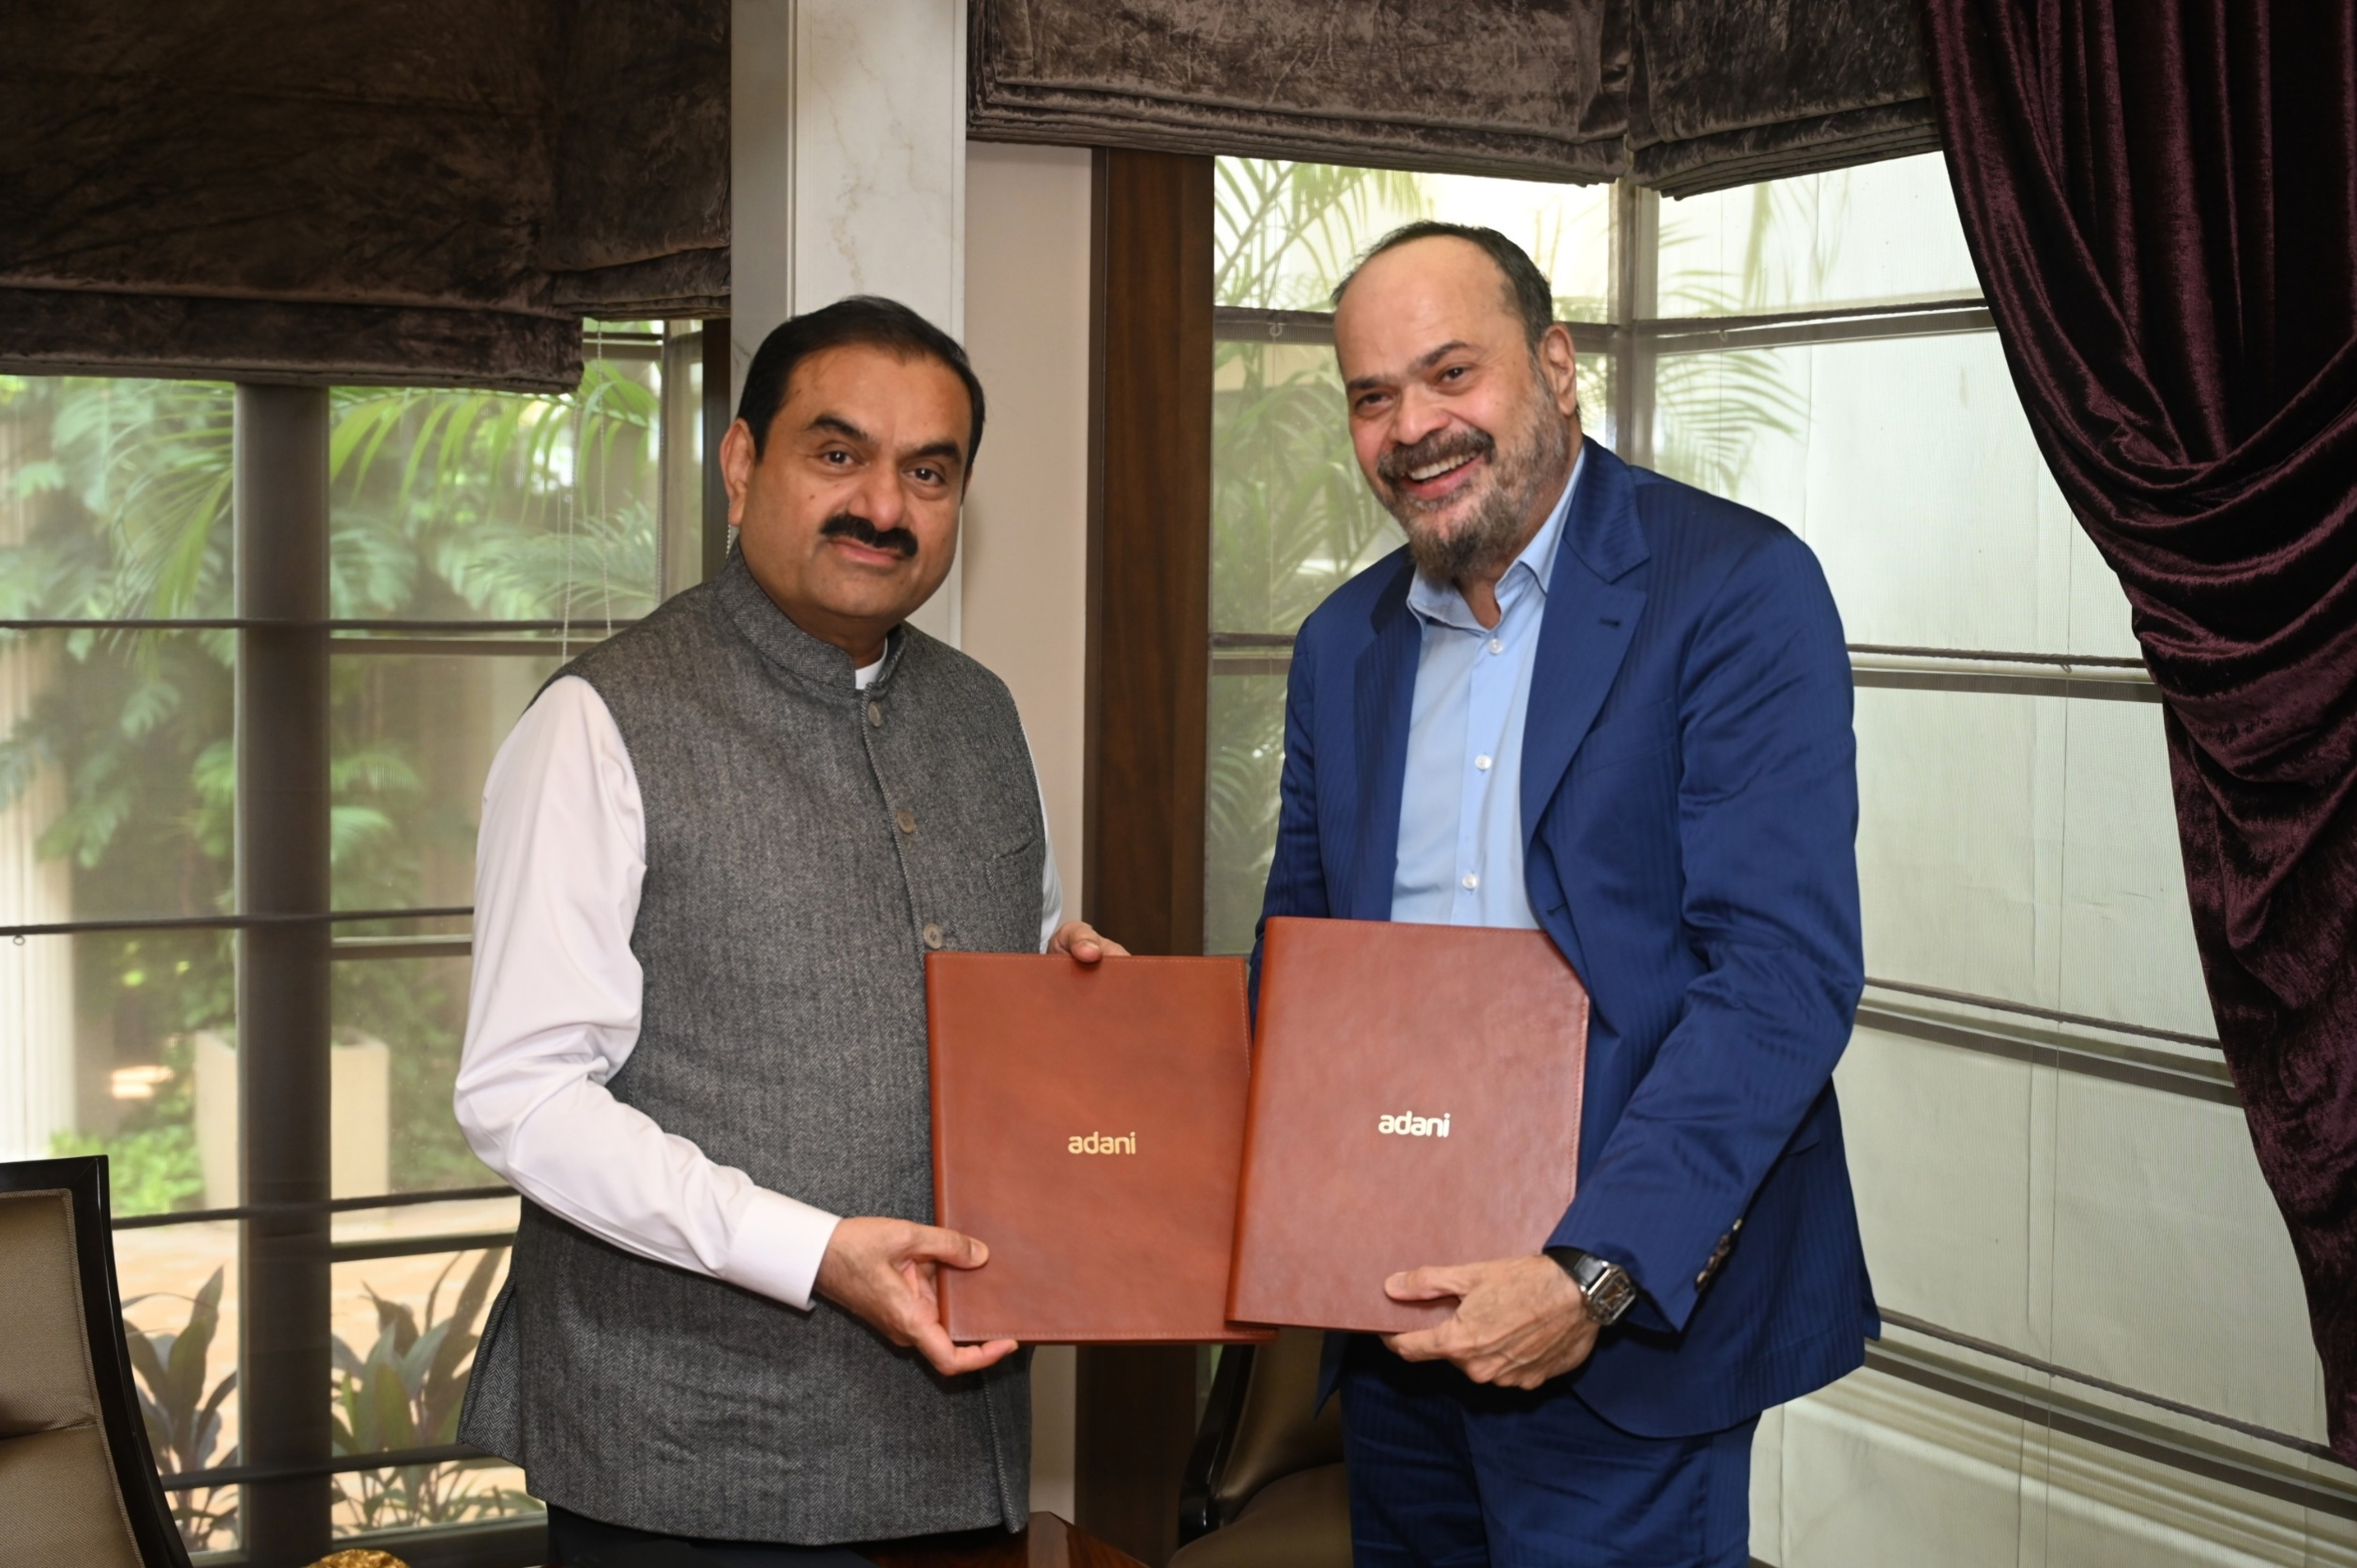
Mr. Gautam Adani, Chairman, Adani Group (left), and Mr. Mike Dastoor, CEO, Jabil (right). The companies have signed a non-binding MoU setting out the framework for a proposed 50:50 joint venture to manufacture and assemble artificial intelligence and data center equipment in India.

Mr. Gautam Adani, Chairman, Adani Group (left), and Mr. Mike Dastoor, CEO, Jabil (right). The companies have signed a non-binding MoU setting out the framework for a proposed 50:50 joint venture to manufacture and assemble artificial intelligence and data center equipment in India.

The proposed joint venture remains subject to execution of definitive agreements and satisfaction of applicable approvals and customary conditions.

The MoU follows the June 2026 announcement of Adani Group and Jabil’s intent to establish a strategic alliance to develop an AI and data center infrastructure manufacturing ecosystem in India.

Mr. Gautam Adani, Chairman, Adani Group, said: “The AI revolution will demand far more than just breakthroughs in algorithms. It will require an entire new industrial architecture where energy, hyperscale infrastructure, advanced computing and precision manufacturing converge to power the intelligence economy.”

“At Adani, our vision is to expand up the AI value chain evolving from powering and hosting AI infrastructure to engineering and manufacturing the critical systems that will define the next generation of computing.”

“Our proposed joint venture with Jabil marks a strategic step towards this future, combining Jabil’s world-class engineering and manufacturing capabilities with Adani’s integrated strengths in energy, infrastructure and data centers to help build the physical backbone of the global AI economy.”

Mr. Mike Dastoor, Chief Executive Officer (CEO), Jabil Inc., said: “The signing of this MoU is the next step forward in our shared efforts to establish a scaled AI infrastructure manufacturing platform in India, a market we believe will become increasingly important for both domestic and global AI infrastructure demand. Integrating Jabil’s 60 years of engineering and manufacturing expertise with Adani’s significant infrastructure and energy capabilities, we can bring our rack-level data center solutions to more hyperscalers in India and around the world. We look forward to building on the work we started together in June.”

Manufacturing AI Hardware in India

The joint venture would manufacture and assemble AI racks, servers, storage and networking equipment used in data centers. The racks would house high-performance computing systems for AI applications and other digital services.

The portfolio would also include equipment required to power and cool these systems, including power distribution units, liquid-cooling systems and transformers.

The venture is expected to have multi-gigawatt AI rack manufacturing capacity, supporting computing systems with a combined power capacity of several gigawatts. It would also provide installation and commissioning services.

India’s Data Center Opportunity

India’s data center capacity is projected to reach 5–8 gigawatts (GW) by 2030, driven by AI adoption, cloud expansion and data localization.

The venture would provide a manufacturing base in India to serve domestic demand and support exports. The companies estimate the global market opportunity at more than $3 trillion over the next seven years, driven by investment in AI computing.

The Digital Personal Data Protection Act, 2023, provides a framework for personal data protection. This legal safeguard, complemented by the Union Budget 2026 tax holiday for data centers until 2047, is expected to support investment in domestic data infrastructure.

The venture is aligned with Adani Group’s $100 billion commitment to develop 5 GW of green-energy-powered, hyperscale AI-ready data centers by 2035. The proposed venture would add hardware manufacturing to the Group’s presence across infrastructure, energy, logistics and data centers.

For Jabil, which reported $36 billion in revenue in fiscal year 2026, the venture would expand its engineering and manufacturing footprint in India’s data center market. The company has also expanded its data center capabilities through the acquisition of Hanley Energy Group , which provides critical power and energy management solutions, and Mikros Technologies , which specializes in liquid-cooling solutions for high-performance computing systems.

FORWARD-LOOKING STATEMENTS

This release contains forward-looking statements, including those regarding the potential strategic collaboration with Adani Group. The statements in this release are based on current expectations, forecasts and assumptions involving risks and uncertainties that could cause actual outcomes and results to differ materially from our current expectations. Forward-looking statements could be affected by the following factors, among others, related to the potential alliance: the occurrence of any event, change or other circumstances that could give rise to the termination of work on the alliance, including the possibility of not being able to satisfactorily negotiate and execute a binding agreement regarding the collaboration; unexpected costs or unexpected liabilities that may arise from the potential alliance; the impact of changes in economic, market, political or social conditions; and future regulatory or legislative actions that could adversely affect the parties. Additional factors that could cause such differences can be found in Jabil’s Annual Report on Form 10-K for the fiscal year ended August 31, 2025 and Jabil’s other filings with the Securities and Exchange Commission. Jabil assumes no obligation to update these forward-looking statements.

About Adani Group:

Headquartered in Ahmedabad, India, Adani Group is one of India's largest integrated infrastructure conglomerates with interests in Resources, Logistics, Energy, Agro, Real Estate, Public Transport Infrastructure, Consumer Finance, and Defence. Driven by its core philosophy of ‘Nation Building’ and ‘Growth with Goodness’, the Group is committed to sustainable development and regional transformation. Further information at www.adani.com .

About Jabil:

At Jabil (NYSE: JBL), we are proud to be a trusted partner for the world's top brands, offering comprehensive engineering, supply chain, and manufacturing solutions. With 60 years of experience across industries and a vast network of over 120 sites worldwide, Jabil combines global reach with local expertise to deliver both scalable and customized solutions. Our commitment extends beyond business success as we strive to build sustainable processes that minimize environmental impact and foster vibrant and diverse communities around the globe. Discover more at www.jabil.com .

Media Contacts
For Adani Group
Roy Paul
[email protected]

For Jabil
Timur Aydin
Senior Director, Enterprise Marketing and Communications
[email protected]

Source: Jabil, Inc.

Multimedia Files:

  • Mr. Gautam Adani, Chairman, Adani Group (left), and Mr. Mike Dastoor, CEO, Jabil (right). The companies have signed a non-binding MoU setting out the framework for a proposed 50:50 joint venture to manufacture and assemble artificial intelligence and data center equipment in India.

    Mr. Gautam Adani, Chairman, Adani Group (left), and Mr. Mike Dastoor, CEO, Jabil (right). The companies have signed a non-binding MoU setting out the framework for a proposed 50:50 joint venture to manufacture and assemble artificial intelligence and data center equipment in India.

    Download:

    Download original 7822 KB (6048 x 4024) Download image: Mr. Gautam Adani, Chairman, Adani Group (left), and Mr. Mike Dastoor, CEO, Jabil (right). The companies have signed a non-binding MoU setting out the framework for a proposed 50:50 joint venture to manufacture and assemble artificial intelligence and data center equipment in India. as a original in JPG format. Opens in a new window

    Download thumbnail 75 KB (200 x 133) Download image: Mr. Gautam Adani, Chairman, Adani Group (left), and Mr. Mike Dastoor, CEO, Jabil (right). The companies have signed a non-binding MoU setting out the framework for a proposed 50:50 joint venture to manufacture and assemble artificial intelligence and data center equipment in India. as a thumbnail in JPG format. Opens in a new window

    Download lowres 393 KB (480 x 319) Download image: Mr. Gautam Adani, Chairman, Adani Group (left), and Mr. Mike Dastoor, CEO, Jabil (right). The companies have signed a non-binding MoU setting out the framework for a proposed 50:50 joint venture to manufacture and assemble artificial intelligence and data center equipment in India. as a lowres in JPG format. Opens in a new window

    Download square 164 KB (250 x 250) Download image: Mr. Gautam Adani, Chairman, Adani Group (left), and Mr. Mike Dastoor, CEO, Jabil (right). The companies have signed a non-binding MoU setting out the framework for a proposed 50:50 joint venture to manufacture and assemble artificial intelligence and data center equipment in India. as a square in JPG format. Opens in a new window

  • Company's logo

    Company's logo

    Download:

    Download original 141 KB (2989 x 524) Download image: Company's logo as a original in JPG format. Opens in a new window

    Download thumbnail 3 KB (200 x 35) Download image: Company's logo as a thumbnail in JPG format. Opens in a new window

    Download lowres 7 KB (480 x 84) Download image: Company's logo as a lowres in JPG format. Opens in a new window

    Download square 4 KB (250 x 250) Download image: Company's logo as a square in JPG format. Opens in a new window

View All News

Investor Contact

[email protected]

Quick Links

Investor Alerts Sign up

To opt-in for investor email alerts, please enter your email address in the field below and select at least one alert option. After submitting your request, you will receive an activation email to the requested email address. You must click the activation link in order to complete your subscription. You can sign up for additional alert options at any time.

At Jabil, we promise to treat your data with respect and will not share your information with any third party. You can unsubscribe to any of the investor alerts you are subscribed to by visiting the ‘unsubscribe’ section below. If you experience any issues with this process, please contact us for further assistance.

By providing your email address below, you are providing consent to Jabil to send you the requested Investor Email Alert updates.

* Required

Email Address * Mailing Lists *

Press Releases
Events/Presentations
Reports
SEC Filings
Stock Quote
Email preferences

Submit Sign Up

Email Alert Sign Up Confirmation

Jabil Logo

At Jabil we strive to make ANYTHING POSSIBLE and EVERYTHING BETTER. We are proud to be a trusted partner for the world's top brands, offering comprehensive engineering, manufacturing, and supply chain solutions. With over 50 years of experience across industries and a vast network of over 100 sites worldwide, Jabil combines global reach with local expertise to deliver both scalable and customized solutions. Our commitment extends beyond business success as we strive to build sustainable processes that minimize environmental impact and foster vibrant and diverse communities around the globe.

Follow Us

Twitter LinkedIn Facebook Instagram Blog

Tweets by Jabil

© Jabil Inc. 2026. All Rights Reserved

Powered By Q4 Inc. 5.190.1.9 (opens in new window)

September 30, 2026

Provides Strong Fiscal 2027 Outlook

ST. PETERSBURG, Fla.--(BUSINESS WIRE)-- Today, Jabil Inc. (NYSE: JBL), reported preliminary, unaudited financial results for its fourth quarter and fiscal year ended August 31, 2026.

“We delivered a fourth quarter that exceeded our expectations, closing an exceptional fiscal 2026 in which we grew revenue 21%, expanded core operating margin 40 basis points and generated more than $1.5 billion in adjusted free cash flow,” said CEO Mike Dastoor. “Our teams supported significant growth in AI infrastructure, delivered strong performance across several other end markets and brought critical new capacity online. These results reflect the progress we’ve made in moving up the value chain, taking on more of our customers’ engineering and manufacturing complexity while maintaining an asset-light model. I’m proud of our teams and the stronger business we’re building together.”

Fourth Quarter of Fiscal Year 2026 Highlights:

  • Net revenue: $10.6 billion
  • U.S. GAAP operating income: $602 million
  • U.S. GAAP diluted earnings per share: $3.76
  • Core operating income (Non-GAAP): $675 million
  • Core diluted earnings per share (Non-GAAP): $4.40

Fiscal Year 2026 Highlights:

  • Net revenue: $36.0 billion
  • U.S. GAAP operating income: $1.7 billion
  • U.S. GAAP diluted earnings per share: $9.75
  • Core operating income (Non-GAAP): $2.1 billion
  • Core diluted earnings per share (Non-GAAP): $13.09

First Quarter of Fiscal Year 2027 Outlook:

• Net revenue $10.6 billion to $11.4 billion
• U.S. GAAP operating income $481 million to $541 million
• U.S. GAAP diluted earnings per share $2.78 to $3.18 per diluted share
• Core operating income (Non-GAAP)(1) $592 million to $652 million
• Core diluted earnings per share (Non-GAAP)(1) $3.80 to $4.20 per diluted share
____________________
(1) Core operating income and core diluted earnings per share exclude anticipated adjustments of $24 million for amortization of intangibles (or $0.21 per diluted share) and $62 million for stock-based compensation expense and related charges (or $0.58 per diluted share) and $25 million (or $0.23 per diluted share) for restructuring, severance and related charges.

“Our fiscal 2027 outlook reflects the strength of Jabil’s diversified portfolio, with accelerating AI demand complemented by solid growth in automotive, healthcare, energy infrastructure, defense and aerospace, and warehouse and retail automation,” Dastoor continued. “This breadth of growth, together with expanding customer relationships and committed business supporting our new capacity, gives us confidence in the year ahead. We expect revenue of $44.5 billion, up 24%, core operating margin expansion of 30 basis points to 6.1%, core diluted earnings per share growth of 34% to $17.55, and adjusted free cash flow of approximately $1.6 billion. As customers turn to Jabil for more of their engineering, supply chain and manufacturing needs, we see significant opportunities to sustain profitable growth, invest in our capabilities and return substantial capital to shareholders.”

Fiscal Year 2027 Outlook:

• Net revenue $44.5 billion
• Core operating margin (Non-GAAP) 6.1%
• Core diluted earnings per share (Non-GAAP) $17.55 per diluted share
• Adjusted free cash flow (Non-GAAP) ~$1.6 billion

(Definitions: “U.S. GAAP” means U.S. generally accepted accounting principles. Jabil defines core operating income as U.S. GAAP operating income less amortization of intangibles, stock-based compensation expense and related charges, restructuring, severance and related charges, distressed customer charges, loss on disposal of subsidiaries, settlement of receivables and related charges, impairment of notes receivable and related charges, goodwill impairment charges, business interruption and impairment charges, net, (gain) loss from the divestiture of businesses, acquisition and divestiture related charges, plus other components of net periodic benefit cost. Jabil defines core earnings as core operating income, less loss on debt extinguishment, loss (gain) on securities, other components of net periodic benefit cost, income (loss) from discontinued operations, gain (loss) on sale of discontinued operations and certain other expenses, net of tax and certain deferred tax valuation allowance charges. Jabil defines core diluted earnings per share as core earnings divided by the weighted average number of outstanding diluted shares as determined under U.S. GAAP. Jabil defines adjusted free cash flow as net cash provided by (used in) operating activities less net capital expenditures (acquisition of property, plant and equipment less proceeds and advances from sale of property, plant and equipment). Jabil reports core operating income, core earnings, core diluted earnings per share and adjusted free cash flow to provide investors an additional method for assessing operating income, earnings, diluted earnings per share and free cash flow from what it believes are its core manufacturing operations. See the accompanying reconciliation of Jabil’s core operating income to its U.S. GAAP operating income, its calculation of core earnings and core diluted earnings per share to its U.S. GAAP net income and U.S. GAAP earnings per share and additional information in the supplemental information.)

Forward Looking Statements: This release contains forward-looking statements, including those regarding our anticipated financial results for our fourth quarter and full fiscal year 2026 and our guidance for future financial performance in our first quarter of fiscal year 2027 (including, net revenue, U.S. GAAP operating income, U.S. GAAP diluted earnings per share, core operating income (Non-GAAP), core diluted earnings per share (Non-GAAP) results and the components thereof, including but not limited to amortization of intangibles, stock-based compensation expense and related charges and restructuring, severance and related charges); and our full year 2027 (including net revenue, core operating margin (Non-GAAP), core diluted earnings per share (Non-GAAP), the components thereof and adjusted free cash flow (Non-GAAP)). The statements in this release are based on current expectations, forecasts and assumptions involving risks and uncertainties that could cause actual outcomes and results to differ materially from our current expectations. Such factors include, but are not limited to: our determination as we finalize our financial results for our fourth quarter and full fiscal year 2026 that our financial results and conditions differ from our current preliminary unaudited numbers set forth herein; scheduling production, managing growth and capital expenditures and maximizing the efficiency of our manufacturing capacity effectively; managing rapid declines or increases in customer demand and other related customer challenges that may occur; our dependence on a limited number of customers; our ability to purchase components efficiently and reliance on a limited number of suppliers for critical components; risks arising from relationships with emerging companies; changes in technology and competition in our industry; our ability to introduce new business models or programs requiring implementation of new competencies; competition; transportation issues; our ability to maintain our engineering, technological and manufacturing expertise; retaining key personnel; risks associated with international sales and operations, including geopolitical uncertainties; energy price increases or shortages; our ability to achieve expected profitability from acquisitions; risk arising from our restructuring activities; issues involving our information systems, including security issues; regulatory risks (including the expense of complying, or failing to comply, with applicable regulations; risk arising from design or manufacturing defects; risk arising from compliance, or failure to comply, with environmental, health and safety laws or regulations; risk arising from litigation; and intellectual property risk); financial risks (including customers or suppliers who become financially troubled; turmoil in financial markets; tax risks; credit rating risks; risks of exposure to debt; currency fluctuations; and asset impairment); changes in financial accounting standards or policies; risk of natural disaster, climate change or other global events; and risks arising from expectations relating to environmental, social and governance considerations. Additional factors that could cause such differences can be found in our Annual Report on Form 10-K for the fiscal year ended August 31, 2025 and our other filings with the Securities and Exchange Commission. We assume no obligation to update these forward-looking statements.

Supplemental Information Regarding Non-GAAP Financial Measures: Jabil provides supplemental, non-GAAP financial measures in this release to facilitate evaluation of Jabil’s core operating performance. These non-GAAP measures exclude certain amounts that are included in the most directly comparable U.S. GAAP measures, do not have standard meanings and may vary from the non-GAAP financial measures used by other companies. Management believes these “core” financial measures are useful measures that facilitate evaluation of the past and future performance of Jabil’s ongoing operations on a comparable basis.

Jabil reports core operating income, core earnings, core diluted earnings per share and adjusted free cash flows to provide investors an additional method for assessing operating income, earnings, earnings per share and free cash flow from what it believes are its core manufacturing operations. Among other uses, management uses non-GAAP financial measures to make operating decisions, assess business performance and as a factor in determining certain employee performance when determining incentive compensation.

The Company uses an annual normalized tax rate (“normalized core tax rate”) for the computation of the non-GAAP (core) income tax provision to provide better consistency across reporting periods. In estimating the normalized core tax rate annually, the Company utilizes a full-year financial projection of core earnings that considers the mix of earnings across tax jurisdictions, existing tax positions, and other significant tax matters. The Company may adjust the normalized core tax rate during the year for material impacts from new tax legislation or material changes to the Company’s operations.

Detailed definitions of certain of the core financial measures are included above under “Definitions” and a reconciliation of the disclosed core financial measures to the most directly comparable U.S. GAAP financial measures is included under the heading “Supplemental Data” at the end of this release.

Meeting and Replay Information: Jabil will hold a conference call today at 8:30 a.m. ET to discuss its earnings for the fourth quarter and full fiscal year ended August 31, 2026 and to provide an investor briefing. To access the live audio webcast and view the accompanying slide presentation, visit the Investor Relations section of Jabil’s website, located at https://investors.jabil.com . An archived replay of the webcast will also be available after completion of the call.

About Jabil: At Jabil (NYSE: JBL), we are proud to be a trusted partner for the world’s top brands, offering comprehensive engineering, supply chain, and manufacturing solutions. With 60 years of experience across industries and a vast network of over 100 sites worldwide, Jabil combines global reach with local expertise to deliver both scalable and customized solutions. Our commitment extends beyond business success as we strive to build sustainable processes that minimize environmental impact and foster vibrant and diverse communities around the globe. Discover more at www.jabil.com .

JABIL INC. AND SUBSIDIARIES
CONDENSED CONSOLIDATED BALANCE SHEETS
(in millions)
August 31, 2026
(unaudited) August 31, 2025
ASSETS
Current assets:
Cash and cash equivalents $ 1,739 $ 1,933
Accounts receivable, net 6,513 4,039
Contract assets 1,296 1,057
Inventories, net 7,413 4,681
Prepaid expenses and other current assets 4,559 2,010
Total current assets 21,520 13,720
Property, plant and equipment, net 3,005 2,847
Operating lease right-of-use assets 614 462
Goodwill and intangible assets, net 1,828 1,114
Deferred income taxes 178 141
Other assets 290 259
Total assets $ 27,435 $ 18,543
LIABILITIES AND EQUITY
Current liabilities:
Current installments of notes payable and long-term debt $ 499 $ 499
Accounts payable 14,444 7,937
Accrued expenses 6,619 5,185
Current operating lease liabilities 111 93
Total current liabilities 21,673 13,714
Notes payable and long-term debt, less current installments 2,880 2,386
Other liabilities 421 345
Non-current operating lease liabilities 530 388
Income tax liabilities 170 113
Deferred income taxes 144 80
Total liabilities 25,818 17,026
Commitments and contingencies
Equity:
Jabil Inc. stockholders’ equity:
Preferred stock — —
Common stock — —
Additional paid-in capital 3,255 3,047
Retained earnings 7,390 6,382
Accumulated other comprehensive loss (12 ) (17 )
Treasury stock, at cost (9,020 ) (7,899 )
Total Jabil Inc. stockholders’ equity 1,613 1,513
Noncontrolling interests 4 4
Total equity 1,617 1,517
Total liabilities and equity $ 27,435 $ 18,543
JABIL INC. AND SUBSIDIARIES
CONDENSED CONSOLIDATED STATEMENTS OF OPERATIONS
(in millions, except for per share data)
(Unaudited)
Three Months Ended Fiscal Year Ended
August 31, 2026 August 31, 2025 August 31, 2026 August 31, 2025
Net revenue $ 10,616 $ 8,252 $ 35,954 $ 29,802
Cost of revenue 9,615 7,469 32,637 27,156
Gross profit 1,001 783 3,317 2,646
Operating expenses:
Selling, general and administrative 324 264 1,222 1,015
Stock-based compensation expense and related charges 25 23 140 107
Research and development 7 4 30 26
Amortization of intangibles 24 17 89 62
Restructuring, severance and related charges 9 37 97 181
Loss from the divestiture of businesses — 98 1 53
Acquisition and divestiture related charges 10 3 34 20
Operating income 602 337 1,704 1,182
Loss on securities — — — 46
Interest and other, net 80 58 296 244
Income before income tax 522 279 1,408 892
Income tax expense 125 61 368 235
Net income 397 218 1,040 657
Net loss attributable to noncontrolling interests, net of tax (1 ) — (2 ) —
Net income attributable to Jabil Inc. $ 398 $ 218 $ 1,042 $ 657
Earnings per share attributable to the stockholders of Jabil Inc.:
Basic $ 3.80 $ 2.03 $ 9.86 $ 6.00
Diluted $ 3.76 $ 1.99 $ 9.75 $ 5.92
Weighted average shares outstanding:
Basic 104.8 107.5 105.8 109.5
Diluted 106.0 109.2 106.9 110.9
JABIL INC. AND SUBSIDIARIES
CONDENSED CONSOLIDATED STATEMENTS OF CASH FLOWS
(in millions)
(Unaudited)
Fiscal Year Ended
August 31, 2026 August 31, 2025
Cash flows from operating activities:
Net income $ 1,040 $ 657
Adjustments to reconcile net income to net cash provided by operating activities:
Depreciation and amortization 681 674
Restructuring and related charges 47 88
Recognition of stock-based compensation expense and related charges 140 107
Deferred income taxes (21 ) (124 )
Loss from the divestiture of businesses 1 53
Other, net (24 ) (2 )
Change in operating assets and liabilities, exclusive of net assets acquired:
Accounts receivable (2,394 ) (504 )
Contract assets (221 ) 22
Inventories (2,681 ) (431 )
Prepaid expenses and other current assets (2,538 ) (310 )
Other assets (12 ) (16 )
Accounts payable, accrued expenses and other liabilities 7,984 1,426
Net cash provided by operating activities 2,002 1,640
Cash flows from investing activities:
Acquisition of property, plant and equipment (628 ) (468 )
Proceeds and advances from sale of property, plant and equipment 158 146
Cash paid for business and intangible asset acquisitions, net of cash (852 ) (392 )
Proceeds from the divestiture of businesses, net of cash — 7
Other, net (13 ) (7 )
Net cash used in investing activities (1,335 ) (714 )
Cash flows from financing activities:
Borrowings under debt agreements 2,773 1,844
Payments toward debt agreements (2,528 ) (1,986 )
Payments to acquire treasury stock (1,060 ) (1,000 )
Dividends paid to stockholders (35 ) (36 )
Net proceeds from exercise of stock options and issuance of common stock under employee stock purchase plan 74 62
Treasury stock minimum tax withholding related to vesting of restricted stock (67 ) (42 )
Other, net (23 ) (46 )
Net cash used in financing activities (866 ) (1,204 )
Effect of exchange rate changes on cash and cash equivalents 5 10
Net decrease in cash and cash equivalents (194 ) (268 )
Cash and cash equivalents at beginning of period 1,933 2,201
Cash and cash equivalents at end of period $ 1,739 $ 1,933
JABIL INC. AND SUBSIDIARIES
SUPPLEMENTAL DATA
RECONCILIATION OF U.S. GAAP FINANCIAL RESULTS TO NON-GAAP MEASURES
(in millions, except for per share data)
(Unaudited)
Three Months Ended Fiscal Year Ended
August 31, 2026 August 31, 2025 August 31, 2026 August 31, 2025
Net revenue $ 10,616 $ 8,252 $ 35,954 $ 29,802
Operating income (U.S. GAAP) $ 602 $ 337 $ 1,704 $ 1,182
Amortization of intangibles 24 17 89 62
Stock-based compensation expense and related charges 25 23 140 107
Restructuring, severance and related charges(1) 9 37 97 181
Net periodic benefit cost 5 6 4 7
Business interruption and impairment charges, net(2) — (2 ) — 8
Loss from the divestiture of businesses(3) — 98 1 53
Acquisition and divestiture related charges(4) 10 3 34 20
Adjustments to operating income 73 182 365 438
Core operating income (Non-GAAP) $ 675 $ 519 $ 2,069 $ 1,620
Operating margin (U.S. GAAP) 5.7 % 4.1 % 4.7 % 4.0 %
Core operating margin (Non-GAAP) 6.4 % 6.3 % 5.8 % 5.4 %
Net income attributable to Jabil Inc. (U.S. GAAP) $ 398 $ 218 $ 1,042 $ 657
Adjustments to operating income 73 182 365 438
Loss on securities(5) — — — 46
Net periodic benefit cost (5 ) (6 ) (4 ) (7 )
Adjustments for taxes — (34 ) (4 ) (52 )
Core earnings (Non-GAAP) $ 466 $ 360 $ 1,399 $ 1,082
Diluted earnings per share (U.S. GAAP) $ 3.76 $ 1.99 $ 9.75 $ 5.92
Diluted core earnings per share (Non-GAAP) $ 4.40 $ 3.29 $ 13.09 $ 9.75
Diluted weighted average shares outstanding (U.S. GAAP and Non-GAAP) 106.0 109.2 106.9 110.9
____________________
(1) Charges recorded during the three months and fiscal year ended August 31, 2026, relate to targeted restructuring activities to optimize our cost structure and improve operational efficiencies. Charges recorded during the three months and fiscal year ended August 31, 2025, primarily related to the 2025 Restructuring Plan.
(2) Charges recorded during the fiscal year ended August 31, 2025, related primarily to costs associated with damage from Hurricanes Helene and Milton, which impacted our operations in St. Petersburg, Florida and Asheville and Hendersonville, North Carolina.
(3) Charges recorded during the three months and fiscal year ended August 31, 2025, related primarily to a pre-tax loss of $97 million recognized for the divestiture of our operations in Italy. Additionally, certain post-closing adjustments associated with the divestiture of the Mobility Business were realized during the fiscal year ended August 31, 2025, which resulted in the recognition of a $54 million pre-tax gain.
(4) Charges recorded during the fiscal year ended August 31, 2026, include $8 million of gains on forward foreign exchange contracts in connection with the acquisition of Hanley Energy Group.
(5) Charges recorded during the fiscal year ended August 31, 2025, related to an impairment of an investment in Preferred Stock.
JABIL INC. AND SUBSIDIARIES
SUPPLEMENTAL DATA
ADJUSTED FREE CASH FLOW
(in millions)
(Unaudited)
Fiscal Year Ended
August 31, 2026 August 31, 2025
Net cash provided by operating activities (U.S. GAAP) $ 2,002 $ 1,640
Acquisition of property, plant and equipment (“PP&E”) (628 ) (468 )
Proceeds and advances from sale of PP&E 158 146
Adjusted free cash flow (Non-GAAP) $ 1,532 $ 1,318

Investor Contact
Adam Berry
Senior Vice President, Investor Relations and Corporate Affairs
[email protected]

Media Contact
Timur Aydin
Senior Director, Enterprise Marketing and Communications
[email protected]

Source: Jabil, Inc.

Multimedia Files:

View All News

Investor Contact

[email protected]

Quick Links

Investor Alerts Sign up

To opt-in for investor email alerts, please enter your email address in the field below and select at least one alert option. After submitting your request, you will receive an activation email to the requested email address. You must click the activation link in order to complete your subscription. You can sign up for additional alert options at any time.

At Jabil, we promise to treat your data with respect and will not share your information with any third party. You can unsubscribe to any of the investor alerts you are subscribed to by visiting the ‘unsubscribe’ section below. If you experience any issues with this process, please contact us for further assistance.

By providing your email address below, you are providing consent to Jabil to send you the requested Investor Email Alert updates.

* Required

Email Address * Mailing Lists *

Press Releases
Events/Presentations
Reports
SEC Filings
Stock Quote
Email preferences

Submit Sign Up

Email Alert Sign Up Confirmation

Jabil Logo

At Jabil we strive to make ANYTHING POSSIBLE and EVERYTHING BETTER. We are proud to be a trusted partner for the world's top brands, offering comprehensive engineering, manufacturing, and supply chain solutions. With over 50 years of experience across industries and a vast network of over 100 sites worldwide, Jabil combines global reach with local expertise to deliver both scalable and customized solutions. Our commitment extends beyond business success as we strive to build sustainable processes that minimize environmental impact and foster vibrant and diverse communities around the globe.

Follow Us

Twitter LinkedIn Facebook Instagram Blog

Tweets by Jabil

© Jabil Inc. 2026. All Rights Reserved

Powered By Q4 Inc. 5.190.1.9 (opens in new window)

Prompts

Jabil Inc. (ticker JBL), listed in United States.

Company History

Date Change Detail
Jun 6, 2017 Renamed JABIL CIRCUIT INC → JABIL INC

ETFs Holding Jabil Inc.

ETF Weight in ETF Shares Market value As of
FCTE 5.04% 31,931 $ 12.309M Jun 30, 2026
HVAC 4.98% 2,059 $ 501.593K Nov 17, 2026
CTEF 3.85% 92,364 $ 22.5M Nov 18, 2026
STNC 2.74% 8,065 $ 2.541M Jul 31, 2026
SEIM 2.64% 102,742 $ 39.605M Jun 30, 2026
CNAV 1.89% 3,041 $ 1.172M Jun 30, 2026
JMID 1.55% 1,164 $ 366.718K Jul 31, 2026
AMOM 1.52% 1,155 $ 363.883K Jul 31, 2026
DSTL 1.27% 69,889 $ 26.941M Jun 30, 2026
TAX 1.18% 986 $ 300.986K Aug 31, 2026
DVAL 1.15% 2,150 $ 828.782K Jun 30, 2026
AVMV 0.74% 24,887 $ 6.141M Nov 16, 2026
LSVD 0.67% 13,895 $ 4.378M Jul 31, 2026
OASC 0.61% 1,878 $ 573.278K Aug 31, 2026
ACGR 0.54% 184 $ 56.168K Aug 31, 2026
AFGR 0.43% 1,431 $ 353.114K Nov 16, 2026
FLCG 0.40% 7,999 $ 2.442M Aug 31, 2026
MCDS 0.38% 123 $ 29.964K Nov 17, 2026
DUHP 0.34% 254,043 $ 66.041M Nov 12, 2026
ACVF 0.33% 1,615 $ 508.806K Jul 31, 2026
AFMC 0.30% 3,245 $ 800.736K Nov 16, 2026
AVMC 0.30% 6,814 $ 1.681M Nov 16, 2026
FEMG 0.30% 52 $ 20.045K Jun 30, 2026
GQI 0.26% 1,718 $ 662.255K Jun 30, 2026
XPND 0.23% 322 $ 79.457K Nov 16, 2026
BDVL short -0.22% -15,830 $ -3.906M Nov 16, 2026
AVSU 0.22% 4,269 $ 1.053M Nov 16, 2026
IALT 0.22% 71,441 $ 17.629M Nov 16, 2026
BALQ 0.22% 371 $ 91.548K Nov 16, 2026
JGRO 0.21% 76,319 $ 18.592M Nov 17, 2026
AFLG 0.20% 7,645 $ 1.886M Nov 16, 2026
THRO 0.20% 83,675 $ 20.648M Nov 16, 2026
FBCG 0.17% 37,842 $ 11.922M Jul 31, 2026
AVUQ 0.17% 2,982 $ 735.838K Nov 16, 2026
DFVX 0.16% 3,605 $ 937.156K Nov 12, 2026
FLSP 0.16% 3,844 $ 1.482M Jun 30, 2026
VFMO 0.14% 8,590 $ 2.622M Aug 31, 2026
IQSZ 0.11% 595 $ 187.455K Jul 31, 2026
GSPY 0.10% 2,697 $ 665.512K Nov 17, 2026
DXUV 0.09% 22,601 $ 5.875M Nov 12, 2026
AVUS 0.09% 54,156 $ 13.364M Nov 16, 2026
ENHU 0.09% 34 $ 8,389.84 Nov 16, 2026
AVLC 0.09% 5,585 $ 1.378M Nov 16, 2026
FTLS 0.09% 9,156 $ 0.00 Nov 16, 2026
DFAC 0.08% 275,801 $ 71.697M Nov 12, 2026
MSSM 0.08% 1,809 $ 552.215K Aug 31, 2026
TRUT 0.06% 554 $ 158.92K Sep 30, 2026
VFMF 0.06% 1,925 $ 587.626K Aug 31, 2026
XMAG 0.06% 491 $ 127.64K Nov 13, 2026
AAUS 0.06% 1,345 $ 330K Nov 18, 2026
DCOR 0.06% 100,434 $ 26.109M Nov 12, 2026
DFSU 0.05% 4,762 $ 1.238M Nov 12, 2026
MODL 0.05% 1,363 $ 525.409K Jun 30, 2026
DFAU 0.05% 25,441 $ 6.614M Nov 12, 2026
JUSA 0.05% 1,818 $ 442.883K Nov 17, 2026
VOXP 0.05% 9 $ 2,835.45 Jul 31, 2026
EBI 0.05% 1,067 $ 325.712K Aug 31, 2026
NTSD 0.04% 41 $ 15.805K Jun 30, 2026
HCMT 0.04% 736 $ 231.877K Jul 31, 2026
DFUS 0.04% 32,137 $ 8.354M Nov 12, 2026
TACU 0.03% 23 $ 5,675.48 Nov 17, 2026
MSLC 0.03% 4,059 $ 1.239M Aug 31, 2026
GDE 0.03% 463 $ 141.335K Aug 31, 2026
NTSX 0.03% 1,023 $ 394.346K Jun 30, 2026
VSLU 0.02% 318 $ 122.583K Jun 30, 2026
CSHP 0.01% 207 $ 51.079K Nov 16, 2026
CORO 0.00% 66 $ 16.307K Nov 16, 2026