Imax Corporation is a technology platform for entertainment and events that provides end-to-end solutions for immersive content experiences. The company's business consists of the digital remastering of films into the IMAX format and the sale or lease of premium IMAX theater systems to exhibitors. IMAX Systems include proprietary image and audio technology, high-resolution projectors, large screens, and specialized auditorium geometry. The company serves commercial multiplex theaters, institutional locations such as museums and science centers, and destination entertainment sites. Its global network operates in numerous countries and territories, supporting the distribution of blockbuster films, IMAX Documentaries, and events in music, gaming, and sports. IMAX partners with major Hollywood studios, local film industries, and streaming platforms to release content. The company also collaborates with artists and creators for exclusive concert films and limited-run theatrical events. Imax Corporation was formed in 1994 through an amalgamation, with its predecessor incorporated in 1967. The company indirectly owns a majority stake in IMAX China Holding, Inc., a consolidated subsidiary listed on the Hong Kong Stock Exchange.

Summarised from the company's own disclosures, fiscal year ended Feb 2026

Industry Electronic Gaming & Multimedia Homepage imax.com
Sector Communication Services IR page investors.imax.com
Tags
immersive entertainment, cinema technology, film remastering, theater systems, premium formats, event experiences, documentary films, concert films, auditorium design, audio technology, IMAX, IMAX China Holding Inc., IMAX Film Remastering, IMAX System, IMAX Documentaries, Filmed For IMAX, The IMAX Experience, Ne Zha 2, Avatar: Fire and Ash, F1: The Movie, Mission: Impossible - The Final Reckoning, Demon Slayer: Infinity Castle, The Blue Angels, The Last Wolves of Yellowstone, Athos, Stormbound, Frontier, The Elephant Odyssey, Portrait of an Artist, Becoming Led Zeppelin, Prince - Sign O’ The Times, Rolling Stones - At The Max, Pink Floyd at Pompeii - MCMLXXII, Depeche Mode: M, j-hope Tour ‘Hope on Stage’ The Movie, One to One: John & Yoko, Springsteen: Deliver Me From Nowhere, G-Dragon in Cinema [Übermensch], Spinal Tap II: The End Continues, Talk to Me, Moonlight, Spring Breakers
Press page imax.com/en/th/news

Metrics

Valuation  
Market cap $ 3.025B
Market cap (USD) $ 3.025B
P/E 23.62
PEG —
P/BV 6.15
P/S 6.25
P/OCF 19.97
P/FCF 20.72
Dividend yield —
Turnover / mcap —
Returns  
ROE 10.9%
ROI 5.7%
ROIC 9.8%
Profit margin 8.5%
Growth  
Revenue growing Yes
Profits growing Yes
Revenue up 3y No
Revenue up 5y No
Earnings growth 3y (net profit CAGR) —
Quality  
Profitable Yes
Margin expanding Yes
Buying back stock No
Diluting (TTM) Yes
Debt/Equity 82.5%
Podcast bulls (TTM) Sign up
Podcast bears (TTM) Sign up
Podcast sentiment (TTM) Sign up
Podcast sentiment % (TTM) Sign up
News sentiment (TTM) 66
Quality score 0%
Insiders  
Buys, 1w Sign up
Buys, 1m Sign up
Buys, 1y Sign up
Sells, 1w Sign up
Sells, 1m Sign up
Sells, 1y Sign up

Sign up to see this company's insider trades

Figure FY 2025 FY 2024 FY 2023 FY 2022 FY 2021 FY 2020 FY 2019 FY 2018 FY 2017 FY 2016 FY 2015 FY 2014 FY 2013 FY 2012 FY 2011 FY 2010 FY 2009 FY 2008 FY 2007 FY 2006 FY 2005 FY 2004 FY 2003 FY 2002 FY 2001 FY 2000
Revenue 410.212M 352.208M 374.839M 300.805M 254.883M 137.003M 395.664M 374.401M 380.767M 377.334M 373.805M 290.541M 287.937M 284.29M 236.556M 248.614M 171.211M 106.226M 115.832M 129.27M 144.93M 135.98M 119.26M 130.65M 118.659M 173.116M
Net profit 34.876M 26.059M 25.335M -22.8M -22.329M -143.775M 46.866M 22.844M 2.344M 28.788M 55.844M 39.736M 44.115M 41.337M 15.543M 100.779M 5.021M -33.602M -26.94M -16.887M 16.598M 10.244M 231K 11.972M -145.114M -92.947M
Free cash flow 118.901M 62.409M 52.124M 8.897M 2.475M -23.708M 82.955M 96.604M 61.223M 62.594M 40.428M 46.501M 42.017M 67.575M 719K 53.148M 12.356M -9.353M — -7.822M 189K 11.091M -10.743M 18.816M 1.589M -81.732M

Figure FY 2025 FY 2024 FY 2023 FY 2022 FY 2021 FY 2020 FY 2019 FY 2018 FY 2017 FY 2016 FY 2015 FY 2014 FY 2013 FY 2012 FY 2011 FY 2010 FY 2009 FY 2008 FY 2007 FY 2006 FY 2005 FY 2004 FY 2003 FY 2002 FY 2001 FY 2000
Share price 36.96 25.6 15.02 14.66 17.84 18.02 20.43 18.81 23.15 31.4 35.54 30.9 29.48 22.48 18.33 32.28 14.03 4.64 6.65 — — — — — — —
Price performance 12m 0.44 0.7 0.02 -0.18 -0.01 -0.12 0.09 -0.19 -0.26 -0.12 0.15 0.05 0.31 0.23 -0.43 1.3 2.02 -0.3 — — — — — — — —

Filed figures

Figure Dec 2016 Dec 2017 Dec 2018 Dec 2019 Dec 2020 Dec 2021 Dec 2022 Dec 2023 Dec 2024 Dec 2025
Balance sheet detail
Trade receivables (USD) 96.3M 131M 93.3M 99.5M 56.3M 110M 136M 136M 108M 108M
↳ YoY growth -1.7% +35.5% -28.5% +6.6% -43.4% +95.5% +23.7% +0.1% -21.0% +0.4%
↳ 5y CAGR +15.6% +25.5% +5.0% +5.5% -10.5% +2.7% +0.8% +7.9% +1.6% +13.9%
Lease liabilities (USD) — — 20M 18.7M 16.6M 14.7M 14.6M 12.7M 11.9M 11.1M
Cash and deposits (USD) 205M 159M 142M 109M 317M 190M 97.4M 76.2M 101M 151M
Intangible assets (USD) 30.4M 31.2M 34.1M 30.3M 26.2M 23.1M 32.7M 35M 35.1M 32.4M
Right-of-use assets (USD) — — — — 13.9M 12.1M 12.3M 10.6M 10M 9.3M
Cash flow detail
Operating cash flow (USD) 77.9M 85.4M 110M 90.4M -23M 6.07M 17.3M 58.6M 70.8M 127M
Purchases of property, plant and equipment (USD) -15.3M -24.1M -13.4M -7.42M -697,000 -3.59M -8.42M -6.49M -8.43M -8.17M
Purchases of intangible assets (USD) -4.79M -5.21M -8.7M -2.93M -1.9M -4.09M -4.39M -8.34M -8.45M -5.32M
Change in receivables (cash effect) (USD) -1.41M -37.8M 33.9M -8.62M 33.6M -52.5M -29M -1.91M 29.1M -1.32M
Change in inventories (cash effect) (USD) -3.83M 10.8M -14M 1.94M — — — — — —
Change in payables (cash effect) (USD) -3.36M 4.2M 7.75M -11.8M 414,000 -4.75M 8.5M -535,000 -6.38M -481,000
Share buybacks (cash effect) (USD) -117M -46.1M -6.08M -2.66M -36.6M -13.9M — — — —
Interest paid (cash effect) (USD) -721,000 -826,000 -502,000 -1.23M -5.77M -3.25M -715,000 -3.93M -5.72M -4.88M
Income taxes paid (cash effect) (USD) -24.6M -22.8M -12.7M -17.3M -4.76M -18.5M -14M -17.8M -14.6M -15.9M
Share-based compensation (USD) 30.5M 20.4M 22.6M 22.8M 21.5M 25.6M 27M 23.6M 22.8M 26.6M
Operating cash flow before change in receivables (USD) 79.3M 123M 76M 99M -56.6M 58.5M 46.3M 60.5M 41.7M 128M
Free cash flow (OCF - PPE - intangibles) (USD) 57.8M 56M 87.9M 80M -25.6M -1.62M 4.5M 43.8M 54M 114M
Income detail
Research and development expense (USD) 16.3M 20.9M 13.7M 5.2M 5.62M 6.94M 5.3M 10.1M 5.1M 5.82M
↳ 5y CAGR +15.8% +12.8% -1.5% -20.2% -15.1% -15.7% -24.0% -5.9% -0.4% +0.7%
Total comprehensive income (USD) 39.8M 18.2M 29.6M 58.7M -151M -7.03M -38.2M 29.7M 27.4M 53M
Comprehensive income to owners (USD) 31M 6.92M 19.9M 47.3M -140M -20.8M -35.2M 23.1M 21.5M 41.2M
Provision for credit losses (USD) 1.03M 1.97M 3.03M 2.43M 18.6M -3.95M 8.55M 1.76M -2.28M 1.06M
Credit cost ratio (credit losses / average receivables) (%) 1.1% 1.7% 2.7% 2.5% 23.9% 4.8% 6.9% 1.3% 1.9% 1.0%
Reported Feb 23, 2017 Feb 27, 2018 Feb 19, 2020 Feb 19, 2020 Feb 24, 2022 Feb 24, 2022 Feb 22, 2023 Feb 27, 2024 Feb 19, 2025 Feb 25, 2026

Sign up to see institutional holdings

Sign Up

Podcast Mentions

Sign up to see podcast mentions and sentiment

Sign Up

On November 16, 2026, IMAX Corporation (the “Company”) and Mark Welton, the Company’s President, IMAX Global Theatres, entered into an employment agreement, effective as of January 1, 2027 (the “Agreement”). This Agreement supersedes, replaces, and terminates Mr. Welton’s existing agreement with the Company, dated September 18, 2020, as amended on October 13, 2021 and May 20, 2025 (the “Prior Agreement”).

Pursuant to the Agreement, effective January 1, 2027, Mr. Welton will assume the role of President, Strategic Partnerships. The material terms and conditions of Mr. Welton’s employment with the Company are substantially similar to those under the Prior Agreement, as described in the Company’s definitive proxy statement for its 2026 Annual General Meeting of Shareholders, filed with the Securities and Exchange Commission on April 24, 2026, except that from January 1, 2027 through December 31, 2027, “Resignation for Good Reason” under the Agreement shall mean resignation for any reason, provided that Mr. Welton gives advance written notice to the Company of his intention to resign his employment of at least 90 days.

On November 5, 2026, IMAX Corporation (the “Company”) issued a press release announcing the Company’s financial and operating results for the quarter ended September 30, 2026, a copy of which is attached as Exhibit 99.1.

November 5, 2026

PDF Version

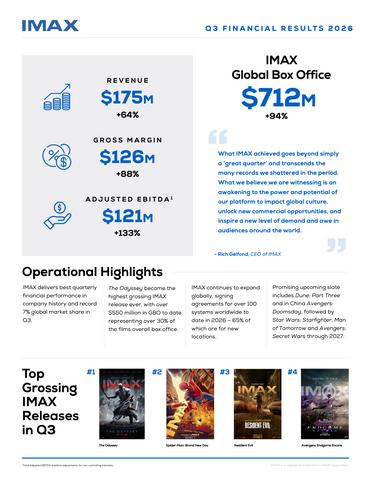
  • IMAX delivers best quarterly financial performance in company history, breaking records across key metrics including:

  • Revenue of $175 million, up 64% year-over-year and Gross Margin of $126 million, up 88% year-over-year.

  • Strong operating leverage driven profitability with Net Income(1) of $117 million at a record margin of 67% and Adjusted EBITDA(2) of $121 million at a record margin of 69%, up over 2000 basis points year-over-year.

  • Net income per diluted share of $1.96, up 430% year-over year and Adjusted EPS(1,2) of $2.21, up 370% year-over-year — both quarterly figures eclipsing any full year result in IMAX history.

  • Cash from Operating Activities of $86 million, up 28% year-over-year.

  • Company reports record quarterly global box office of $712 million — up +90% over the previous quarterly record of $372 million.

  • Christopher Nolan’s The Odyssey makes history as highest grossing IMAX release of all time, with over $550 million in worldwide box office and delivering more than 30% of the film’s global box office.

  • Signings for IMAX systems reach over 100 year-to-date — 65% new locations — as sales activity accelerates following the record-breaking performance of The Odyssey and amidst strong pre-sales for December’s Dune: Part Three.

  • Dune: Part Three and Chinese release of Avengers: Doomsday kick off promising 2027 slate currently taking shape, with strong Chinese New Year offering led by Wandering Earth 3; Filmed for IMAX releases including Star Wars: Starfighter and Superman sequel Man of Tomorrow; Avengers: Secret Wars; and the IMAX debut of the original Star Wars, presented in IMAX 70mm film for the first time ever.

NEW YORK--(BUSINESS WIRE)--Nov. 5, 2026-- IMAX Corporation (NYSE: IMAX) today reported the best quarterly financial results in company history for the third quarter of 2026, as the global entertainment platform surged to new heights with record global box office in the period.

This press release features multimedia. View the full release here: https://www.businesswire.com/news/home/20261105039008/en/

“What IMAX achieved goes beyond simply a ‘great quarter’ and transcends the many records we shattered in the period. What we believe we are witnessing is an awakening to the power and potential of our platform to impact global culture, unlock new commercial opportunities, and inspire a new level of demand and awe in audiences around the world,” said Rich Gelfond, CEO of IMAX Corporation.

“Christopher Nolan’s The Odyssey is a historic cinematic achievement crafted entirely with IMAX technology and its record-breaking success marks a new era of opportunity for our company. The record margins we generated in the quarter demonstrate the unique strength of our model, and the growing value of scarce events and experiences in an increasingly A.I.-driven world underscore a powerful opportunity for our business, as we look ahead to a remarkably strong slate over the next several years.”

“Our momentum is fueling sales activity with exhibitors around the world, with our team delivering more than 100 signings for IMAX systems worldwide year-to-date — including 65% new locations and strong growth across priority Rest of World markets.”

“With the global release of Dune: Part Three and our release of Avengers: Doomsday in China carrying into a very strong 2027 slate, we are excited for the year ahead and confident in our belief that there has never been a better time to be in the IMAX business. This ‘IMAX awakening’ sits inside a bigger culture shift of people around the world — particularly young people — seeking connection, community, and shared experiences that feel bigger than any one person’s screen. IMAX has always delivered these moments, and we believe this trend has only begun to benefit our business.”

| _________________________ |

| (1) | | For the three months ended September 30, 2026, Net income attributable to common shareholders includes $36.7 million ($0.63 per diluted share) of valuation allowance release related to certain Canadian federal and provincial deferred tax assets that are expected to be utilized in future years. |

| (2) | | Non-GAAP Financial Measure. See the discussion at the end of this earnings release for a description of the non-GAAP financial measures used herein, as well as reconciliations to the most comparable GAAP amounts. |

Third Quarter Financial Highlights

| | | Three Months Ended September 30, (Unaudited) | | Nine Months Ended September 30, (Unaudited) |

| In millions of U.S. Dollars, except per share data | | 2026 | | 2025 | | YoY % Change | | 2026 | | 2025 | | YoY % Change |

| Total Revenue | | $ | 174.6 | | | $ | 106.7 | | | 64 | % | | $ | 358.8 | | | $ | 285.0 | | | 26 | % |

| | | | | | | | | | | | | |

| Gross Margin | | $ | 126.3 | | | $ | 67.3 | | | 88 | % | | $ | 235.0 | | | $ | 174.0 | | | 35 | % |

| Gross Margin (%) | | | 72.3 | % | | | 63.1 | % | | 920bps | | | 65.5 | % | | | 61.1 | % | | 440bps |

| | | | | | | | | | | | | |

| Net Income | | $ | 117.1 | | | $ | 22.6 | | | 418 | % | | $ | 139.1 | | | $ | 43.0 | | | 223 | % |

| Net Income Margin (%) | | | 67.1 | % | | | 21.2 | % | | 4590bps | | | 38.8 | % | | | 15.1 | % | | 2370bps |

| | | | | | | | | | | | | |

| Net Income Attributable to Common Shareholders | | $ | 113.8 | | | $ | 20.7 | | | 450 | % | | $ | 133.4 | | | $ | 34.2 | | | 290 | % |

| Net Income Per Share - Diluted(1) | | $ | 1.96 | | | $ | 0.37 | | | 430 | % | | $ | 2.35 | | | $ | 0.62 | | | 279 | % |

| | | | | | | | | | | | | |

| Total Adjusted EBITDA(2)(3) | | $ | 120.9 | | | $ | 51.8 | | | 133 | % | | $ | 199.4 | | | $ | 127.8 | | | 56 | % |

| Total Adjusted EBITDA Margin (%)(2)(3) | | | 69.3 | % | | | 48.6 | % | | 2070bps | | | 55.6 | % | | | 44.9 | % | | 1070bps |

| | | | | | | | | | | | | |

| Adjusted Net Income(1)(2) | | $ | 127.9 | | | $ | 26.2 | | | 388 | % | | $ | 161.7 | | | $ | 48.0 | | | 237 | % |

| Adjusted Earnings Per Share - Diluted(1)(2) | | $ | 2.21 | | | $ | 0.47 | | | 370 | % | | $ | 2.84 | | | $ | 0.87 | | | 226 | % |

| | | | | | | | | | | | | |

| Weighted average shares outstanding (in millions): | | | | | | | | | | | | |

| Basic | | | 55.0 | | | | 53.8 | | | 2 | % | | | 54.7 | | | | 53.6 | | | 2 | % |

| Diluted(4) | | | 58.0 | | | | 55.6 | | | 4 | % | | | 56.9 | | | | 55.2 | | | 3 | % |

| _________________________ |

| (1) | | Attributable to common shareholders. |

| (2) | | Non-GAAP Financial Measure. See the discussion at the end of this earnings release for a description of the non-GAAP financial measures used herein, as well as reconciliations to the most comparable GAAP amounts. |

| (3) | | Total Adjusted EBITDA is before adjustments for non-controlling interests. Total Adjusted EBITDA per Credit Facility attributable to common shareholders, excluding non-controlling interests, was $115.2 million and $187.7 million for the three and nine months ended September 30, 2026, respectively (2025 - $48.0 million and $112.7 million, respectively). The Company’s Credit Facility covenant is calculated on a trailing twelve-month basis. |

| (4) | | For the three months ended September 30, 2026, the calculation of diluted weighted average shares outstanding includes any shares potentially issuable upon the conversion of the Convertible Notes, as the average market price of the Company’s common shares exceeded the conversion price and the effect was dilutive. The capped call transactions are excluded from the calculation of diluted earnings per share because their effect would be antidilutive. |

Third Quarter Segment Results(1)

| | | Content Solutions | | Technology Products and Services |

| | | Revenue | | Gross Margin | | Gross Margin % | | Revenue | | Gross Margin | | Gross Margin % |

| 3Q26 | | $ | 94.0 | | | $ | 71.7 | | | 76 | % | | $ | 77.3 | | | $ | 53.4 | | | 69 | % |

| 3Q25 | | | 44.8 | | | | 31.9 | | | 71 | % | | | 60.4 | | | | 34.8 | | | 58 | % |

| % change | | | 110 | % | | | 125 | % | | | | | 28 | % | | | 53 | % | | |

| | | | | | | | | | | | | |

| YTD26 | | $ | 160.0 | | | $ | 111.9 | | | 70 | % | | $ | 190.4 | | | $ | 119.3 | | | 63 | % |

| YTD25 | | | 113.0 | | | | 77.9 | | | 69 | % | | | 166.7 | | | | 94.1 | | | 56 | % |

| % change | | | 42 | % | | | 44 | % | | | | | 14 | % | | | 27 | % | | |

| _________________________ |

| (1) | | Please refer to the Company’s Quarterly Report on Form 10-Q for the period ended September 30, 2026 for additional segment information. |

Content Solutions Segment

  • Third quarter Content Solutions revenues and gross margin increased 110% to $94 million and 125% to $72 million year-over-year, respectively. IMAX’s global platform delivered a record 76% gross margin reflecting the significant incrementality within the IMAX business model as our platform scales and box office increases.

  • Third quarter global box office of $712 million marked IMAX’s highest quarterly box office in its history and increased 94% year-over-year leading IMAX to deliver 6.7% of the industry’s third quarter global box office (on less than 1% of worldwide screens). Top grossing third quarter titles included The Odyssey ($538 million) and Spider-Man: Brand New Day ($58 million).

Technology Products and Services Segment

  • Third quarter Technology Products and Services revenues and gross margin increased 28% to $77 million and 53% to $53 million year-over-year, respectively, driven by rental revenue growth tied to higher box office and amendments and renewals of existing agreements which more than offset lower systems under sales arrangements installations.

  • During the third quarter of 2026, the Company installed 32 systems compared to 38 systems in the third quarter of 2025. Of the quarter’s installs, 15 systems were under sales arrangements, compared to 17 in the prior year.

  • Commercial network growth continued with the number of IMAX locations reaching 1,820 systems as of September 30, 2026 compared to 1,759 systems as of September 30, 2025. The Company ended Q3 2026 with a backlog of 409 IMAX systems.

Operating Cash Flow and Liquidity

Net cash provided by operating activities for the nine months ended September 30, 2026 increased 25% year-over-year to $122 million, reflecting higher operating profits and the elevated conversion of profits to cash flow as margins increase.

As of September 30, 2026, the Company’s available liquidity was $641 million. The Company’s liquidity included cash and cash equivalents of $208 million, $375 million in available borrowing capacity under the Company’s revolving credit facility, and $58 million in available borrowing capacity under IMAX China’s revolving facilities. Total debt, excluding deferred financing costs, was $251 million as of September 30, 2026.

In 2025, the Company issued $250 million of 0.750% Convertible Senior Notes due 2030 (“2030 Convertible Notes”). In connection with the pricing of the 2030 Convertible Notes, the Company entered into privately negotiated capped call transactions with a cap price of $57.10 per share of the Company’s common shares.

Share Count and Capital Return

The weighted average basic and diluted shares outstanding in the third quarter of 2026 were 55.0 million and 58.0 million, respectively, compared to 53.8 million and 55.6 million in the third quarter of 2025.

During the third quarter of 2026 and 2025, the Company did not have any repurchases of common shares.

In June 2026, the Company’s Board of Directors approved an extension of its share repurchase program through June 30, 2027. As of September 30, 2026, the Company’s total share repurchase authority was $500.0 million with approximately $237.0 million available under the program.

Supplemental Materials

Prompts

Imax Corporation (ticker IMAX), listed in United States.

ETFs Holding Imax Corporation

ETF Weight in ETF Shares Market value As of
SAWS 0.81% 1,322 $ 63.244K Jul 31, 2026
MSSM 0.52% 71,998 $ 3.686M Aug 31, 2026
MMSC 0.51% 5,452 $ 254.936K Nov 16, 2026
BRNY 0.49% 58,281 $ 2.75M Nov 18, 2026
PSC 0.36% 208,562 $ 8.313M Jun 30, 2026
EHLS 0.29% 3,384 $ 158.236K Nov 17, 2026
AVSC 0.16% 107,949 $ 5.048M Nov 16, 2026
RESM 0.07% 67 $ 2,670.62 Jun 30, 2026
DFAS 0.06% 411,021 $ 19.684M Nov 12, 2026
VFMF 0.03% 5,463 $ 279.706K Aug 31, 2026
DXUV 0.02% 26,835 $ 1.285M Nov 12, 2026
VFMO 0.02% 7,710 $ 394.752K Aug 31, 2026
AVSU 0.02% 1,921 $ 89.826K Nov 16, 2026
AVUQ 0.02% 1,882 $ 88.002K Nov 16, 2026
DFAC 0.01% 216,740 $ 10.38M Nov 12, 2026
AVUS 0.01% 39,867 $ 1.864M Nov 16, 2026
DFSU 0.01% 4,415 $ 211.434K Nov 12, 2026
DCOR 0.01% 64,263 $ 3.078M Nov 12, 2026
DFAU 0.00% 12,869 $ 616.296K Nov 12, 2026
DFUS 0.00% 15,233 $ 729.508K Nov 12, 2026
DFUV 0.00% 10,498 $ 502.749K Nov 12, 2026
EBI 0.00% 305 $ 15.616K Aug 31, 2026