Record fourth quarter Gross Profit +18%; Income from Operations +52%; Adjusted EBITDA_*_ +22% FY 2026 Income from Operations of $121M (+21%); Adjusted EBITDA of $155M (+17%) NEWARK, N.J., Sept. 28, 2026 (GLOBE NEWSWIRE) — IDT Corporation (NYSE: IDT),…
Record fourth quarter Gross Profit +18%; Income from Operations +52%; Adjusted EBITDA_*_ +22%
FY 2026 Income from Operations of $121M (+21%); Adjusted EBITDA of $155M (+17%)
NEWARK, N.J., Sept. 28, 2026 (GLOBE NEWSWIRE) — IDT Corporation (NYSE: IDT), a global provider of fintech, communications, and AI-powered customer experience solutions, today reported results for its fourth quarter and full fiscal year 2026, the three and twelve months ended July 31, 2026.
4Q26 HIGHLIGHTS **
- Consolidated Results
- Revenue: +7% to $339.0 million;
- Gross profit / margin: +18% to $134.8 million / +360 bps to 39.8%;
- Income from operations: +52% to $33.2 million;
- Net income attributable to IDT: +29% to $21.7 million;
- GAAP EPS: Increased to $0.87 from $0.67;
- Non-GAAP EPS: Increased to $0.94 from $0.76;
- Adjusted EBITDA: +22% to $41.2 million.
- Key Businesses / Segments
- NRS
- Revenue: +31% to $45.0 million;
- Income from operations: +105% to $12.0 million;
- Adjusted EBITDA: +47% to $14.0 million.
- BOSS Money / Fintech segment
- BOSS Money digital revenue: +22% to $33.7 million;
- Fintech segment revenue: +12% to $47.1 million;
- Fintech segment income from operations: +15% to $5.5 million;
- Fintech segment Adjusted EBITDA: +17% to $6.5 million.
- net2phone
- Subscription revenue: +10% to $24.5 million;
- Income from operations: +75% to $2.6 million;
- Adjusted EBITDA: +26% to $4.4 million.
- Traditional Communications
- Revenue: +2% to $222.0 million;
- Gross profit: +0.4% to $41.1 million;
- Income from operations: +8% to $16.6 million;
- Adjusted EBITDA: +12% to $19.9 million.
FY 2026 HIGHLIGHTS
- Consolidated Results
- Revenue: +5% to $1,298.0 million;
- Gross profit / margin: +11% to $496.8 million / +200 bps to 38.3%;
- Income from operations: +21% to $121.2 million;
- Net income attributable to IDT: +14% to $86.6 million;
- GAAP EPS: Increased to $3.46 from $3.01;
- Non-GAAP EPS: Increased to $3.82 from $3.19;
- Adjusted EBITDA: +17% to $154.6 million.
- Key Businesses / Segments
- NRS
- Revenue: +24% to $159.4 million;
- Income from operations: +42% to $39.3 million;
- Adjusted EBITDA: +30% to $45.8 million.
- BOSS Money / Fintech segment
- BOSS Money digital revenue: +21% to $119.4 million;
- Fintech segment revenue: +14% to $176.0 million;
- Fintech segment income from operations: +40% to $21.5 million;
- Fintech segment Adjusted EBITDA: +41% to $26.2 million.
- net2phone
- Subscription revenue: +11% to $94.9 million;
- Income from operations: +84% to $9.1 million;
- Adjusted EBITDA: +33% to $16.1 million.
- Traditional Communications
- Revenue: +1% to $865.9 million;
- Gross profit: (4)% to $162.6 million;
- Income from operations: (5)% to $63.4 million;
- Adjusted EBITDA: +1% to $77.3 million.
_*_This release discloses certain Non-GAAP financial measures (Adjusted EBITDA, Non-GAAP EPS, NRS’ ‘Rule of 40,’ and adjusted net cash provided by operating activities) as well as certain Key Performance Metrics (net2phone subscription revenue, net2phone constant currency subscription revenue growth rate, NRS Average Monthly Network Gross Profit per Location, and BOSS Money transactions and digital channel send volume). Please see the explanations of those measures and metrics, the reasons for their inclusion and reconciliations of Non-GAAP measures to their closest GAAP measures at the end of this release.
_**Throughout this release, unless otherwise noted, results for the fourth quarter of fiscal year 2026 (4Q26) are compared to the fourth quarter of fiscal year 2025 (4Q25) and results for FY 2026 are compared to FY 2025. All earnings per share (EPS) and other ‘per share’ results are per diluted share.
_
REMARKS BY SHMUEL JONAS, CEO
IDT’s fourth quarter capped off a strong fiscal year, highlighted by accelerated topline and Adjusted EBITDA growth.
Our three higher-margin growth segments, NRS, Fintech and net2phone, each increased their respective quarterly and full-year contributions, while our Traditional Communications segment generated more Adjusted EBITDA in fiscal 2026 than it did in fiscal 2025 or 2024.
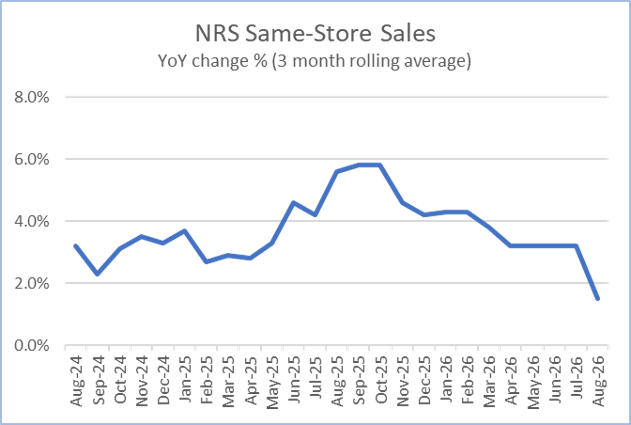
At NRS, we continue to develop and deploy new, high-value functionalities for our retailers, such as our recent Uber Eats integration following the Grubhub and DoorDash partnerships we announced last year. These advances are supplementing other tailwinds driving gains in Merchant Services revenues. Also in the fourth quarter, Advertising and Data revenue returned to growth, bolstered by our recent acquisition. Taken together, these developments helped drive a 47% year-over-year increase in NRS’ fourth quarter Adjusted EBITDA. Looking ahead, we are working on several product initiatives to increase sales to our existing retailer base and to attract new retailers to the NRS network.
Our BOSS Money remittance business shares its brand identity, distribution networks and addressable markets with our other BOSS-branded offerings. In recent years, we invested heavily to build and improve our BOSS apps. That strategy is paying off as BOSS Money continues to grow rapidly – thanks in part to the quality of our apps and our customer-centric service.
At BOSS Money, remittances surpassed a 30 million annual transaction run-rate for the first time in May, thanks to strong Mother’s Day results in our digital channel. This channel contributed 88% of our total transaction volume in the fourth quarter with transactions and revenue both increasing by 20+%.
We recently launched money transfers via our WhatsApp channel, and we closed the fiscal year by deploying a digital wallet here in the U.S. The wallet enables our customers to load funds, store promotions, and pay for services. In addition, the BOSS Money app is extending its geographic reach, launching internationally with differentiated features by country including peer-to-peer remittances, a stablecoin-backed wallet with a reloadable debit card and other money management tools. We are also launching a BOSS Money branded rechargeable card with credit building features. All of these developments mark early steps toward a broader suite of BOSS Money-branded financial services and tools that we intend to offer globally.
net2phone delivered another solid quarter as we enhanced our cloud communications portfolio with both native and standalone AI solutions for businesses across the globe. Our agentic AI solutions, AI Agent and Coach, combined with our new integration layer, enable customers to connect their everyday business applications and workflow tools with net2phone’s suite of services. net2phone’s AI tools and applications are driving nearly every conversation with our clients. That process is delivering new logos and accelerating accretive sales. net2phone is on track to surpass the $100 million ARR milestone in the current quarter and we expect continued topline expansion throughout fiscal 2027.
Overall, IDT is well positioned as we begin the new fiscal year with accelerating topline growth, increasing cash generation, and a debt-free balance sheet that affords us strategic flexibility.
4Q26 AND FY 2026 RESULTS BY SEGMENT
National Retail Solutions (NRS)
(Terminals, accounts and retailer locations at end of period. $ in millions, except for Average Monthly GP per Location.__* Numbers may not foot due to rounding.)
|
|
|
|
|
|
|
|
|
|
|
|
|
|
|
|
|
|
|
|
|
|
|
|
|
|
|
|
|
|
|
|
|
|
|
|
|
|
|
|
|
|
|
4Q26-4Q25 |
|
|
|
|
|
|
|
|
|
|
|
FY26-FY25 |
|
|
|
|
4Q26 |
|
|
|
3Q26 |
|
|
|
4Q25 |
|
|
|
(Δ, % Δ) |
|
|
|
FY26 |
|
|
|
FY25 |
|
|
|
(% Δ) |
|
|
|
|
|
|
|
|
|
|
|
|
|
|
|
|
|
|
|
|
|
|
|
|
|
|
|
|
|
|
|
| Retailer locations |
|
|
35,400 |
|
|
|
34,800 |
|
|
|
32,700 |
|
|
|
2,700 |
|
|
|
|
|
|
|
|
|
|
|
|
|
| Active POS terminals |
|
|
40,400 |
|
|
|
39,300 |
|
|
|
37,200 |
|
|
|
3,200 |
|
|
|
|
|
|
|
|
|
|
|
|
|
| Payment processing accounts |
|
|
29,400 |
|
|
|
29,200 |
|
|
|
26,500 |
|
|
|
2,900 |
|
|
|
|
|
|
|
|
|
|
|
|
|
|
|
|
|
|
|
|
|
|
|
|
|
|
|
|
|
|
|
|
|
|
|
|
|
|
|
|
|
|
| Revenue |
|
|
|
|
|
|
|
|
|
|
|
|
|
|
|
|
|
|
|
|
|
|
|
|
|
|
|
|
| Merchant Services & Other |
|
$ |
28.5 |
|
|
$ |
25.8 |
|
|
$ |
21.8 |
|
|
|
+31 |
% |
|
$ |
102.0 |
|
|
$ |
76.8 |
|
|
|
+33 |
% |
| Advertising and Data |
|
$ |
10.1 |
|
|
$ |
5.7 |
|
|
$ |
6.8 |
|
|
|
+49 |
% |
|
$ |
32.1 |
|
|
$ |
31.1 |
|
|
|
+3 |
% |
| SaaS Fees |
|
$ |
4.6 |
|
|
$ |
4.5 |
|
|
$ |
4.1 |
|
|
|
+12 |
% |
|
$ |
17.8 |
|
|
$ |
14.7 |
|
|
|
+21 |
% |
| POS Terminal Sales |
|
$ |
1.8 |
|
|
$ |
2.0 |
|
|
$ |
1.7 |
|
|
|
+10 |
% |
|
$ |
7.5 |
|
|
$ |
6.2 |
|
|
|
+22 |
% |
| Total revenue |
|
$ |
45.0 |
|
|
$ |
38.0 |
|
|
$ |
34.3 |
|
|
|
+31 |
% |
|
$ |
159.4 |
|
|
$ |
128.8 |
|
|
|
+24 |
% |
|
|
|
|
|
|
|
|
|
|
|
|
|
|
|
|
|
|
|
|
|
|
|
|
|
|
|
|
|
| Gross profit |
|
$ |
42.6 |
|
|
$ |
34.3 |
|
|
$ |
30.5 |
|
|
|
+40 |
% |
|
$ |
146.6 |
|
|
$ |
116.9 |
|
|
|
+25 |
% |
| Gross profit margin |
|
|
94.8 |
% |
|
|
90.2 |
% |
|
|
89.0 |
% |
|
|
+580 |
bps |
|
|
92.0 |
% |
|
|
90.7 |
% |
|
|
+130 |
bps |
|
|
|
|
|
|
|
|
|
|
|
|
|
|
|
|
|
|
|
|
|
|
|
|
|
|
|
|
|
| Average monthly GP per location* |
|
$ |
383 |
|
|
$ |
331 |
|
|
$ |
315 |
|
|
|
+22 |
% |
|
$ |
352 |
|
|
$ |
316 |
|
|
|
+12 |
% |
|
|
|
|
|
|
|
|
|
|
|
|
|
|
|
|
|
|
|
|
|
|
|
|
|
|
|
|
|
| SG&A |
|
$ |
27.3 |
|
|
$ |
23.4 |
|
|
$ |
20.0 |
|
|
|
+37 |
% |
|
$ |
96.1 |
|
|
$ |
78.0 |
|
|
|
+23 |
% |
| Technology and development |
|
$ |
2.8 |
|
|
$ |
2.7 |
|
|
$ |
2.3 |
|
|
|
+25 |
% |
|
$ |
10.8 |
|
|
$ |
8.7 |
|
|
|
+24 |
% |
| Income from operations |
|
$ |
12.0 |
|
|
$ |
8.2 |
|
|
$ |
5.8 |
|
|
|
+105 |
% |
|
$ |
39.3 |
|
|
$ |
27.8 |
|
|
|
+42 |
% |
| Adjusted EBITDA |
|
$ |
14.0 |
|
|
$ |
9.8 |
|
|
$ |
9.5 |
|
|
|
+47 |
% |
|
$ |
45.8 |
|
|
$ |
35.4 |
|
|
|
+30 |
% |
| CapEx |
|
$ |
1.7 |
|
|
$ |
0.8 |
|
|
$ |
1.3 |
|
|
|
+28 |
% |
|
$ |
5.8 |
|
|
$ |
5.4 |
|
|
|
+8 |
% |
NRS Take-Aways:
- Beginning in 4Q26, IDT is reporting retailer locations and average monthly retailer network gross profit per location (“average monthly GP per location”) as its measures of the scope of the NRS retailer network and the contribution of the average retailer on the NRS network, respectively. Retailer locations include stores that actively utilize NRS terminals, NRS payment processing, or both. Average monthly GP per location is gross profit generated within the NRS retailer network divided by average retailer locations. Average monthly GP per location increased 22% to $383 in 4Q26 from $315 in 4Q25, primarily reflecting growth in NRS Pay.
- The strong NRS revenue increase in 4Q26 was led mainly by Merchant Services and Advertising and Data, and helped drive NRS’ 4Q26 ‘Rule of 40’ score to 60.
- NRS recently launched a partnership with Uber Eats following successful integrations with DoorDash and Grubhub. Collectively, these and other, smaller, online ordering and delivery partnerships enable NRS retailers to better meet and serve their customers wherever they are while leveraging the scale of the NRS network to further differentiate NRS’ offerings.
BOSS Money and Fintech Segment
(Transactions in millions. $ in millions except for average revenue per transaction. Numbers may not foot due to rounding.)
|
|
|
|
|
|
|
|
|
|
|
|
|
|
|
|
|
|
|
|
|
|
|
|
|
|
|
|
|
|
|
|
|
|
|
|
|
|
|
|
|
|
|
4Q26-4Q25 |
|
|
|
|
|
|
|
|
|
|
|
FY26-FY25 |
|
|
|
|
4Q26 |
|
|
|
3Q26 |
|
|
|
4Q25 |
|
|
|
(% Δ) |
|
|
|
FY26 |
|
|
|
FY25 |
|
|
|
(% Δ) |
|
|
| BOSS Money Transactions |
|
|
|
|
|
|
|
|
|
|
|
|
|
|
|
|
|
|
|
|
|
|
|
|
|
|
|
|
| Digital channel |
|
|
6.6 |
|
|
|
6.0 |
|
|
|
5.5 |
|
|
|
+20 |
% |
|
|
23.6 |
|
|
|
19.6 |
|
|
|
+20 |
% |
| Retail channel |
|
|
0.9 |
|
|
|
0.9 |
|
|
|
1.1 |
|
|
|
(20 |
)% |
|
|
3.8 |
|
|
|
4.2 |
|
|
|
(9 |
)% |
| Total transactions |
|
|
7.5 |
|
|
|
6.9 |
|
|
|
6.6 |
|
|
|
+14 |
% |
|
|
27.4 |
|
|
|
23.9 |
|
|
|
+15 |
% |
| Digital as a percentage of total |
|
|
88.1 |
% |
|
|
87.0 |
% |
|
|
83.3 |
% |
|
|
+480 |
bps |
|
|
86.0 |
% |
|
|
82.0 |
% |
|
|
+400 |
bps |
|
|
|
|
|
|
|
|
|
|
|
|
|
|
|
|
|
|
|
|
|
|
|
|
|
|
|
|
|
| Fintech Revenue |
|
|
|
|
|
|
|
|
|
|
|
|
|
|
|
|
|
|
|
|
|
|
|
|
|
|
|
|
| BOSS Money |
|
|
|
|
|
|
|
|
|
|
|
|
|
|
|
|
|
|
|
|
|
|
|
|
|
|
|
|
| Digital channel |
|
$ |
33.7 |
|
|
$ |
31.0 |
|
|
$ |
27.6 |
|
|
|
+22 |
% |
|
$ |
119.4 |
|
|
$ |
99.0 |
|
|
|
+21 |
% |
| Retail channel |
|
$ |
8.7 |
|
|
$ |
8.6 |
|
|
$ |
10.6 |
|
|
|
(17 |
)% |
|
$ |
37.3 |
|
|
$ |
40.9 |
|
|
|
(9 |
)% |
| Total BOSS Money |
|
$ |
42.4 |
|
|
$ |
39.7 |
|
|
$ |
38.2 |
|
|
|
+11 |
% |
|
$ |
156.7 |
|
|
$ |
139.8 |
|
|
|
+12 |
% |
| Other |
|
$ |
4.6 |
|
|
$ |
5.3 |
|
|
$ |
3.9 |
|
|
|
+20 |
% |
|
$ |
19.3 |
|
|
$ |
14.8 |
|
|
|
+31 |
% |
| Total Revenue |
|
$ |
47.1 |
|
|
$ |
45.0 |
|
|
$ |
42.1 |
|
|
|
+12 |
% |
|
$ |
176.0 |
|
|
$ |
154.6 |
|
|
|
+14 |
% |
|
|
|
|
|
|
|
|
|
|
|
|
|
|
|
|
|
|
|
|
|
|
|
|
|
|
|
|
|
| Average BOSS Money revenue per transaction* |
|
$ |
5.68 |
|
|
$ |
5.76 |
|
|
$ |
5.81 |
|
|
|
(2 |
)% |
|
$ |
5.72 |
|
|
$ |
5.85 |
|
|
|
(2 |
)% |
|
|
|
|
|
|
|
|
|
|
|
|
|
|
|
|
|
|
|
|
|
|
|
|
|
|
|
|
|
| Gross profit |
|
$ |
30.9 |
|
|
$ |
28.3 |
|
|
$ |
24.9 |
|
|
|
+24 |
% |
|
$ |
109.7 |
|
|
$ |
90.7 |
|
|
|
+21 |
% |
| Gross profit margin |
|
|
65.6 |
% |
|
|
62.8 |
% |
|
|
59.1 |
% |
|
|
+650 |
bps |
|
|
62.3 |
% |
|
|
58.7 |
% |
|
|
+360 |
bps |
| SG&A |
|
$ |
22.9 |
|
|
$ |
20.2 |
|
|
$ |
17.8 |
|
|
|
+28 |
% |
|
$ |
77.9 |
|
|
$ |
66.2 |
|
|
|
+18 |
% |
| Technology and development |
|
$ |
2.5 |
|
|
$ |
2.5 |
|
|
$ |
2.3 |
|
|
|
+10 |
% |
|
$ |
10.2 |
|
|
$ |
9.1 |
|
|
|
+12 |
% |
| Income from operations |
|
$ |
5.5 |
|
|
$ |
5.6 |
|
|
$ |
4.8 |
|
|
|
+15 |
% |
|
$ |
21.5 |
|
|
$ |
15.4 |
|
|
|
+40 |
% |
| Adjusted EBITDA |
|
$ |
6.5 |
|
|
$ |
6.6 |
|
|
$ |
5.5 |
|
|
|
+17 |
% |
|
$ |
26.2 |
|
|
$ |
18.6 |
|
|
|
+41 |
% |
| CapEx |
|
$ |
1.0 |
|
|
$ |
1.0 |
|
|
$ |
0.8 |
|
|
|
+31 |
% |
|
$ |
3.9 |
|
|
$ |
3.5 |
|
|
|
+11 |
% |
BOSS Money and Fintech Take-Aways:
- Digital transaction volume as a percentage of total transactions increased to 88.1% in 4Q26, reflecting BOSS Money’s focused investments in digital customer acquisition programs and the industry-wide acceleration of the ongoing migration of consumers to digital channels from retail in the wake of a federal tax on remittances imposed on retail transactions beginning on January 1, 2026.
- Digital channel send volume – the amount of principal transferred by BOSS Money customers using the BOSS Money and BOSS Revolution apps – increased by 38% year-over-year in 4Q26 and by 35% in FY 2026, reflecting increases in both transaction volumes and in average dollars sent per transaction.
- The Fintech segment’s year-over-year increases in gross profit margin, 650 bps in 4Q26 and 360 bps in FY 2026, primarily reflected the continuing rotation in the transaction mix to higher margin digital transactions from lower margin retail transactions, supplemented by the impact of increased average send amounts and continuous efforts to negotiate more favorable payout terms.
- The BOSS Money app attained the highest average customer satisfaction score of any of the leading digital money transfer providers serving the U.S. and U.K. markets as evaluated by FXC Intelligence for 2026. It was the second consecutive year that the BOSS Money app has won the honor.
net2phone
(Seats in thousands at end of period. $ in millions. Numbers may not foot due to rounding.)
|
|
|
|
|
|
|
|
|
|
|
|
|
|
|
|
|
|
|
|
|
|
|
|
|
|
|
|
|
|
|
|
|
|
|
|
|
|
|
|
|
|
|
4Q26-4Q25 |
|
|
|
|
|
|
|
|
|
|
|
FY26-FY25 |
|
|
|
|
4Q26 |
|
|
|
3Q26 |
|
|
|
4Q25 |
|
|
|
(% Δ) |
|
|
|
FY26 |
|
|
|
FY25 |
|
|
|
(% Δ) |
|
|
| Seats |
|
|
447 |
|
|
|
441 |
|
|
|
422 |
|
|
|
+6 |
% |
|
|
|
|
|
|
|
|
|
|
|
|
|
|
|
|
|
|
|
|
|
|
|
|
|
|
|
|
|
|
|
|
|
|
|
|
|
|
|
|
|
| Revenue |
|
|
|
|
|
|
|
|
|
|
|
|
|
|
|
|
|
|
|
|
|
|
|
|
|
|
|
|
| Subscription revenue* |
|
$ |
24.5 |
|
|
$ |
24.0 |
|
|
$ |
22.2 |
|
|
|
+10 |
% |
|
$ |
94.9 |
|
|
$ |
85.7 |
|
|
|
+11 |
% |
| Other revenue |
|
$ |
0.5 |
|
|
$ |
0.4 |
|
|
$ |
0.5 |
|
|
|
(8 |
)% |
|
$ |
1.7 |
|
|
$ |
2.1 |
|
|
|
(19 |
)% |
| Total Revenue |
|
$ |
24.9 |
|
|
$ |
24.4 |
|
|
$ |
22.8 |
|
|
|
+9 |
% |
|
$ |
96.6 |
|
|
$ |
87.9 |
|
|
|
+10 |
% |
|
|
|
|
|
|
|
|
|
|
|
|
|
|
|
|
|
|
|
|
|
|
|
|
|
|
|
|
|
| Gross profit |
|
$ |
20.2 |
|
|
$ |
19.6 |
|
|
$ |
18.1 |
|
|
|
+11 |
% |
|
$ |
77.8 |
|
|
$ |
69.7 |
|
|
|
+12 |
% |
| Gross profit margin |
|
|
81.0 |
% |
|
|
80.6 |
% |
|
|
79.5 |
% |
|
|
+140 |
bps |
|
|
80.6 |
% |
|
|
79.3 |
% |
|
|
+120 |
bps |
| SG&A |
|
$ |
14.4 |
|
|
$ |
14.1 |
|
|
$ |
13.3 |
|
|
|
+9 |
% |
|
$ |
56.3 |
|
|
$ |
52.4 |
|
|
|
+8 |
% |
| Technology and development |
|
$ |
3.1 |
|
|
$ |
3.1 |
|
|
$ |
3.0 |
|
|
|
+3 |
% |
|
$ |
12.3 |
|
|
$ |
11.7 |
|
|
|
+5 |
% |
| Income from operations |
|
$ |
2.6 |
|
|
$ |
2.4 |
|
|
$ |
1.5 |
|
|
|
+75 |
% |
|
$ |
9.1 |
|
|
$ |
4.9 |
|
|
|
+84 |
% |
| Adjusted EBITDA |
|
$ |
4.4 |
|
|
$ |
4.1 |
|
|
$ |
3.5 |
|
|
|
+26 |
% |
|
$ |
16.1 |
|
|
$ |
12.1 |
|
|
|
+33 |
% |
| CapEx |
|
$ |
1.6 |
|
|
$ |
1.8 |
|
|
$ |
1.7 |
|
|
|
(7 |
)% |
|
$ |
6.9 |
|
|
$ |
6.6 |
|
|
|
+4 |
% |
net2phone Take-Aways:
- The increases in subscription revenue*, +10% in 4Q26 and +11% in FY 2026, were +7% and +8%, respectively, on a constant currency* basis, reflecting weakness in the U.S. dollar versus local currencies in certain of net2phone’s key markets.
- The strong increases in net2phone profitability in both 4Q26 and FY 2026 reflect the leverage of net2phone’s business model and the incremental contributions of its AI-powered offerings.
- net2phone introduced an integration layer in 4Q26, enabling net2phone’s solutions to work seamlessly with the customer’s native, mission-critical business software without the need for developers, custom coding, or webhooks. Because they securely read from, and write to, connected CRM and communications platforms, net2phone’s solutions can be synced through the integration layer with customer records and accounts, while actions are reflected in real time in the relevant systems of record and are reviewable through an audit trail.
Traditional Communications
($ in millions. Numbers may not foot due to rounding.)
|
|
|
|
|
|
|
|
|
|
|
|
|
|
|
|
|
|
|
|
|
|
|
|
|
|
|
|
|
|
|
|
|
|
|
|
|
|
|
|
|
|
|
4Q26-4Q25 |
|
|
|
|
|
|
|
|
|
|
|
FY26-FY25 |
|
|
|
|
4Q26 |
|
|
|
3Q26 |
|
|
|
4Q25 |
|
|
|
(% Δ) |
|
|
|
FY26 |
|
|
|
FY25 |
|
|
|
(% Δ) |
|
|
| Revenue |
|
|
|
|
|
|
|
|
|
|
|
|
|
|
|
|
|
|
|
|
|
|
|
|
|
|
|
|
| IDT Digital Payments |
|
$ |
113.9 |
|
|
$ |
103.9 |
|
|
$ |
107.0 |
|
|
|
+6 |
% |
|
$ |
429.2 |
|
|
$ |
416.3 |
|
|
|
+3 |
% |
| IDT Global |
|
$ |
56.1 |
|
|
$ |
55.6 |
|
|
$ |
55.9 |
|
|
|
+0.4 |
% |
|
$ |
231.5 |
|
|
$ |
209.6 |
|
|
|
+10 |
% |
| BOSS Revolution |
|
$ |
44.2 |
|
|
$ |
43.4 |
|
|
$ |
49.3 |
|
|
|
(10 |
)% |
|
$ |
180.3 |
|
|
$ |
211.2 |
|
|
|
(15 |
)% |
| Other |
|
$ |
7.8 |
|
|
$ |
5.5 |
|
|
$ |
5.3 |
|
|
|
+49 |
% |
|
$ |
24.9 |
|
|
$ |
23.1 |
|
|
|
+8 |
% |
| Total Revenue |
|
$ |
222.0 |
|
|
$ |
208.3 |
|
|
$ |
217.4 |
|
|
|
+2 |
% |
|
$ |
865.9 |
|
|
$ |
860.2 |
|
|
|
+1 |
% |
|
|
|
|
|
|
|
|
|
|
|
|
|
|
|
|
|
|
|
|
|
|
|
|
|
|
|
|
|
| Gross profit |
|
$ |
41.1 |
|
|
$ |
40.3 |
|
|
$ |
41.0 |
|
|
|
+0.4 |
% |
|
$ |
162.6 |
|
|
$ |
168.9 |
|
|
|
(4 |
)% |
| Gross profit margin |
|
|
18.5 |
% |
|
|
19.4 |
% |
|
|
18.8 |
% |
|
|
(30 |
)bps |
|
|
18.8 |
% |
|
|
19.6 |
% |
|
|
(80 |
)bps |
| SG&A |
|
$ |
18.3 |
|
|
$ |
17.9 |
|
|
$ |
19.9 |
|
|
|
(8 |
)% |
|
$ |
75.6 |
|
|
$ |
79.9 |
|
|
|
(5 |
)% |
| Technology and development |
|
$ |
5.6 |
|
|
$ |
5.6 |
|
|
$ |
5.3 |
|
|
|
+6 |
% |
|
$ |
22.5 |
|
|
$ |
21.5 |
|
|
|
+5 |
% |
| Income from operations |
|
$ |
16.6 |
|
|
$ |
16.7 |
|
|
$ |
15.4 |
|
|
|
+8 |
% |
|
$ |
63.4 |
|
|
$ |
66.5 |
|
|
|
(5 |
)% |
| Adjusted EBITDA |
|
$ |
19.9 |
|
|
$ |
19.7 |
|
|
$ |
17.8 |
|
|
|
+12 |
% |
|
$ |
77.3 |
|
|
$ |
76.4 |
|
|
|
+1 |
% |
| CapEx |
|
$ |
1.7 |
|
|
$ |
1.5 |
|
|
$ |
1.4 |
|
|
|
+22 |
% |
|
$ |
6.3 |
|
|
$ |
5.3 |
|
|
|
+21 |
% |
Traditional Communications Take-Aways:
- In FY 2026, the Traditional Communications segment increased Adjusted EBITDA levels for the second consecutive year, underscoring the durability of the segment’s cash generation.
- IDT Digital Payments has launched an eSIM digital catalog through its Zendit B2B prepaid platform and in the BOSS Revolution app, further expanding its large and diversified catalog of prepaid offerings. The eSIM catalog targets the large and rapidly growing travel data roaming market, offering over 5,000 plans in 190+ countries.
OTHER FINANCIAL RESULTS
Consolidated results for all periods presented include corporate overhead. Corporate Adjusted EBITDA declined to ($3.5) million in 4Q26 from ($2.5) million in 4Q25. In FY 2026, corporate Adjusted EBITDA declined to ($10.8) million from ($10.7) million in FY 2025.
As of July 31, 2026, IDT held $271.9 million in unrestricted cash, cash equivalents, debt securities, and current equity investments, an increase of $20.5 million from the level at April 30, 2026. Also at July 31, 2026, current assets totaled $655.4 million and current liabilities totaled $351.9 million. The Company had no outstanding debt at the quarter end.
Net cash provided by operating activities in 4Q26 increased to $44.4 million from $31.0 million in 4Q25. Exclusive of changes in customer funds deposits at IDT’s Fintech segment, adjusted net cash provided by operating activities* in 4Q26 decreased to $26.4 million from $37.1 million in 4Q25.
In FY 2026, net cash provided by operating activities decreased to $91.1 million from $127.1 million in FY 2025. Exclusive of changes in customer funds deposits in IDT’s Fintech segment, adjusted net cash provided by operating activities in FY 2026 decreased to $60.9 million from $107.8 million in FY 2025. The decrease primarily stemmed from the timing of working capital movements associated with the daily changes in settlement assets and disbursement prefunding at BOSS Money.
Capital expenditures increased to $6.0 million in 4Q26 from $5.3 million in 4Q25. For FY 2026, capital expenditures increased to $23.1 million from $20.8 million in FY 2025.
IDT repurchased 30,752 shares of its Class B common stock through open market transactions during 4Q26 for approximately $2.0 million. Open market repurchases during FY 2026 totaled 421,938 shares for approximately $21.0 million.
FY 2027 FINANCIAL OUTLOOK
For FY 2027, IDT expects to again grow consolidated gross profit by double digits, consistent with its average annual growth rate over the past several years, to a range of $545 million to $555 million.
Building on record Adjusted EBITDA of $154.6 million in FY 2026, IDT’s fiscal 2027 guidance reflects continued, strong profitability growth, with Adjusted EBITDA expected to range from $176 million to $180 million, with each operating segment contributing to that growth.
DIVIDEND
IDT’s Board of Directors has declared a quarterly cash dividend of $0.07 per share payable on October 14, 2026, to stockholders of record as of October 5, 2026.
IDT EARNINGS ANNOUNCEMENT INFORMATION
This release is available for download in the “Investors & Media” section of the IDT Corporation website (https://www.idt.net/investors-and-media
) and has been furnished on a current report (Form 8-K) with the SEC.
IDT will host an earnings conference call beginning at 5:30 PM Eastern today with management’s discussion of results followed by Q&A with investors. To listen to the call and participate in the Q&A, dial 1-888-506-0062 (toll-free from the U.S.) or 1-973-528-0011 (international) and provide the following access code: 266780.
A replay of the conference call will be available approximately three hours after the call concludes through October 12, 2026. To access the call replay, dial 1-877-481-4010 (toll-free from the U.S.) or 1-919-882-2331 (international) and provide this replay passcode: 54497. The replay will also be accessible via streaming audio at the IDT investor relations website.
ABOUT IDT CORPORATION
IDT Corporation (NYSE: IDT) is a global provider of fintech, communications and AI-powered customer experience solutions through a portfolio of synergistic businesses: National Retail Solutions (NRS), through its point-of-sale (POS) platform, enables independent retailers to operate more effectively while providing advertisers and marketers with unprecedented reach into underserved consumer markets; BOSS Money facilitates innovative international remittances and fintech payments solutions; net2phone provides enterprises and organizations with intelligently integrated cloud communications and contact center services across channels and devices; IDT Digital Payments and the BOSS Revolution calling service make sharing prepaid products and services and speaking with friends and family around the world convenient and reliable, and IDT Global and IDT Express enable communications service providers to provision and manage international voice and SMS messaging.
All statements above that are not purely about historical facts, including, but not limited to, those in which we use the words “believe,” “anticipate,” “expect,” “plan,” “intend,” “estimate,” “target“ and similar expressions, are forward-looking statements within the meaning of the Private Securities Litigation Reform Act of 1995. While these forward-looking statements represent our current judgment of what may happen in the future, actual results may differ materially from the results expressed or implied by these statements due to numerous important factors. Our filings with the SEC provide detailed information on such statements and risks and should be consulted along with this release. To the extent permitted under applicable law, IDT assumes no obligation to update any forward-looking statements.