Read More](https://www.icl-group.com/blog/agriculture-in-2026-moving-from-ai-hype-to-roi-resilience/) Our Business Agriculture Controlled Release Fertilizers FertilizerpluS Fertigation Fertilizers Foliar Fertilizers Granulated PK/NPK Essential…
Read More](https://www.icl-group.com/blog/agriculture-in-2026-moving-from-ai-hype-to-roi-resilience/)
Home
Blog
Agriculture in 2026: Moving From AI Hype to ROI & Resilience
Innovation, Sustainability Global
February 12, 2026 | 7 min read
Agriculture in 2026: Moving From AI Hype to ROI & Resilience
Share:

If 2025 was the year of exploration—where the industry marveled at the potential of AI in agriculture and set ambitious carbon goals—2026 is shaping up to be the year of execution and resilience.
Last year, our focus was on the promise of digital farming. We discussed how sustainable farming technology
“could” transform the industry. However, as we enter 2026, the conversation has shifted dramatically. Farmers and agronomists are no longer asking “What can this technology do?”; they are asking “How does this pay off today?” and “Will this crop survive the summer?”
We sat down with Dvir Taler, ICL’s Chief Agronomist in Israel, to map out the critical breakpoints facing the industry. The consensus is clear: the trends for 2026 are driven by two urgent necessities: Standardization (making data work) and Survivability (helping crops withstand extreme climate).
Here are the four definitive trends shaping global agriculture in 2026.
1. The AgData Revolution: From “Big Data” to “Decision Support”
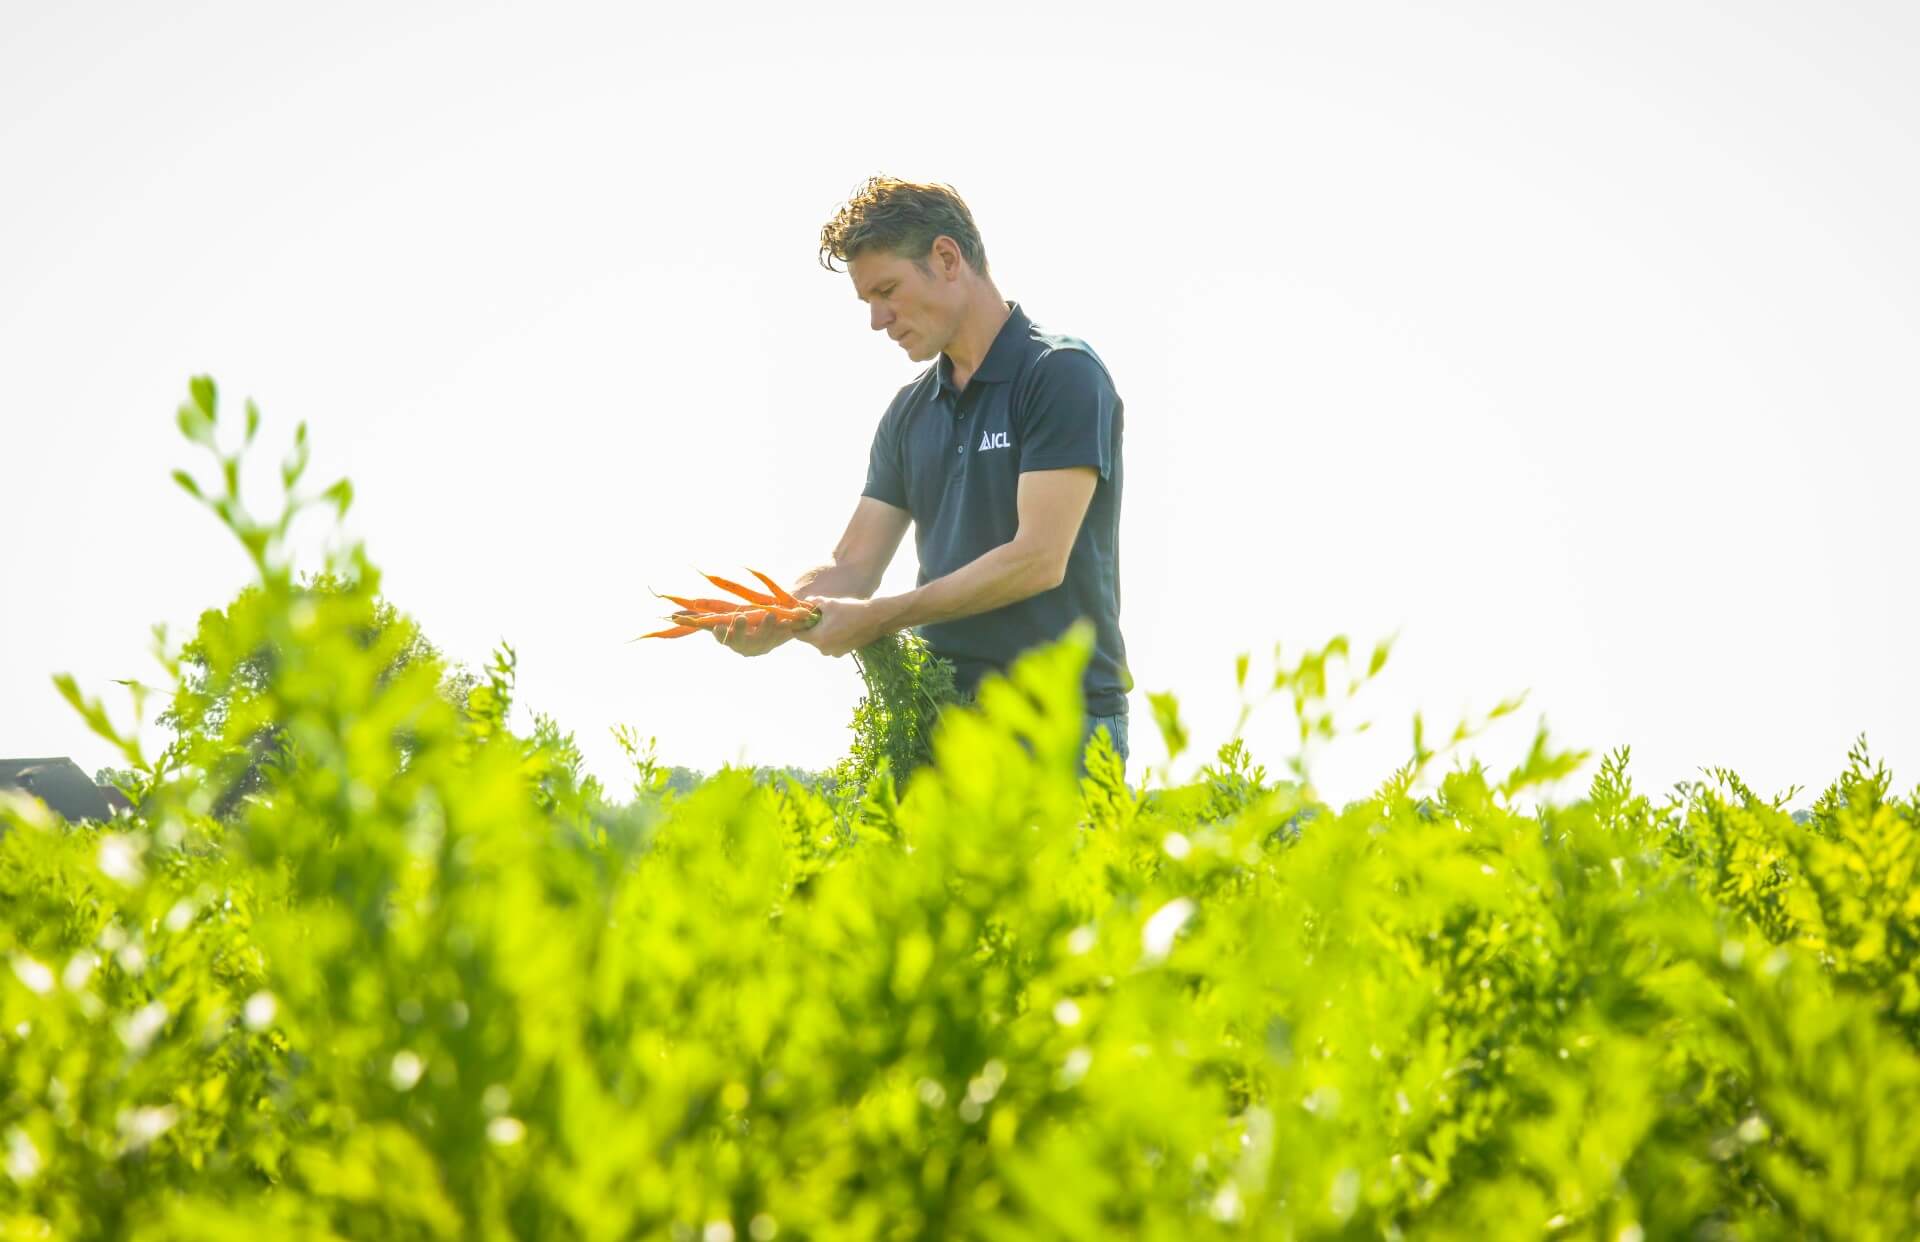
For years, the sector has been drowning in big data in agriculture but starving for insights. In 2025, we saw a flood of sensors and apps. In 2026, the focus is on standardization and connectivity.
The industry is transitioning to true agronomic data analytics. It’s no longer about collecting isolated points of information; it’s about unified systems that can compare entire growing seasons, identify cross-regional patterns, and generate automatic operational recommendations.
A Major Shift for 2026: Israel has officially joined the European effort to lead AgData standardization. This is a game-changer. It means that fragmented data siloes are breaking down. Decision Support Systems (DSS) can now “speak” the same language, allowing algorithms to analyze years of historical data to predict pest outbreaks or nutrient deficiencies with unprecedented accuracy.
The ICL Perspective: We are leveraging these standardized data flows to refine our nutrient use efficiency (NUE) models, ensuring that every grain of fertilizer is accounted for.
2. Automation & Robotics: Breaking the ROI Barrier
In previous years, agricultural robotics were often viewed as impressive prototypes. In 2026, the narrative has shifted to Return on Investment (ROI). The driving force is the intensifying global labor crisis, making precision agriculture not just a luxury, but a survival mechanism.
What to watch this year:
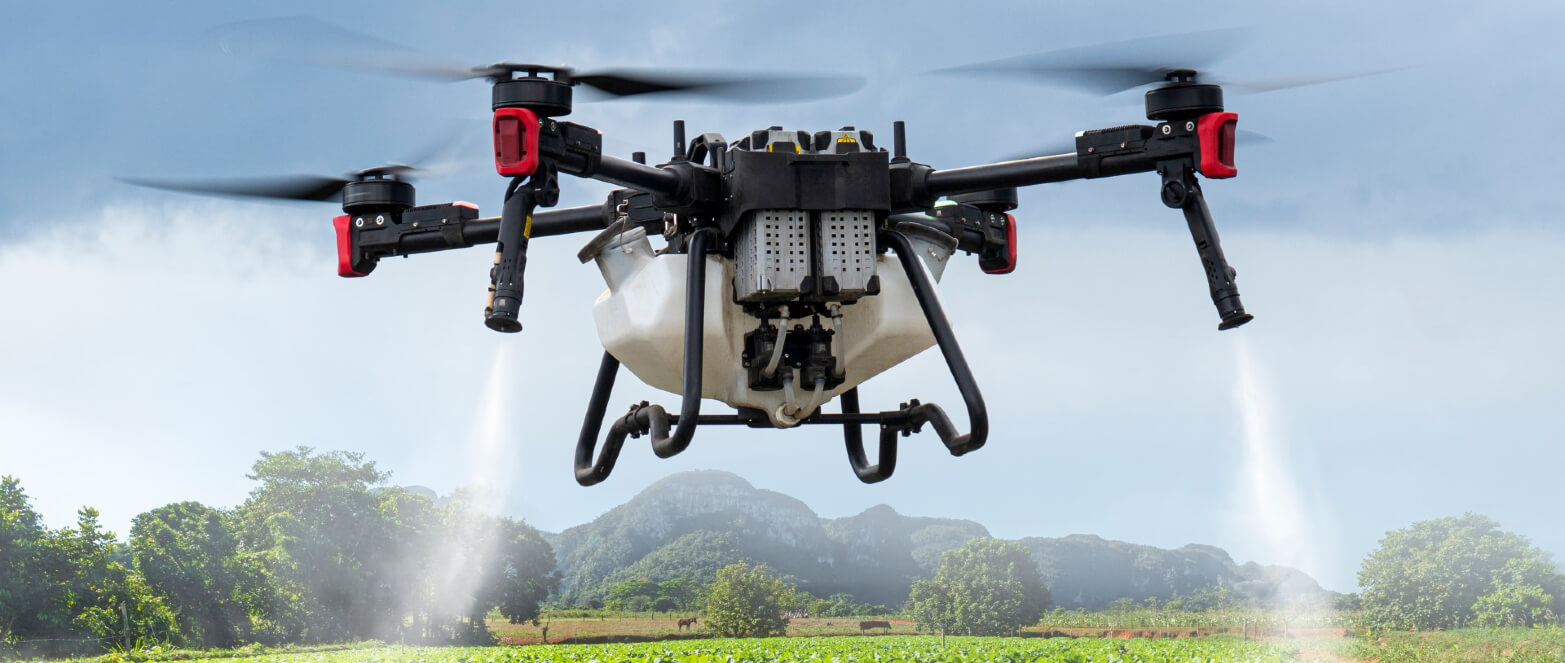
- Autonomous Fleets: Tractors and sprayers that operate 24/7 without human intervention are becoming standard.
- Remote Crop Monitoring: Advanced sensors and drones are now providing real-time health alerts, reducing the need for manual field scouting.
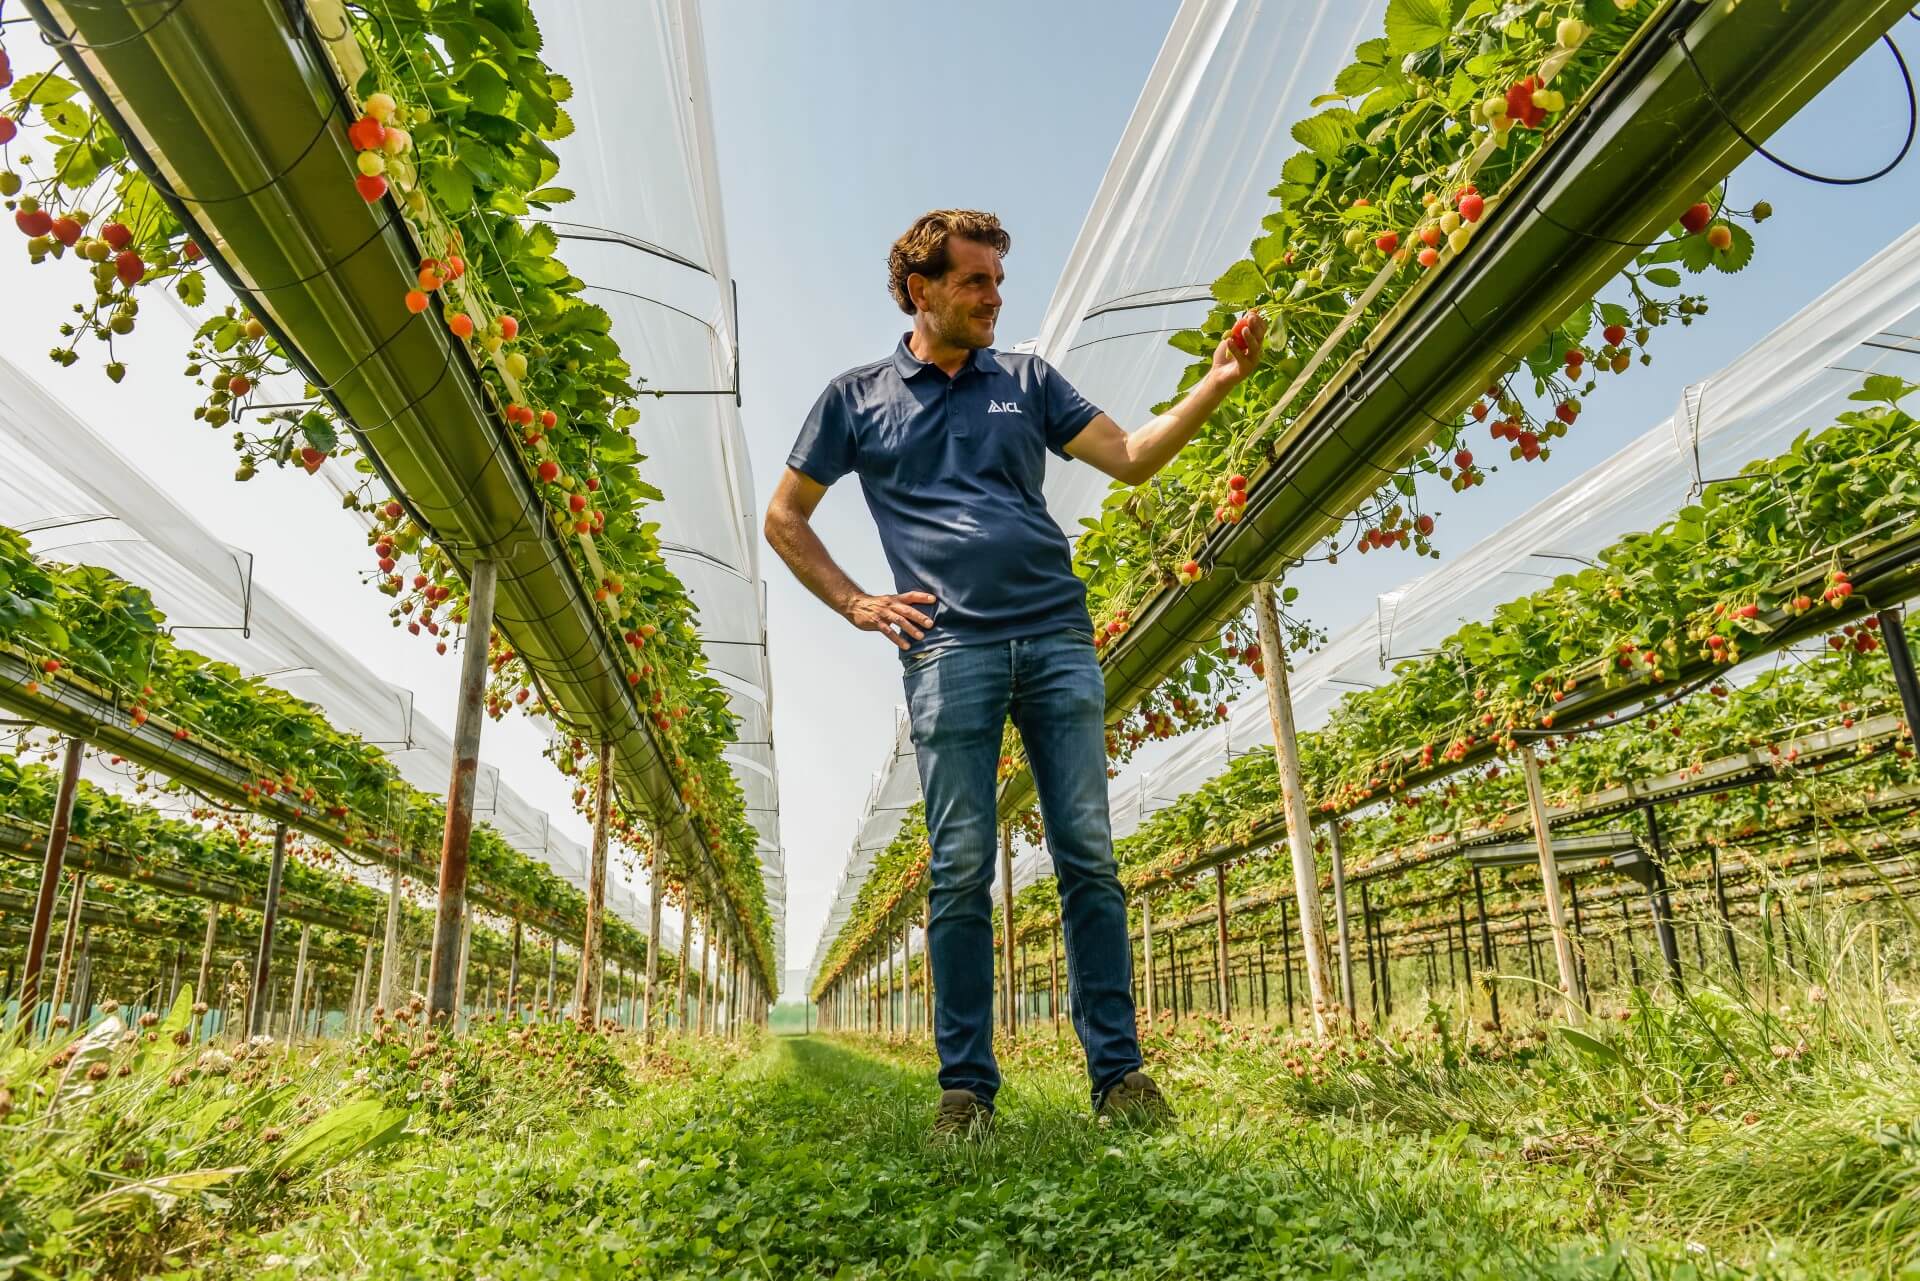
- Precision Harvesting: Robotic arms can now handle delicate fruits at a speed that rivals human pickers.
Manufacturers are finally offering leasing models and lower entry costs, making these technologies accessible to mid-sized growers who need to solve labor bottlenecks now.
3. Climate-Smart Agriculture: The “Defense” Strategy
While sustainability remains a core value, the buzzword for 2026 is “Resilience.” Climate change is no longer a future prediction; it is a daily operational hazard.
Climate-Smart Agriculture (CSA) has evolved from a mitigation strategy to a defense strategy. Farmers are adopting active protection measures:
- Physical Protection: We are seeing a massive increase in the deployment of smart netting and shading systems to physically shield crops from abiotic stress.
- Physiological Hardening: This involves the use of advanced biostimulants and controlled release fertilizer technologies designed to “harden” the plant, improving its natural tolerance to salinity and heat while minimizing environmental impact.
4. The Biotech Leap: CRISPR & Non-GMO Breeding
Perhaps the most significant divergence from 2025 is the speed of genetic innovation. Traditional breeding methods simply cannot keep pace with the rapidly changing climate. In 2026, the industry is embracing Biotechnology acceleration.
The spotlight is on CRISPR and Gene Editing. Unlike traditional GMOs (which introduce foreign DNA and face heavy regulation), CRISPR allows for precise edits within the plant’s existing genome.
Why this matters now:
- Speed to Market: We can now develop a drought-resistant variety in a fraction of the time.
- The “Non-GMO” Advantage: These gene-edited crops are increasingly classified separately from GMOs, allowing for faster regulatory approval.
- Targeted Solutions: Scientists are creating bespoke varieties tailored to specific 2026 challenges—such as wheat that thrives in higher temperatures.
Summary: The Year of Pragmatism
If we look back at our 2025 predictions, we saw the potential of technology. In 2026, we are seeing its necessity. The combination of big data in agriculture, pragmatic robotics, climate defense, and rapid gene editing forms the new toolkit for modern farming.
ICL continues to stand at the intersection of these trends, providing the advanced crop nutrition and digital tools needed to turn these challenges into sustainable growth.
Any questions?
Related stories
[
Innovation, Sustainability Global,
30 December 2025
\
Climate Tech Trends 2026: From Hype to Execution\
2026 is set to become a transitional year in the field of climate tech innovation
Read More](https://www.icl-group.com/blog/climate-tech-trends-2026-from-hype-to-execution/)
[
Innovation, Sustainability
29 December 2025
\
5 AgriTech Trends Driving a Sharper, Smarter Future of Agriculture in 2026\
2026 is set to be a pivotal year for AgTech innovations, as a wave of
Read More](https://www.icl-group.com/blog/future-of-agtech-2026/)
[
Innovation, Sustainability Global,
28 December 2025
\
Food Tech Trends 2026: Smarter, Leaner, More Sustainable\
The next wave of foodtech trends is emerging with more focus, more discipline, and far
Read More](https://www.icl-group.com/blog/food-tech-trends-2026-smarter-leaner-more-sustainable/)
[
Sustainability
23 November 2025
\
ICL Dead Sea: From the Depths of the Dead Sea to the World — Minerals that Sustain Life\
The Dead Sea’s Global Significance The Dead Sea, positioned between Israel and Jordan, is part
Read More](https://www.icl-group.com/blog/icl-dead-sea-sustainable-minerals/)
[
Sustainability Global
20 November 2025
\
The Role of Fertilizers in Combating World Hunger: ICL’s Impact on Agricultural Yield\
The global agricultural system will face unprecedented challenges to food security over the next decade.
Read More](https://www.icl-group.com/blog/icl-fertilizers-global-food-security/)
[
Sustainability Global
17 November 2025
\
From Waste to Worth, Building a More Sustainable Food System\
Feeding a Growing Planet Hunger remains one of humanity’s greatest challenges. Nearly 800 million people
Read More](https://www.icl-group.com/blog/sustainable-food-system-waste-to-worth/)
Show more

Facebook-f Instagram Youtube Linkedin-in X-twitter
Governance
Leadership
Board of Directors
Agriculture
Energy
Industrial
Health & Personal Care
AgTech
Transportation
Food
Paints & Coatings
Sustainable Solutions
Open innovation
Industry 4.0
Planet Startup Hub
Our Environment
Our Community
Our People
Our Products
I
ICL ESG Report
Document Hub
Our Planet Startup Hub Website
Reports, News & Events
Stock and Credit Information
Industry Resources
Interactive Data tool
Subscribe to Investor Email Alerts
Investor Relations Contacts
Career
Media Hub
Contact us
Sitemap
ICL 2026, all rights reserved © 2026, Powered by Netrise
Supplier & Customer Resources
│Accessibility
│ Privacy policy
│Terms of use
About US
Our Business
Our Innovation
Planet Startup Hub
Sustainability
Investors
Career
Media Hub
Contact us
Sitemap
Supplier & Customer Resources
│Accessibility
│ Privacy policy
│Terms of use
ICL 2026, all rights reserved © 2026
Powered by Netrise
Cookies on this website.
We use cookies on our website to give you the most relevant experience by remembering your preferences and repeat visits. By clicking “Accept”, you consent to the use of ALL the cookies.
Privacy Policy
Accept all cookiesCookie Preferences
Consent Management
Close
Privacy Overview
This website uses cookies to improve your experience while you navigate through the website. Out of these, the cookies that are categorized as necessary are stored on your browser as they are essential for the working of basic functionalities of the ...
Necessary
Necessary
Always Enabled
Necessary cookies are absolutely essential for the website to function properly. These cookies ensure basic functionalities and security features of the website, anonymously.
| Cookie |
Duration |
Description |
| ApplicationGatewayAffinity |
session |
This cookie is set by the Laravel Framework. This cookie is used for managing browsing sessions. It enables keeping the web browser traffic assigned to single server. |
| cookielawinfo-checbox-analytics |
11 months |
This cookie is set by GDPR Cookie Consent plugin. The cookie is used to store the user consent for the cookies in the category "Analytics". |
| cookielawinfo-checbox-functional |
11 months |
The cookie is set by GDPR cookie consent to record the user consent for the cookies in the category "Functional". |
| cookielawinfo-checbox-others |
11 months |
This cookie is set by GDPR Cookie Consent plugin. The cookie is used to store the user consent for the cookies in the category "Other. |
| cookielawinfo-checkbox-advertisement |
1 year |
Set by the GDPR Cookie Consent plugin, this cookie is used to record the user consent for the cookies in the "Advertisement" category . |
| cookielawinfo-checkbox-necessary |
11 months |
This cookie is set by GDPR Cookie Consent plugin. The cookies is used to store the user consent for the cookies in the category "Necessary". |
| cookielawinfo-checkbox-performance |
11 months |
This cookie is set by GDPR Cookie Consent plugin. The cookie is used to store the user consent for the cookies in the category "Performance". |
| CookieLawInfoConsent |
1 year |
Records the default button state of the corresponding category & the status of CCPA. It works only in coordination with the primary cookie. |
| elementor |
never |
This cookie is used by the website's WordPress theme. It allows the website owner to implement or change the website's content in real-time. |
| viewed_cookie_policy |
11 months |
The cookie is set by the GDPR Cookie Consent plugin and is used to store whether or not user has consented to the use of cookies. It does not store any personal data. |
Functional
functional
Functional cookies help to perform certain functionalities like sharing the content of the website on social media platforms, collect feedbacks, and other third-party features.
| Cookie |
Duration |
Description |
| __cf_bm |
30 minutes |
This cookie, set by Cloudflare, is used to support Cloudflare Bot Management. |
| aka_debug |
session |
Vimeo sets this cookie which is essential for the website to play video functionality. |
| bcookie |
1 year |
LinkedIn sets this cookie from LinkedIn share buttons and ad tags to recognize browser ID. |
| li_gc |
5 months 27 days |
Linkedin set this cookie for storing visitor's consent regarding using cookies for non-essential purposes. |
| lidc |
1 day |
LinkedIn sets the lidc cookie to facilitate data center selection. |
| pll_language |
1 year |
The pll _language cookie is used by Polylang to remember the language selected by the user when returning to the website, and also to get the language information when not available in another way. |
Performance
performance
Performance cookies are used to understand and analyze the key performance indexes of the website which helps in delivering a better user experience for the visitors.
Analytics
analytics
Analytical cookies are used to understand how visitors interact with the website. These cookies help provide information on metrics the number of visitors, bounce rate, traffic source, etc.
| Cookie |
Duration |
Description |
| _ga |
2 years |
The _ga cookie, installed by Google Analytics, calculates visitor, session and campaign data and also keeps track of site usage for the site's analytics report. The cookie stores information anonymously and assigns a randomly generated number to recognize unique visitors. |
| _ga_RGYFR17NC1 |
2 years |
This cookie is installed by Google Analytics. |
| _gat_UA-35315150-1 |
1 minute |
A variation of the _gat cookie set by Google Analytics and Google Tag Manager to allow website owners to track visitor behaviour and measure site performance. The pattern element in the name contains the unique identity number of the account or website it relates to. |
| _gid |
1 day |
Installed by Google Analytics, _gid cookie stores information on how visitors use a website, while also creating an analytics report of the website's performance. Some of the data that are collected include the number of visitors, their source, and the pages they visit anonymously. |
| CONSENT |
2 years |
YouTube sets this cookie via embedded youtube-videos and registers anonymous statistical data. |
| ln_or |
1 day |
Linkedin sets this cookie to registers statistical data on users' behaviour on the website for internal analytics. |
| vuid |
2 years |
Vimeo installs this cookie to collect tracking information by setting a unique ID to embed videos to the website. |
Advertisement
advertisement
Advertisement cookies are used to provide visitors with relevant ads and marketing campaigns. These cookies track visitors across websites and collect information to provide customized ads.
| Cookie |
Duration |
Description |
| _fbp |
3 months |
This cookie is set by Facebook to display advertisements when either on Facebook or on a digital platform powered by Facebook advertising, after visiting the website. |
| test_cookie |
15 minutes |
The test_cookie is set by doubleclick.net and is used to determine if the user's browser supports cookies. |
| VISITOR_INFO1_LIVE |
5 months 27 days |
A cookie set by YouTube to measure bandwidth that determines whether the user gets the new or old player interface. |
| YSC |
session |
YSC cookie is set by Youtube and is used to track the views of embedded videos on Youtube pages. |
| yt-remote-connected-devices |
never |
YouTube sets this cookie to store the video preferences of the user using embedded YouTube video. |
| yt-remote-device-id |
never |
YouTube sets this cookie to store the video preferences of the user using embedded YouTube video. |
| yt.innertube::nextId |
never |
This cookie, set by YouTube, registers a unique ID to store data on what videos from YouTube the user has seen. |
| yt.innertube::requests |
never |
This cookie, set by YouTube, registers a unique ID to store data on what videos from YouTube the user has seen. |
Others
others
Other uncategorized cookies are those that are being analyzed and have not been classified into a category as yet.
| Cookie |
Duration |
Description |
| .AspNetCore.Antiforgery.z3Ld7J6M9Fc |
session |
No description |
| ApplicationGatewayAffinityCORS |
session |
No description available. |
| DEVICE_INFO |
5 months 27 days |
No description |
Decline All Cookies Save My Preferences ACCEPT ALL
Powered by GDPR Cookie Compliance 

