We are proud to announce our 2025 Core Values Award winners and runners-up. Each honoree was among hundreds of nominations submitted by fellow employees and colleagues. Read about each winner and runner-up and how they embody each Core Value.…
We are proud to announce our 2025 Core Values Award winners and runners-up. Each honoree was among hundreds of nominations submitted by fellow employees and colleagues. Read about each winner and runner-up and how they embody each Core Value.
Actively C.A.R.E.
Winner – Priyanka Reddy
Priyanka Reddy Honored with Actively C.A.R.E. Core Value Award
Priyanka Reddy, HR Data Analyst II at the Goa office, has been named the recipient of H&P’s Actively C.A.R.E. Core Value Award — a recognition that celebrates her remarkable compassion and unwavering support for colleagues in times of need.
Going Beyond the Call of Duty
The nomination that earned Reddy this honor tells a powerful story of human kindness. When a colleague was involved in a serious bike accident resulting in a fractured hand and head injury, Reddy immediately stepped in to help. With no family in Goa to turn to, Reddy accompanied him to the hospital and stayed by his side throughout the night and the following day, ensuring he received proper care and wasn’t alone during this frightening time.
Her support extended far beyond that initial crisis. Reddy managed hospital formalities, coordinated with doctors and provided crucial emotional support until his family could arrive from their hometown.
“I imagined myself in his place, as I also live here without family,” Reddy said. “Remembering my own experiences, I wanted to make sure he did not have to go through that difficult time alone.”
This wasn’t an isolated incident. In another instance, Reddy opened her home to a remote employee who was temporarily working from the Goa office, providing accommodation for over a month. “I clearly remember the difficulties I faced when I first moved to Goa, and I did not want someone else to go through the same situation,” she said.
Actively C.A.R.E.ing Every Day
For Reddy, who has been with H&P for nearly two years, the Actively C.A.R.E. core value isn’t just a workplace principle — it’s a way of life shaped by her upbringing and supported by her managers, Nitin Kamat and Christopher Shea.
“I grew up in a ‘girl squad’ with my mom, sister and me, and watching them handle challenges with care, patience and determination has shaped who I am today,” she said.
She embodies this value daily through simple but meaningful actions: checking in on colleagues, being patient and approachable, listening when someone needs support and stepping in when she sees someone struggling.
Words of Wisdom
When asked what advice she would give to others wanting to demonstrate this core value, Reddy emphasized the importance of empathy and presence:
“Pay attention to the people around you, listen without judgment and offer help whenever you can, even in small ways,” she said. “Caring isn’t just about big gestures — it’s in the everyday support, encouragement and understanding you show.”
A Ripple Effect
Reddy’s actions have created a ripple effect throughout the organization, helping to build trust, support and a sense of belonging.
“When colleagues know that someone genuinely cares and is willing to step in during difficult times, it builds confidence, encourages collaboration and strengthens relationships,” she said.
Reflecting on what it means to work for a company that recognizes these values, Reddy said:
“It shows that H&P doesn’t just talk about empathy, care and teamwork — it lives them. Being in an environment where acts of kindness and support are noticed and appreciated motivates me to continue giving my best, not just in work but in how I treat others.”
Runner Up – Patrick Gustafson
Patrick Gustafson, engineering operations support superintendent, has been selected as runner-up for H&P’s Actively C.A.R.E. Core Value Award, recognizing his 21-year commitment to safety and operational excellence.
Recognition Honors Safety-First Approach
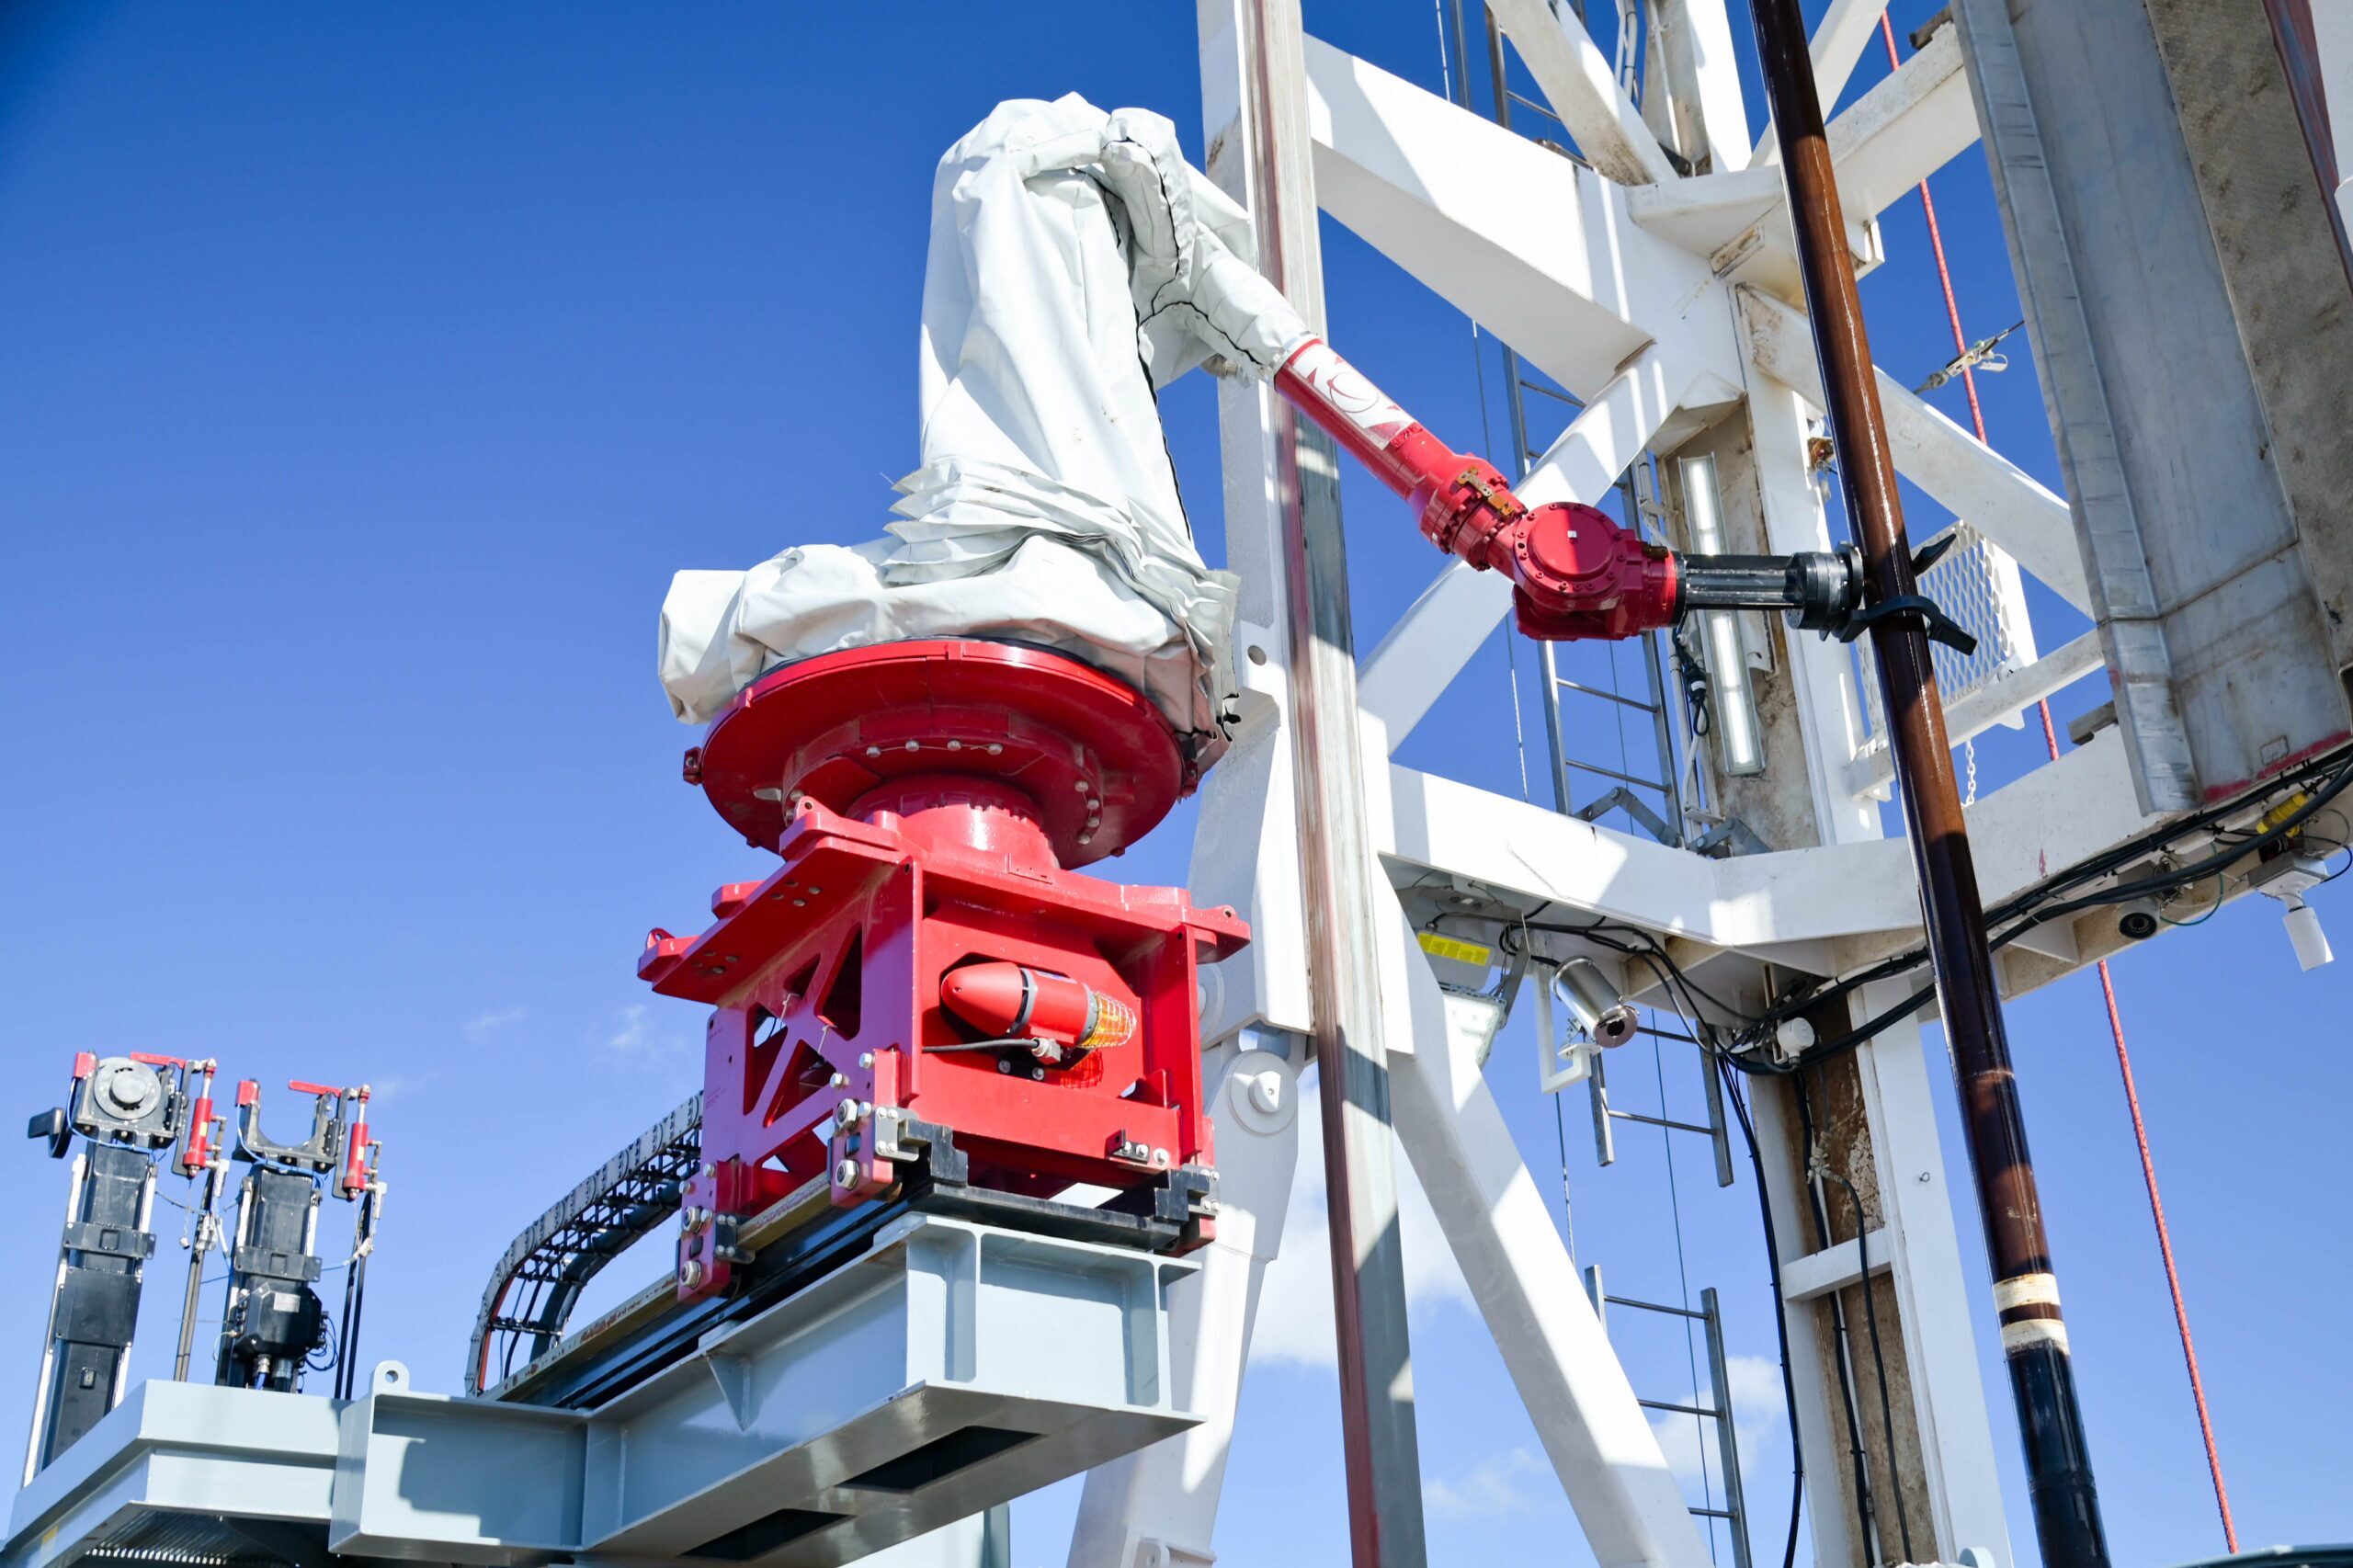
Gustafson was nominated for his leadership on the FlexRobotics project and development of the Ton Mile app, where he prioritized crew safety and process improvement. His work on Rig 918, H&P’s test rig, has influenced operational standards across the fleet.
“To be nominated for the award and to make it to runner-up by the committee is very honoring,” Gustafson said. “I don’t collectively think about Actively Caring specifically while at work. For co-workers to recognize and nominate me makes me feel good that my actions and passion come through in an Actively C.A.R.E. mindset.”
Focus on Crew Safety Drives Innovation
The nomination praised Gustafson’s dedication to ensuring new technologies enhance rather than compromise field safety. His work on the FlexRobotics project emphasized understanding current crew processes and challenges before implementing changes. He also championed a redesign of the driller’s console to improve ergonomics, demonstrating his focus on crew welfare.
“A big part of my focus for the team was to ensure all understood how the crews currently did processes and challenges faced to do them safely,” Gustafson said. “I wanted to ensure the design and impacts of the robotics processes did not add burdens or additional hazards and risks.”
Mentorship Shapes Career Philosophy
Gustafson credited mentors Rodney Evenson, George Michalopulos, Joel Ruark, Ken Wyatt, Dominic Perri and Chris Major, along with superintendents, rig managers and crews he has worked with throughout his career.
“All the knowledge I share and mentor is not mine; it was shared or passed to me by great people,” Gustafson recalled a mentor telling him early in his career. “It’s my job to continue to share it and mentor.”
His advice to colleagues: surround yourself with strong people, listen more than you speak and never compromise on personal ethics.
“Be willing to sit back and listen,” Gustafson said. “Never be afraid to make a mistake but be humble and take criticism constructively.”
Leadership Extends Across Operations
Nominations noted Gustafson’s regular participation in FlexCall meetings, where he helps guide operational strategy with a human-centered perspective. He routinely conducts tours of Rig 918 for anyone interested in the H&P’s innovations, emphasizing his commitment to sharing knowledge and advancing the organization’s future.
Gustafson said the recognition reflects H&P’s cultural foundation, which existed long before core values were formalized.
“When H&P was smaller, there were always conversations of recognition when it was deserved or warranted,” he said. “As H&P grew to a size where many don’t have the opportunity to work together and be recognized, for them to understand it was important to formally recognize and choose by committee is a testament to the foundation of core values H&P has.”
Teamwork
Winner – Zach Newton
Zach Newton Wins Teamwork Core Value Award for Leading Flex5 Rig Innovation
Zach Newton, senior project engineer at H&P, has been named the Teamwork Core Value Award winner for his leadership in developing the walking Flex5 rig class and dedication to cross-functional collaboration.
Newton, who has worked at H&P for 10 years, spearheaded the year-long project that converted existing Flex5 rigs from skid-based to walking platforms through a modular retrofit system. The innovation significantly increased pad design flexibility and advanced drilling practices, reinforcing H&P’s position as an industry standard.
A Humbling Recognition
“This award is very humbling, and I am genuinely honored to receive it,” Newton said. “Teamwork is a value I strive to demonstrate consistently at H&P, regardless of the task or situation. I believe the strongest outcomes are achieved when people trust one another, communicate openly, and share responsibility in working toward a common goal.”
The Flex5 rig project required close coordination among engineers, construction personnel, rig managers and field teams across the organization.
“While the technical challenges were significant, the greater challenge was helping multiple groups stay aligned around a shared objective while maintaining schedule, safety and customer expectations,” Newton said. “My role focused on keeping communication open, staying accessible and listening carefully to feedback so decisions reflected both engineering requirements and operational realities.”
Innovation Through Collaboration
Newton implemented the first boom arm and festoon coupling system, enabling the new rig class to exceed expected drilling area capabilities. He led efforts to adapt diesel engine skids to accommodate larger natural gas engines, leveraging field personnel expertise to develop innovative structural solutions.
“The success of the project was a direct result of strong cross-functional collaboration, with each team contributing its expertise toward a common goal and delivering results that benefited both the customer and the company,” he said.
Beyond rig upgrades, Newton has been instrumental in safety improvements, including developing pneumatic slip lifters to reduce field injury risk. He managed the implementation of the complex HexGrip 120 tool connection system while coordinating cross-functional communication.
Building the Next Generation
As a mentor to new engineers, Newton actively transfers technical and institutional knowledge to ensure future H&P leaders maintain standards of innovation and excellence.
“I try to embody teamwork in my daily work by staying accessible, listening carefully and making collaboration part of every decision,” Newton said. “Mentoring newer engineers is also important to me, and I try to share knowledge and include them in meaningful project work.”
Newton credits mentors Cory Artz, Pat Gustafson and Chris Major for influencing his approach to teamwork and problem-solving.
“Their practical experience, willingness to share knowledge and focus on doing what’s best for the team have shaped my perspective more than they probably realize,” he said.
Advice for Colleagues
Newton offered guidance for others seeking to demonstrate teamwork:
“Start by listening and approaching work with a team-first mindset. Take the time to understand different perspectives, especially from the people closest to the work, and don’t assume one group has all the answers.”
He added that consistent actions build trust and shared ownership.
“When people trust each other and share ownership of the outcome, better solutions emerge and success becomes something the whole team can stand behind,” he said.
H&P’s commitment to The H&P Way continues to help employees succeed.
“Working for a company that recognizes and celebrates these values means a lot to me because it shows that how we treat one another matters just as much as the results we deliver,” Newton said. “It reinforces a culture of respect and collaboration and encourages people to support each other.”
Runner Up – Bilal Debche
Bilal Debche Recognized as 2025 Teamwork Core Value Award Runner-Up
Bilal Debche, operations manager for United Arab Emirates and Iraq, has been named runner-up for H&P’s 2025 Teamwork Core Value Award, recognizing more than 13 years of leadership built on collaboration, accountability and supporting others through complex operational challenges.
The award follows Debche’s work supporting operations in the UAE and leading the successful reactivation of rig T-601 in Iraq — projects that required extensive coordination across multiple teams and stakeholders under demanding conditions.
“After more than 13 years with the company, it reinforces that how we work together is just as important as what we deliver,” Debche said. “I have always believed that strong results come from trust, collaboration, and supporting one another, especially during challenging times.”
The T-601 reactivation presented technical, scheduling and coordination obstacles that Debche addressed by aligning local and regional teams around shared objectives while maintaining open communication and accountability. The effort resulted in successful reactivation, improved team alignment and strengthened operational readiness.
Colleagues describe Debche’s leadership as rooted in creating an environment where team members feel supported and heard. He invests time both during and outside working hours to provide technical guidance, operational clarification and support, ensuring transparent communication across functional teams, contractors and client representatives.
Leading Through Challenge
Debche’s approach to Teamwork was particularly evident during periods of heightened regional security concerns. Rig-site teams maintained safe, stable operations while detailed contingency planning proceeded in coordination with H&P’s Global Security team in Tulsa and the Kuwait team under Country Manager, Ard Louis.
During the T-601 reactivation, H&P was the only contractor that maintained full operations while remaining prepared for immediate evacuation if required — a demonstration of preparedness and trust that Debche credits to professional teamwork and leadership.
“The rig-site teams had complete confidence that they were being managed and led by competent, professional leadership,” he said.
People-First Philosophy
Debche’s daily work emphasizes collaboration across functions and locations, ensuring alignment on shared objectives. He prioritizes knowledge sharing, encourages team members to raise concerns and propose ideas, and focuses on bringing the right people together when obstacles arise.
“My advice would be to focus on people first and results will follow,” Debche said. “Strong leadership is not about authority, but about accountability, collaboration, and setting the right example.”
He said living the Teamwork core value has strengthened trust across functions and regions, enabling teams to work more efficiently and address issues proactively. The approach has contributed to improved morale, stronger cross-functional relationships and greater confidence in executing demanding projects.
“Working for a company that recognizes and celebrates its core values is both motivating and meaningful to me,” Debche said. “It demonstrates that H&P values not only performance, but also the behaviors and principles that drive long-term success.”
Innovative Spirit
Winner – Bryan Paige
Bryan Paige, a derrickhand with more than four years at H&P, has been named the 2025 Innovative Spirit Core Value Award winner.
From Rig Floor to Patent Application
Paige earned the recognition for his hands-on engineering contributions while working on the FlexRobotics® project at H&P test Rig 918, where he served as derrickhand, motorhand and driller.
While his primary responsibility involved operating and maintaining the rig, Paige identified opportunities to improve safety, efficiency and equipment functionality. When existing solutions fell short, he built prototypes using materials available on site.
Building Solutions From Scratch
One notable project involved constructing a full-scale wooden mockup of the driller’s cabin and console. The physical prototype helped the engineering team visualize and test optimal layouts for human-machine interfaces and controls.
“I was able to help the engineering team visualize and test the optimal layout for HMIs and controls,” Paige said. “I also provided feedback on placement and ease of use, so the final design would work better for drillers in the field.”
Paige also collaborated with fellow rig hand Jeff Byrd to develop a pipe retention system for the robotic racking board. After identifying a gap in the existing setup, the pair brainstormed and built a working prototype over a weekend.
That design became the foundation for the retention system deployed on FlexRobotics®’ first installation, Rig 618. H&P has since filed for a patent on the design.
Fleet-Wide Impact
“For me, just to be nominated by my peers is an incredible honor, but to be selected the winner of this prestigious award out of so many nominations is very overwhelming,” Paige said.
He credited the collaborative environment at Rig 918, where rig crew leadership Pat Gustafson and Troy Hayes fostered what he called a “judgment-free teamwork environment” that valued individual creativity and feedback.
Paige also acknowledged support from Andrew Rose and Elizabeth Stapleton, along with engineering and IT department leaders Chay Chinsethagid, Joel Ferland, Craigan Wild and Chris Major.
Advice for Others
When asked what advice he would give colleagues wanting to demonstrate Innovative Spirit, Paige emphasized curiosity over judgment, openness to change and the courage to explore creative ideas.
“Never settle for ordinary, but be extraordinary,” he said.
The impact this core value has for H&P is that the project offers significant industrial change to the energy sector through the advancement of FlexRobotics®. Placing H&P at the forefront of rig automation. Paige said the recognition affirms forward-thinking and creative problem-solving that can make lasting impacts for future generations.
Runner Up
Nicholas Geib
Nicholas Geib, senior quality technician at our FlexRig Machinery Center (FMC), has been named runner-up for H&P’s 2025 Core Value Award for Innovative Spirit.
The recognition honors Geib’s consistent efforts to improve processes and create long-term value across our operations during his four years with the company.
“This recognition means a great deal to me because it affirms that innovation is not just about new ideas, but about consistently improving how we work and how we support one another,” Geib said. “I see this award not as an endpoint, but as encouragement to continue learning, improving and helping others succeed.”
The award recognizes several initiatives Geib led that resulted in measurable operational improvements. When the FMC transitioned to Oracle Fusion, inspection paperwork requirements increased significantly. Geib proposed an independent QR scanning solution using a $30 scanner that streamlined data input from minutes to seconds. Leadership adopted the tool across multiple work centers after seeing its impact.
Geib also challenged longstanding assumptions about repair processes. He discovered that RLA (Rotating Link Adapter) body repairs — previously outsourced at costs ranging from $800 to $10,000 per unit — could be completed in-house for $150 while maintaining quality standards. The change produced more than $100,000 in annual savings while reducing turnaround times.
Additional contributions included introducing laser cladding methods to expand our repair capabilities and developing a heat-treat crack repair procedure that further reduced recurring costs. Geib also worked with our fabrication and quality departments to establish clearer pathways for professional development and state certifications.
“In my day-to-day work, this often means questioning why a process exists the way it does and looking for practical ways to make it more efficient or reliable,” Geib said. “I tend to focus on solutions that can be implemented and sustained.”
Geib said his approach relies heavily on collaboration with experienced team members and maintaining openness to feedback when adjustments are needed.
“I don’t always get things right the first time,” he said. “When that happens, I take feedback seriously and make corrections rather than defending the original approach.”
Geib credited multiple influences for shaping his innovative mindset, including his spouse, Meagan Dickinson, an H&P leader who “consistently takes on new challenges head-on.” He also cited his uncle, Ronnie Willis, a veteran of the oilfield and manufacturing world; his father for maintaining a fix-it mindset; and Robert Taylor, overhaul manager at FMC, for supporting innovation at scale.
His advice for colleagues seeking to demonstrate our Innovative Spirit core value: Focus on immediate improvements, involve people who do the work daily and embrace failure as part of the process.
“Take ownership of your ideas, follow them through, learn from what doesn’t work and adjust,” Geib said. “Staying open to feedback and willing to try again is what turns ideas into real improvement.”
Geib said our company’s recognition of continuous improvement aligns with his belief that organizations must continue learning and adapting to remain competitive.
“Being part of a company that values progress, accountability and forward thinking is important to me, and it motivates me to continue contributing in ways that help strengthen both our operations and our teams,” he said.
Service Attitude
Winner – Hari Hara Sudhan Natarajan
Hari Hara Sudhan Natarajan, a well control and tubular equipment supervisor with 12 years at legacy KCA Deutag and H&P, has been named the 2025 Service Attitude Core Value Award winner.
The recognition comes after colleagues nominated Natarajan for his consistent dedication to supporting operations and maintaining a solutions-focused approach during challenging situations.
“Receiving the Service Attitude Core Value Award is both an honor and a deeply meaningful moment for me,” Natarajan said. “It reassures me that the way I work — staying positive, being dependable and supporting others — is making a real impact on my team and our operations.”
As part of the Well Control Equipment and Tubulars team, Natarajan coordinates critical equipment inspections, tracking and delivery across multiple rigs in Oman. His nomination highlighted his willingness to assist colleagues regardless of schedule demands and his ability to remain calm under pressure while finding practical solutions.
One situation that contributed to the recognition involved coordinating support for several rigs simultaneously during a period of high activity and unexpected equipment challenges. Natarajan worked with maintenance, logistics and rig leadership to streamline communication and prevent delays, often extending his availability beyond regular hours.
“I embody the Service Attitude core value by always approaching my work with reliability, clarity and a genuine commitment to supporting others,” Natarajan said. “For me, service is not just a task; it’s a daily mindset.”
Natarajan credited several colleagues for their support, including Joerg Scheel, E&M manager for the Southern Hub, and Ahmed Al Balushi, general manager of the Southern Hub, Eastern Hemisphere. He gave special recognition to Imran Iqbal, equipment supervisor, who initiated the nomination process.
The award reflects collaboration across multiple departments, including the E&M team, Oman operations team, supply chain, warehouse and logistics, human resources and QHSE teams.
“I’ve always focused on doing my work with a service mindset — supporting operations, solving problems and helping wherever needed — without expecting anything in return,” he said. “Realizing that people noticed and appreciated those efforts was both surprising and deeply motivating.”
For others seeking to demonstrate Service Attitude, Natarajan advises approaching work with a mindset of service rather than obligation.
“Be proactive, take ownership and look for ways to support others even beyond your immediate responsibilities,” he said. “Small acts of helpfulness often make the biggest impact.”
Runner Up – Kimberly Fink
Kimberly Fink, senior attorney at H&P, has been named runner-up for H&P’s Service Attitude Core Value Award, recognition that stems from her unwavering commitment to supporting teams across the globe.
Fink, who has worked at H&P for five years, was nominated for her dedication to serving international operations, often working late into the night to meet urgent deadlines and handling complex requests with consistency and grace.
Supporting Teams Around the Clock