News & Events News & Events Overview Press Releases IR Calendar Email Alerts Presentations Annual General Meeting of Shareholders 2026 Annual General Meeting of Shareholders Date and Time April 30, 2026 8:30 AM PT 2025 Annual Report View 2025…
News & Events
News & Events
2026 Annual General Meeting of Shareholders
Date and Time
April 30, 2026
8:30 AM PT
2025 Annual Report
View 2025 Annual Report
Proxy Statement
View Proxy Statement
Board of Directors
Executive Chairman
Chairman of the Board
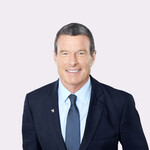
Michael O. Johnson
Michael O. Johnson is executive chairman and chairman of the board at Herbalife, a premier health and wellness company, community and platform serving customers in over 90 markets. In his role, Mr. Johnson is focused on supporting Herbalife’s executive team, creating shareholder value and championing initiatives that empower entrepreneurs;, promote healthy, active lifestyles; and can positively impact obesity, healthy aging and other issues affecting our society.
Mr. Johnson is an accomplished business leader with extensive experience expanding companies globally and spearheading successful business transformations. He served as CEO of Herbalife from 2003 to 2017, chairman from 2007 to early 2020 and CEO from 2019 to early 2020. He returned to the role of chairman and CEO from October 2022 to May 2025.
During Mr. Johnson’s initial tenure as CEO of Herbalife, the company nearly quadrupled sales and expanded its operations around the world from 58 to 94 markets. He evolved the company’s vision and introduced Herbalife to new audiences with an emphasis on nutrition; wellness; and healthy, active lifestyles. Under Mr. Johnson’s leadership, Herbalife’s product portfolio and R&D function significantly increased by bringing approximately 65% of all product manufacturing in-house, including the development and introduction of the Herbalife24 line of sports nutrition products. Additionally, he drove many of the company’s key marketing and brand initiatives, including the sponsorship of more than 200 athletes and teams around the globe, among them the Los Angeles Galaxy soccer team, the longest-running jersey sponsorship in MLS history.
In his most recent tenure as CEO, Mr. Johnson drove modernization efforts that positioned Herbalife for future growth by re-energizing Distributors, refreshing the brand and launching innovative products such as the company’s first-ever vegan line. He also spearheaded initiatives that further amplified the company’s successful sports sponsorships program, including campaigns that celebrate Herbalife-sponsored athletes and teams and that recognize the company’s rich legacy of supporting women in sports.
Prior to Herbalife, Mr. Johnson led multiple departments of Walt Disney as president of those divisions, including Walt Disney International, Walt Disney Asia and the Worldwide Home Entertainment division of Walt Disney Studios. As a testament to his leadership skills, during his time as president, he increased Disney’s international markets from 34 to 80.
Mr. Johnson is an avid health and fitness enthusiast who has been skiing and participating in triathlons and cycling races for more than 30 years.
Director

Dr. Richard H. Carmona
Dr. Richard Carmona is the first distinguished laureate professor of Public Health at the University of Arizona and a professor of surgery and pharmacy practice. He also serves as the chief of health innovations at Canyon Ranch, a global health and wellness company.
Prior to joining Canyon Ranch, he was the 17th Surgeon General of the United States having been confirmed unanimously by the United States Senate. Over several decades he has held many leadership positions in government, academics, and the private sector, such as CEO of a public hospital and healthcare system.
He is a U.S. Army combat decorated Special Forces soldier and is also a highly decorated former police officer and leader. Over the last decade and a half, he has served as a Director of the McKesson Corporation, The Clorox Company, Axon Enterprises, Better Therapeutics and Herbalife. On the various public boards, he has chaired nomination and governance committees and been a member of management, audit, compliance, and compensation committees. He has also served on many private boards.
His global reputation, scientific acumen, diverse leadership expertise and international connectivity make him an invaluable asset to Herbalife.
Director

Lynda Cloud
Lynda Cloud is a seasoned executive with nearly 30 years of education, online learning and health and wellness industry experience. Ms. Cloud served as the chief executive officer of the Institute for Integrative Nutrition from 2019 to 2024, where she was also a member of its board of directors and guided the organization’s strategic positioning and innovation during a period of unprecedented expansion for the health and wellness industry. Ms. Cloud served on the board of directors of Achieve3000 from 2020 to 2021. She previously served as chief executive officer at EqualEd from 2017 to 2018, a global startup focused on expanding and equalizing access to online learning tools in emerging and developed markets.
Prior to EqualEd, she acted as executive vice president of K12 Inc. from 2014 to 2017, where she ran its products and technology groups as well as its institutional division that built virtual schools. Lynda started her career at Pearson, where she rose to be general manager of its K12 learning businesses. Her expertise in navigating complex global markets and her commitment to high standards of quality and sustainability make her an invaluable asset to Herbalife’s mission of improving lives through nutrition.
Director
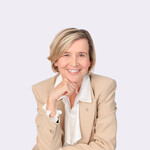
Sophie L’Hélias
Sophie L’Helias is an international corporate governance and ESG expert with extensive activist stewardship and deep knowledge of financial markets and investor sentiment. She is President of LeaderXXchange, a trusted advisory firm that develops value creating solutions through the integration of sustainability and diversity in strategy, leadership and investment.
Ms. L’Helias serves on the board of several non-profit organizations, including ECGI (European Corporate Governance Institute), a nonprofit organization that supports high quality academic research; board member of HCGE (Haut Comité de Gouvernement d'Entreprise), the self-regulating body that oversees the implementation of the AFEP-Medef code; and serves as non-executive director on the Board of Africa50, a development impact fund dedicated to improving infrastructure in Africa, Agence France-Locale, a community lending financial institution, and Echiquier Positive Impact and Climate Impact Europe funds. She is a Fellow at The Conference Board ESG Center in New York and serves on the Advisory Board of the Hawkamah Governance Institute in Dubai. Ms. L’Helias is also the former lead independent director of Kering, a global luxury group.
Ms. L'Helias is the recipient of the 2019 International Corporate Governance Network Lifetime Achievement Award in Corporate Governance; the 2019 New York Women in Asset Management Award - ESG; the 2018 Global Proxy Watch GPW 10 Award that designates the ten most salutary corporate governance influences in the world each year and was featured in Forbes 40 French Women Leaders list in 2019.
Director

Michael Levitt
Michael Levitt is an experienced finance executive with an extensive history of driving company growth and shareholder value. Mr. Levitt currently serves as the Chairman of Irradiant Partners, LP, an investment management firm and serves as a member of the firm’s Management and Investment Committees.
In addition to his significant financial expertise in consumer products and his knowledge of the corporate credit and investment markets, he holds a deep understanding of Herbalife’s business and a shared passion for the Company’s vision, having served on Herbalife’s Board from 2011 to 2014, as the Lead Director.
Mr. Levitt has held various executive and leadership roles at several investment firms, including Apollo Global Management, LLC, Stone Tower Capital, LP, Smith Barney Inc. and Morgan Stanley & Co.
Mr. Levitt received his undergraduate and Juris Doctor Degrees from the University of Michigan.
Director

Rodica Macadrai
Ms. Rodica Macadrai is an independent Herbalife distributor with 29 years of experience helping people live their best lives through personalized nutrition and a business opportunity. Ms. Macadrai is also a member of the company’s Chairman’s Club, an achievement she has held since 2020.
Originally from Moldova, she was pursuing an academic career when she discovered Herbalife products and the business opportunity. She quickly saw the enrichment it brought to her life and the lives of her customers and went on to build a successful business in 50 markets across Europe, Asia-Pacific, North America, and Latin America.
Ms. Macadrai is dedicated to helping others and regularly trains independent Herbalife distributors about the business, products, and the distributor difference. Her trainings and business philosophy have helped thousands of distributors grow sustainable businesses, foster customer relationships, and develop strong organizations.
As a member of the Board of Directors, Ms. Macadrai brings a first-hand understanding of the function and specific needs of independent distributors to the Board and provides valuable insight into growth opportunities.
Director
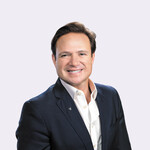
Juan Miguel Mendoza
Juan Miguel Mendoza is an independent Herbalife distributor with more than 30 years of experience helping people live healthy active lifestyles through personalized nutrition and coaching. Mr. Mendoza is also a member of the Company’s Chairman’s Club, an achievement he has held since 2013.
Mr. Mendoza regularly tours the world, training independent Herbalife distributors about the business, the products, and the importance of our distributor difference. He is an integral member of various strategy and planning groups for the Company.
As a member of the Board of Directors, Mr. Mendoza brings a first-hand understanding of the function and specific needs of the Company’s independent distributors, the ultimate drivers of Herbalife’s business, to the Board. His tenure as an independent distributor also provides valuable insight into the Company’s growth and development.
Lead Director
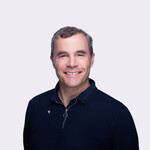
Perkins Miller
Perkins Miller is a seasoned e-commerce and media technology executive with extensive experience in driving growth and engagement in global digital media platforms. Mr. Miller currently serves as the CEO of PlayOn Sports, a technology company and engagement platform that connects schools, fans and sports teams through live streaming, digital ticketing and sports media.
With over two decades of leadership experience in technology, commerce, media and entertainment, his expertise leading digital media platforms and driving engagement through innovative strategies will lend itself to effectively elevate Herbalife’s community of Independent Distributors. Additionally, Mr. Miller’s breadth of digital experience will guide the development of the company’s wellness platform into a premier health and wellness destination.
Prior to his current role, Mr. Miller served as the CEO of Fandom, the world’s largest fan platform where fans immerse themselves in imagined worlds across entertainment and gaming, encompassing over 350 million monthly users and more than 250,000 communities dedicated to movies, TV and gaming. Mr. Miller has previously held a range of executive leadership roles, including general manager of the Americas and co-president of StubHub, chief digital officer and head of media operations at the National Football League and executive vice president of Digital Media at WWE. He also served as chief operating officer at Universal Sports and head of digital media at NBC Sports and the Olympics, where he managed significant media operations and digital strategies.
Mr. Miller is a two-time L.A. Times C-Suite Visionary Award winner (2022 and 2023) and was recognized as a 2018 Sports Business Journal “Power Player” and a 2014 Ad Age Media Maven. He has also earned multiple Emmy Awards for his work at the Beijing Olympics and for the Vancouver Olympics. In 2008, he was ranked #3 in Sports Business Journal’s Top 20 “Most Influential in Digital Sports.”
Director
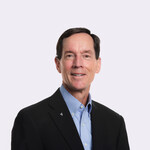
Donal L. Mulligan
Don Mulligan is a seasoned business builder with extensive experience as a Fortune 200 company CFO and public company director. He has worked extensively in Asia and Latin America and has cultivated strong relationships with institutional investors and the analyst community.
In addition to financial expertise and shareholder insights, Mr. Mulligan brings a strong track record of global expansion, talent development, capital structure evolution, risk management, business restructuring, investment oversight, M&A and corporate social responsibility.
Mr. Mulligan was most recently Executive Vice President and Chief Financial Officer for General Mills. He joined General Mills in 2001 and has held various senior management positions including Vice President Financial Operations for the International division; Vice President Financial Operations for Operations and Technology and Vice President and Treasurer.
Prior to joining General Mills, Mr. Mulligan gained extensive experience in financial management, operations and international administration in various positions with Pillsbury, PepsiCo and YUM! Brands.
Presently, Mr. Mulligan serves on the boards of Tennant Company, a leader in the cleaning technology and machinery industry; and Energizer Holdings, Inc., one of the world's largest manufacturers and distributors of primary batteries.
Director
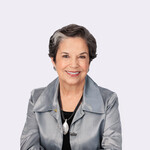
Maria Otero
Ms. Maria Otero currently serves on the board of directors of Development Alternatives Inc., a global development company. Ms. Otero’s expansive career focused on empowering those less fortunate around the world, leadership roles, extensive public service and microfinance experience help Herbalife deliver on its mission to help people live healthy active lifestyles.
In 2009, she was nominated by President Obama and confirmed by the US Senate to serve as Undersecretary of State for Democracy and Global Affairs. In 2012, Secretary Clinton named Maria Otero as Undersecretary for Civilian Security, Democracy, and Human Rights, a newly created office and position at the State Department, where she served until 2013. During her time at the Department of State, Undersecretary Otero also served as the President’s Special Coordinator for Tibetan Issues. She became the highest-ranking Hispanic official at the State Department and the first Latina undersecretary in its history. She was appointed by President Clinton to chair the board of the Inter-American Foundation and by President Bush to serve as vice-chair on the board of the US Institute of Peace. In 2006, she was appointed by Secretary General Kofi Annan to the U.N. Advisors Group on Inclusive Financial Sectors. She also chaired the board of Bread for the World and served on the boards of the Calvert Foundation and BRAC in Bangladesh.
From 2000 to 2009 Ms. Otero served as President and CEO of Accion International, a global microfinance organization operating in 26 countries. In that capacity, she chaired the board of Accion Investments, a global equity investment fund and represented Accion on the board of several microfinance banks. Ms. Otero also worked as an economist for Latin America and the Caribbean in the Women in Development Office of USAID. She is a member of the Council of Foreign Relations.
Ms. Otero holds an M.A. in literature from the University of Maryland; an M.A. in International Relations from the Paul H. Nitze School of Advanced International Studies (SAIS), at the Johns Hopkins University; and holds an honorary Doctorate of Humane Letters.
Director

Des Walsh
Des Walsh is a seasoned global executive with more than 40 years of leadership experience in sales, marketing and operations, including nearly two decades in senior executive roles at Herbalife. He brings deep expertise in global business strategy, international market expansion and distributor engagement, along with extensive experience overseeing complex worldwide operations across diverse markets.
Mr. Walsh joined Herbalife in 2004 and held several senior leadership roles, including senior vice president of worldwide member sales from 2004 to 2008, executive vice president of worldwide operations and sales from 2008 to 2010, and president from 2010 to 2018, where he led global business growth and all member-facing functions. He subsequently served as executive vice chairman from 2018 to 2022.
Prior to joining Herbalife, Mr. Walsh served as senior vice president of the commercial division at DMX Music and earlier as vice president at Buena Vista Home Entertainment, a division of The Walt Disney Company.
In addition to his corporate leadership, Mr. Walsh has been actively involved in philanthropic and nonprofit initiatives. He has served as chairman of the board of directors of the Herbalife Family Foundation since 2018, supporting programs focused on improving access to proper nutrition for children and communities. In 2020, he founded the Roadside Drug Test Innocence Alliance, an organization dedicated to advancing policy reforms related to roadside drug testing.
Mr. Walsh holds a Bachelor of Laws degree from the University of London and is admitted to the State Bar of California and the State Bar of Colorado.
facebook
twitter
instagram
youtube
© 2026 Herbalife Ltd.
All Rights Reserved.
Privacy Policy
CCPA
Terms of Use
Sitemap