Halliburton Company announced today net income attributable to company of $417 million, or $0.50 per diluted share, for the third quarter of 2026 Share article Click to copy URL Q3 2026 Earnings Release - view the complete report (pdf) Net income…
Halliburton Company announced today net income attributable to company of $417 million, or $0.50 per diluted share, for the third quarter of 2026
Share article
Q3 2026 Earnings Release - view the complete report (pdf)
- Net income of $0.50 per diluted share and adjusted net income per diluted share1 of $0.60.
- Revenue of $5.7 billion, operating margin of 10.9%, and adjusted operating margin2 of 12.8%.
- Cash flow from operations of $368 million and free cash flow3 of $156 million.
- Approximately $250 million of share repurchases.
HOUSTON - October 20, 2026 - Halliburton Company (NYSE: HAL) announced today net income attributable to company of $417 million, or $0.50 per diluted share, for the third quarter of 2026 and adjusted net income attributable to company4, excluding impairments and other charges and tax adjustments, of $501 million, or $0.60 per diluted share. This compares to net income attributable to company for the second quarter of 2026 of $534 million, or $0.64 per diluted share, and adjusted net income attributable to company, excluding impairments and other credits and tax adjustments, of $461 million, or $0.55 per diluted share.
Adjusted EBITDA5, which excludes impairments and other charges, was $1.0 billion in the third quarter of 2026, compared to adjusted EBITDA of $948 million in the second quarter of 2026.
Halliburton's total revenue for the third quarter of 2026 was $5.7 billion, flat when compared to total revenue in the second quarter of 2026. Operating income was $624 million in the third quarter of 2026, compared to operating income of $778 million in the second quarter of Adjusted operating income6 in the third quarter of 2026, excluding impairments and other charges, was $731 million, compared to adjusted operating income of $683 million in the second quarter of 2026.
“I am pleased with Halliburton's third quarter results. Our revenue exceeded our expectations, and we took important steps towards improving our margins.” commented Jeff Miller, Chairman, President and CEO.
“We are another three months into one of the largest energy disruptions in history. I expect the work to restore production, rebuild inventories and strengthen energy security will drive multi-year demand growth for oilfield services,
“Based on our early outlook for 2027, I expect mid-single digit revenue growth and operating margins of about 15%, an approximately 200 basis point improvement. This outlook assumes a flat North America market and does not require any recovery in North America hydraulic fracturing. To us, that recovery is purely upside,” concluded Miller.
Operating Segments
Completions and Production
Completion and Production revenue in the third quarter of 2026 was $3.1 billion, a decrease of $113 million, or 4% sequentially, while operating income was $457 million, a decrease of $17 million, or 4% sequentially. These decreases were primarily driven by lower stimulation activity in the Western Hemisphere and were partially offset by increased activity across multiple product service lines in the Middle East.
Drilling and Evaluation
Drilling and Evaluation revenue in the third quarter of 2026 was $2.6 billion, an increase of $102 million, or 4% sequentially, while operating income was $391 million, an increase of $53 million, or 16% sequentially. These increases were primarily driven by improved activity across multiple product service lines in the Middle East and Latin America, and increased drilling related services in the Western Hemisphere. Partially offsetting these increases was lower testing services internationally.
Geographic Regions
North America
North America revenue in the third quarter of 2026 was $2.2 billion, a decrease of 5% sequentially. This decrease was primarily driven by lower pressure pumping services in U.S. Land.
International
International revenue in the third quarter of 2026 was $3.5 billion, an increase of 3% sequentially.
Latin America revenue in the third quarter of 2026 was $1.1 billion, flat sequentially. These results were primarily driven by decreased stimulation activity in Argentina, offset by increased activity across multiple product service lines in Mexico.
Europe/Africa revenue in the third quarter of 2026 was $1.0 billion, flat sequentially. These results were primarily driven by decreased well construction activity in Namibia, offset by increased activity across multiple product service lines in Nigeria.
Middle East/Asia revenue in the third quarter of 2026 was $1.4 billion, an increase of 8% sequentially. These results were primarily driven by higher activity across multiple product service lines in Saudi Arabia and Kuwait.
Other Financial Items
During the third quarter of 2026, Halliburton:
- Repurchased approximately $250 million of its common stock.
- Paid dividends of $0.17 per share.
- Spent $42 million on SAP S4 migration.
- Recognized a pre-tax charge of $107 million related to impairments and other charges.
Selective Technology & Highlights
- Halliburton announced it secured an integrated well construction and completions contract from Eni
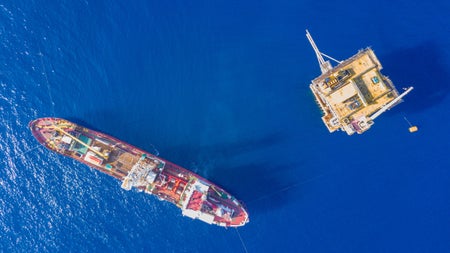
for the Cronos ultra-deepwater development in Block 6 of the Cyprus Exclusive Economic Zone. The award strengthens Halliburton's offshore portfolio in the Eastern Mediterranean and expands the company's role in the region's strategic natural gas development. Under the contract, Halliburton will deliver integrated drilling, well construction, automation, and completions services for exploration and development wells. The bundled scope reduces operational interfaces, improves execution certainty, and supports efficient delivery for a multiyear ultra-deepwater development.
- Halliburton announced it received an integrated contract by bp for the first appraisal campaign in the Bumerangue field
, offshore deepwater Brazil. The award includes a comprehensive suite of services to fast-track the appraisal campaign for bp's discovery. The contract includes an integrated package of drilling services to optimize reservoir evaluation and improve operational efficiency. The scope draws on Halliburton's drilling and evaluation portfolio to deliver an integrated execution model for the drilling appraisal program. Halliburton reduces operational complexity through consolidation of multiple services. LOGIX™ automation and remote operations will be deployed to improve execution efficiency and consistency.
- Halliburton announced the signing of memorandums of understanding with Eneva and WESCA
to support energy development opportunities in Venezuela and help customers advance projects in the country's oil and gas sector. With nearly nine decades of experience in Venezuela, Halliburton helps customers advance projects through strategically located bases in the country and by established operational capabilities and local expertise. Halliburton and Eneva, one of Brazil's leading integrated energy companies and the country's largest private natural gas operator, will collaborate to identify and pursue development opportunities in Venezuela. The agreement builds on the companies' existing relationship in Brazil.
- Halliburton announced the successful deployment of LOGIX™ automation and remote operations
on a deepwater exploration well with Eni offshore Indonesia. The operation marks a series of industry and regional firsts that advance closed loop drilling automation and demonstrate performance at scale in complex offshore environments.
- Halliburton has entered into a multiyear agreement with Pampa Energía
to support the digital transformation of its unconventional operations in Vaca Muerta, one of the world's most significant shale plays. As regional development accelerates, the agreement supports Pampa Energía's strategy to scale efficiently, strengthen decision-making, and deliver consistent execution within subsurface and operations teams.
- Halliburton was awarded a multiyear agreement by Kuwait Oil Company (KOC)
to support the development of the Ahmadi Innovation Valley, a flagship initiative that advances Kuwait's energy sector transformation. The research and development center will support KOC to deliver solutions in brownfield, greenfield, and unconventional fields, address higher operational complexity, and build technology designed for Kuwait's upstream challenges. The center embeds applied research as a permanent capability from concept through prototyping, piloting, and commercialization.
- Halliburton Labs announced the addition of three companies
to its collaborative ecosystem: Electroflow, Osmoses, and SiTration. The selected ventures develop breakthrough technologies that address critical challenges in battery materials, resource recovery, and gas separations. These companies confront the material and process bottlenecks that stand between today's energy system and tomorrow's opportunities. Halliburton Labs collaborates with early-stage, hard-tech ventures to scale innovative technologies through industry expertise, world-class facilities, and a global network of industrial and investment partners.
(1) Adjusted net income per diluted share is a non-GAAP financial measure which is calculated as: “Adjusted net income attributable to company” divided by “Diluted weighted average common shares outstanding.” Management believes adjusted net income per diluted share is useful to investors to assess and understand operating performance. See Reconciliation of Net Income Attributable to Company to Adjusted Net Income Attributable to Company in Footnote Table 2.
(2) Adjusted operating margin is a non-GAAP financial measure which is calculated by dividing “Adjusted operating income” by “Total revenue.” Management believes adjusted operating margin is useful to investors to assess and understand operating performance. See Reconciliation of Operating Income to Adjusted Operating Income in Footnote Table 1.
(3) Free cash flow is a non-GAAP financial measure which is calculated as “Total cash flows provided by operating activities” less “Capital expenditures” plus “Proceeds from sales of property, plant, and equipment.” Management believes that free cash flow is a key measure to assess liquidity of the business and is consistent with the disclosures of Halliburton's direct, largecap competitors. See Reconciliation of Cash Flows from Operating Activities to Free Cash Flow in Footnote Table 3.
(4) Adjusted net income attributable to company is a non-GAAP financial measure which is calculated as: “Net income attributable to company” plus “Total adjustments, net of taxes” for the respective periods. Management believes adjusted net income is useful to investors to assess and understand operating performance, especially when comparing those results with previous and subsequent periods or forecasting performance for future periods, primarily because management views the excluded items to be outside of the company's normal operating results. Management analyzes net income without the impact of these items as an indicator of performance to identify underlying trends in the business and to establish operational goals. Total adjustments remove the effect of these items. See Reconciliation of Net Income Attributable to Company to Adjusted Net Income Attributable to Company in Footnote Table 2.
(5) Adjusted EBITDA is a non-GAAP financial measure which is calculated as: “Net income,” before “Interest expense, net,” “Income tax provision,” “Depreciation, depletion, and amortization,” and excludes “Impairments and other charges (credits).” Management believes Adjusted EBITDA is a key measure to assess and understand operating performance and is consistent with the disclosures of Halliburton's direct, large-cap competitors. See EBITDA, Adjusted EBITDA, Related Margins, and Reconciliations schedule.
(6) Adjusted operating income is a non-GAAP financial measure which is calculated as: “Operating income” plus “Total impairments and other charges (credits)” for the respective periods. Management believes that operating income adjusted for impairments and other charges (credits) is useful to investors to assess and understand operating performance, especially when comparing those results with previous and subsequent periods or forecasting performance for future periods, primarily because management views the excluded items to be outside of the company's normal operating results. Management analyzes operating income without the impact of these items as an indicator of performance, to identify underlying trends in the business, and to establish operational goals. The adjustments remove the effect of these items. See Reconciliation of Operating Income to Adjusted Operating Income in Footnote Table 1.
About Halliburton
Halliburton is one of the world's leading providers of products and services to the energy industry. Founded in 1919, we create innovative technologies, products, and services that help our customers maximize their value throughout the life cycle of an asset and advance a sustainable energy future. Visit us at www.halliburton.com
; connect with us on LinkedIn
, YouTube
, Instagram
, and Facebook
.
Forward-looking Statements
The statements in this press release that are not historical statements are forward-looking statements within the meaning of the federal securities laws. These statements are subject to numerous risks and uncertainties, many of which are beyond the company's control, which could cause actual results to differ materially from the results expressed or implied by the statements. These risks and uncertainties include, but are not limited to: changes in the demand for or price of oil and/or natural gas, including as a result of development of alternative energy sources, general economic conditions such as inflation and recession, the ability of the OPEC+ countries to agree on and comply with production quotas, and other causes; changes in capital spending by our customers; the modification, continuation or suspension of our shareholder return framework, including the payment of dividends and purchases of our stock, which will be subject to the discretion of our Board of Directors and may depend on a variety of factors, including our results of operations and financial condition, growth plans, capital requirements and other conditions existing when any payment or purchase decision is made; potential catastrophic events related to our operations, and related indemnification and insurance; protection of intellectual property rights; cyber-attacks and data security; compliance with environmental laws; changes in government regulations and regulatory requirements, particularly those related to oil and natural gas exploration, the environment, radioactive sources, explosives, chemicals, hydraulic fracturing services, and climate-related initiatives; assumptions regarding the generation of future taxable income, and compliance with laws related to and disputes with taxing authorities regarding income taxes; risks of international operations, including risks relating to unsettled political conditions, war, including the current conflict in Iran, the effects of terrorism, foreign exchange rates and controls, international trade and regulatory controls, tariffs, and sanctions, and doing business with national oil companies; weather-related issues, including the effects of hurricanes and tropical storms; delays or failures by customers to make payments owed to us; infrastructure issues in the oil and natural gas industry; availability and cost of highly skilled labor and raw materials; completion of potential dispositions, and acquisitions, and integration and success of acquired businesses and joint ventures; risks related to the deployment of artificial intelligence. Halliburton's most recent Annual Report on Form 10-K, subsequent Quarterly Reports on Form 10-Q, Current Reports on Form 8-K and other filings with, or furnished to, the Securities and Exchange Commission discuss some of the important risk factors identified that may affect Halliburton's business, results of operations, and financial condition. Halliburton undertakes no obligation to revise or update publicly any forward-looking statements for any reason, except as required by law.
Conference Call Details
Halliburton Company (NYSE: HAL) will host a conference call on Tuesday, October 20, 2026, to discuss its third quarter 2026 financial results. The call will begin at 8:00 a.m. CT (9:00 a.m. ET).
Please visit the Halliburton website
to listen to the call via live webcast. A recorded version will be available for seven days under the same link immediately following the conclusion of the conference call. You can also pre-register for the conference call and obtain your dial in number and passcode by clicking here
.