Skip to main navigation Company Toggle submenu Leadership Core Values Inclusion Our Companies Our History Safety Sustainability Excellence Contact Us Construction Toggle submenu Transportation Water + Wastewater Specialty Federal Collaborative…
Skip to main navigation


Show Search Form
Search
Search
Search Arrow Icon
Search
Search
Search Arrow Icon

Granite Reports Second Quarter 2026 Results
Jul 30, 2026
- Raised 2026 revenue guidance by $100 million
- Q2 revenue increased 29% year-over-year to $1.5 billion
- Q2 net loss of $278 million compared to net income of $72 million for the same period in the prior year
- Q2 adjusted net income (1) of $101 million compared to $86 million for the same period in the prior year
- Q2 diluted EPS of $(6.36) compared to $1.42 for the same period in the prior year and adjusted diluted EPS (1) of $2.16 compared to $1.93 for the same period in the prior year
- Q2 adjusted EBITDA (1) increased 22% year-over-year to $186 million
- Committed and Awarded Projects (“CAP”) (2) increased sequentially $250 million to $7.4 billion
- Year-to-date Operating cash flow increased $136 million year-over-year to $142 million
WATSONVILLE, Calif.--(BUSINESS WIRE)--Granite (NYSE: GVA) today announced results for the quarter ended June 30, 2026.
Second Quarter 2026 Results
Net loss attributable to Granite totaled $278 million, or $(6.36) per diluted share, compared to net income attributable to Granite of $72 million, or $1.42 per diluted share, for the same period in the prior year. The net loss was driven by a $360 million non-operating loss on convertible debt transactions associated with our 3.75% convertible notes. As described in our June 2, 2026 Form 8-K, we elected to settle the conversions of the convertible notes primarily in cash in order to limit dilution to our stockholders. The related losses have been excluded from adjusted net income and adjusted EBITDA. Adjusted net income attributable to Granite totaled $101 million, or $2.16 per diluted share, compared to adjusted net income attributable to Granite of $86 million, or $1.93 per diluted share, for the same period in the prior year.
- Revenue increased $330 million to $1.46 billion compared to $1.13 billion for the same period in the prior year.
- Gross profit increased $40 million to $239 million compared to $199 million for the same period in the prior year.
- Selling, general, and administrative (“SG&A”) expenses increased $22 million to $108 million, or 7.4% of revenue, compared to $86 million, or 7.6% of revenue, for the same period in the prior year.
- Adjusted EBITDA increased $34 million to $186 million compared to $152 million for the same period in the prior year.
“We continued to execute against our strategy and deliver on our long-term financial objectives during the quarter,” said Kyle Larkin, Granite President and Chief Executive Officer. “Despite headwinds created by severe weather in the southeast, we generated strong organic revenue growth, increased adjusted EBITDA and operating cash flow, completed the acquisition of Kenny Seng Construction, and strengthened our capital structure by issuing senior notes and calling our 3.75% convertible notes for redemption.”
“We continue to believe public funding for highways, roads and bridges is likely to remain at high levels for the foreseeable future. In addition, we are confident in our ability to grow our business beyond traditional public infrastructure end markets. Over the last several years, we have been positioning Granite to expand our federal portfolio footprint, increase our participation in rail and transit projects, grow our presence in mission critical infrastructure including data center site development, and strengthen our vertically integrated Materials platform. Combined with our leading positions in many of the nation’s fastest growing markets, these initiatives provide Granite with multiple avenues to grow revenue, expand earnings, and create value independent of any single end market or funding source. As we look beyond 2027, our confidence is rooted not only in a supportive funding environment but also in our ability to grow through market diversification, customer expansion, strategic acquisitions, and disciplined execution. Our continued confidence in our ability to grow our business is based on the breadth of opportunities we see across our platform, the quality of the markets we serve, our ability to execute, and the strategic choices we have made over the last several years to build a more diversified, more vertically integrated and more resilient Granite.”
|
|
|
| (1) |
|
Adjusted net income, adjusted diluted earnings per share, earnings before interest, taxes, depreciation, and amortization (“EBITDA”), EBITDA margin, adjusted EBITDA, and adjusted EBITDA margin are non-GAAP measures. Please refer to the description and reconciliation of non-GAAP measures in the attached tables. |
| (2) |
|
CAP is comprised of revenue we expect to record in the future on executed contracts, including 100% of our consolidated joint venture contracts and our proportionate share of unconsolidated joint venture contracts, as well as the general construction portion of construction manager/general contractor, construction manager/at risk and progressive design build contracts to the extent contract execution and funding is probable. |
Six Months Ended June 30, 2026 Results
Net loss attributable to Granite totaled $320 million, or $(7.33) per diluted share, compared to net income attributable to Granite of $38 million, or $0.84 per diluted share, for the same period in the prior year. The net loss was driven by a $369 million non-operating loss on convertible debt transactions associated with our 3.75% convertible notes. Adjusted net income attributable to Granite totaled $113 million, or $2.41 per diluted share, compared to $87 million, or $1.94 per diluted share, for the same period in the prior year.
- Revenue increased $542 million to $2.37 billion compared to $1.83 billion for the same period in the prior year.
- Gross profit increased $66 million to $349 million compared to $283 million for the same period in the prior year.
- SG&A expenses increased $47 million to $249 million, or 10.5% of revenue, compared to $202 million, or 11.1% of revenue, for the same period in the prior year.
- Adjusted EBITDA increased $64 million to $244 million compared to $180 million for the same period in the prior year.
- Year-to-date operating cash flow increased to $142 million from $5 million for the same period in the prior year and we are raising our annual operating cash flow target from 10% to 11% of revenue.
Three and Six Months ended June 30, 2026 (Unaudited - dollars in thousands)
|
|
|
|
|
|
|
|
|
|
|
|
|
|
|
|
|
|
|
|
|
|
|
|
|
|
|
|
| Construction Segment |
|
|
|
|
|
|
|
|
|
|
|
|
|
|
|
|
|
|
|
|
|
|
|
|
|
|
|
|
Three Months Ended June 30, |
|
|
|
|
|
|
|
|
|
|
|
|
|
Six Months Ended June 30, |
|
|
|
|
|
|
|
|
|
|
|
|
|
|
2026 |
|
|
|
2025 |
|
|
Change |
|
|
|
|
|
|
2026 |
|
|
|
2025 |
|
|
Change |
|
|
|
|
| Revenue |
$ |
1,207,479 |
|
|
$ |
937,426 |
|
|
$ |
270,053 |
|
28.8 |
% |
|
$ |
1,973,533 |
|
|
$ |
1,552,044 |
|
|
$ |
421,489 |
|
27.2 |
% |
| Gross profit |
$ |
198,694 |
|
|
$ |
153,666 |
|
|
$ |
45,028 |
|
29.3 |
% |
|
$ |
300,874 |
|
|
$ |
239,104 |
|
|
$ |
61,770 |
|
25.8 |
% |
| Gross profit as a % of revenue |
|
16.5 |
% |
|
|
16.4 |
% |
|
|
|
|
|
|
|
|
15.2 |
% |
|
|
15.4 |
% |
|
|
|
|
|
|
Revenue for the three and six month periods increased year-over-year, driven by higher CAP entering the quarter and year along with $98 million and $142 million, respectively, from our recently acquired businesses, Warren Paving, Papich Construction, and Kenny Seng Construction. Gross profit and gross profit margin for the quarter increased year-over-year as a result of the increase in revenue and improved execution across our project portfolio. For the six month period, gross profit margin decreased year-over-year primarily due to a reduction in the favorable impact of claim settlements.
CAP increased $250 million sequentially to $7.4 billion, an increase of $1.4 billion year-over-year. As of June 30, 2026, CAP included $624 million of tactical infrastructure projects for U.S. Customs and Border Protection that should be substantially realized over 2026 and 2027.
|
|
|
|
|
|
|
|
|
|
|
|
|
|
|
|
|
|
|
|
|
|
|
|
|
|
|
|
|
| Materials Segment |
|
|
|
|
|
|
|
|
|
|
|
|
|
|
|
|
|
|
|
|
|
|
|
|
|
|
|
|
|
Three Months Ended June 30, |
|
|
|
|
|
|
|
|
|
|
|
|
|
|
Six Months Ended June 30, |
|
|
|
|
|
|
|
|
|
|
|
|
|
|
2026 |
|
|
|
2025 |
|
|
Change |
|
|
|
|
|
|
|
2026 |
|
|
|
2025 |
|
|
Change |
|
|
|
|
| Revenue |
$ |
248,393 |
|
|
$ |
188,538 |
|
|
$ |
59,855 |
|
|
31.7 |
% |
|
$ |
394,804 |
|
|
$ |
273,467 |
|
|
$ |
121,337 |
|
44.4 |
% |
| Gross profit |
$ |
40,077 |
|
|
$ |
45,433 |
|
|
$ |
(5,356 |
) |
|
(11.8 |
)% |
|
$ |
47,802 |
|
|
$ |
43,844 |
|
|
$ |
3,958 |
|
9.0 |
% |
| Gross profit as a % of revenue |
|
16.1 |
% |
|
|
24.1 |
% |
|
|
|
|
|
|
|
|
|
12.1 |
% |
|
|
16.0 |
% |
|
|
|
|
|
|
| Cash gross profit(1) |
$ |
70,166 |
|
|
$ |
59,001 |
|
|
$ |
11,165 |
|
|
18.9 |
% |
|
$ |
95,966 |
|
|
$ |
69,478 |
|
|
$ |
26,488 |
|
38.1 |
% |
| Cash gross profit as a % of revenue(1) |
|
28.2 |
% |
|
|
31.3 |
% |
|
|
|
|
|
|
|
|
|
24.3 |
% |
|
|
25.4 |
% |
|
|
|
|
|
|
|
|
|
| (1) |
|
Materials segment cash gross profit and cash gross profit as a percent of revenue are non-GAAP measures. Please refer to the description and reconciliation of non-GAAP measures in the attached tables. |
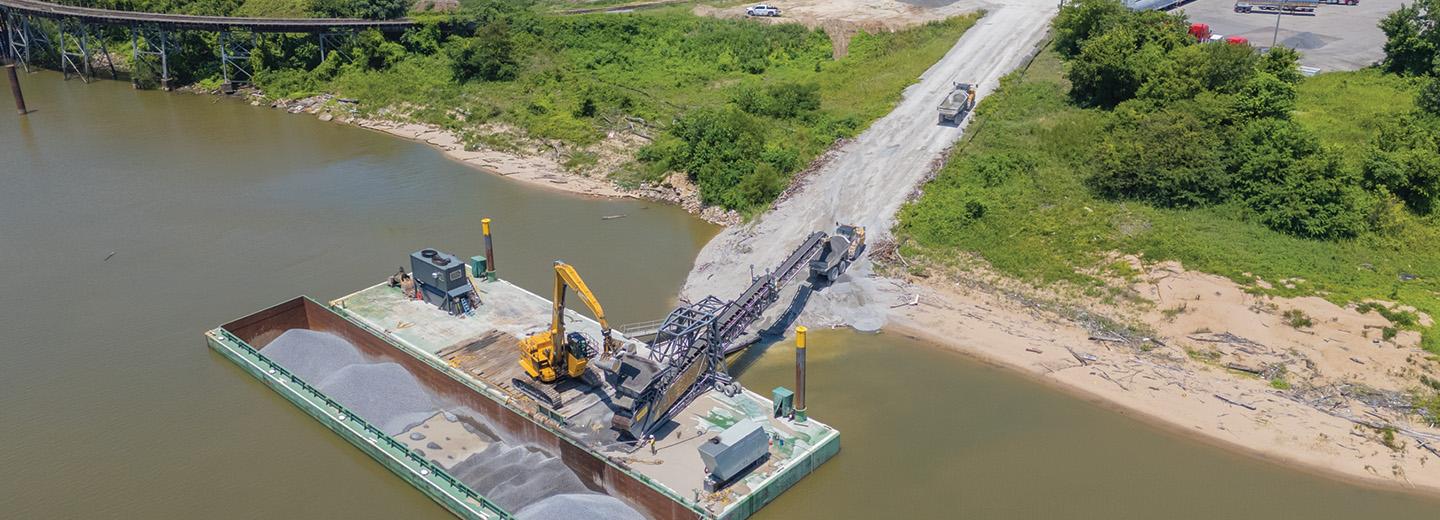
Revenue for the three and six month periods increased year-over-year primarily due to revenue from our recently acquired businesses, Warren Paving, Papich Construction, Cinderlite, and Kenny Seng Construction, of $60 million and $110 million, respectively. Gross profit margin and cash gross profit margin for the three and six month periods decreased year-over-year primarily due to the impact of severe weather in the southeast and higher production costs associated with quarry development activities in the current year.
Outlook
Our 2026 fiscal year guidance is unchanged with the exception of an increase in revenue as noted below:
- Revenue increased to a range of $5.3 billion to $5.5 billion from a range of $5.2 billion to $5.4 billion
- Adjusted EBITDA margin in a range of 12.25% to 13.25%
- SG&A expense as a percent of revenue in a range of 8.25% to 8.75% of revenue, inclusive of an estimated $48 million of stock-based compensation expense
- Effective tax rate for adjusted net income in the mid-20s
- Capital expenditures in a range of approximately $140 million to $160 million, including approximately $50 million in planned strategic materials investments.
“During the quarter, we delivered strong growth in both revenue and CAP,” said Executive Vice President and Chief Financial Officer, Staci Woolsey. “With our performance through the second quarter and opportunities ahead, we are raising our annual revenue guidance range by $100 million. Given the strength in both public and private infrastructure markets, we expect to deliver sustained elevated organic growth through the second half of 2026 and into 2027 and beyond.”
We do not provide a reconciliation of forward-looking adjusted EBITDA margin or the most directly comparable forward-looking GAAP measure of net income attributable to Granite because we cannot predict with a reasonable degree of certainty and without unreasonable efforts certain components or excluded items that are inherently uncertain and depend on various factors. For these reasons, we are unable to assess the potential significance of the unavailable information.
Conference Call
Granite will conduct a conference call today, July 30, 2026, at 8:00 a.m. Pacific Time/11:00 a.m. Eastern Time to discuss the results of the quarter ended June 30, 2026. The Company invites investors to listen to a live audio webcast of the investor conference call on its Investor Relations website, https://investor.graniteconstruction.com
. The investor conference call will also be available by calling 1-877-328-5503; international callers may dial 1-412-317-5472. An archive of the webcast will be available on Granite's Investor Relations website approximately one hour after the call. A replay will be available after the live call through August 6, 2026, by calling 1-855-669-9658, replay access code 5480546; international callers may dial 1-412-317-0088.
About Granite
Granite is America’s Infrastructure Company™. Incorporated since 1922, Granite (NYSE:GVA) is one of the largest diversified vertically-integrated civil contractors and construction materials producers in the United States. Granite’s Code of Conduct and strong Core Values guide the Company and its employees to uphold the highest ethical standards. Granite is an industry leader in safety and an award-winning firm in quality and sustainability. For more information, visit graniteconstruction.com
, and connect with Granite on LinkedIn
, X
, Facebook
and Instagram
.
Forward-looking Statements
Any statements contained in this news release that are not based on historical facts, including statements regarding future events, occurrences, opportunities, circumstances, activities, performance, growth, demand, strategic plans, shareholder value, outcomes, outlook, expectations for public funding for highways, roads and bridges, our ability to grow our business, our initiatives provide us with multiple avenues to grow revenue, expand earnings, and create value, our growth and the underlying assumptions, our operating cash flow target as a percent of revenue, our expectation that we will deliver sustained elevated organic growth through the second half of 2026 and into 2027 and beyond, 2026 fiscal year guidance, including revenue, adjusted EBITDA margin, SG&A expense, including estimated stock-based compensation expense, effective tax rate, capital expenditures, including estimated planned strategic materials investments, CAP and results constitute forward-looking statements within the meaning of the Private Securities Litigation Reform Act of 1995. These forward-looking statements are identified by words such as “future,” “outlook,” “assumes,” “believes,” “expects,” “estimates,” “anticipates,” “intends,” “plans,” “appears,” “may,” “will,” “should,” “could,” “would,” “continue,” "guidance" and the negatives thereof or other comparable terminology or by the context in which they are made. These forward-looking statements are based on management’s current beliefs, assumptions and estimates. These expectations may or may not be realized. Some of these expectations may be based on beliefs, assumptions or estimates that may prove to be incorrect. In addition, our business and operations involve numerous risks and uncertainties, many of which are beyond our control, which could result in our expectations not being realized or otherwise materially affect our business, financial condition, results of operations, cash flows and liquidity. Such risks and uncertainties include, but are not limited to, those described in greater detail in our filings with the Securities and Exchange Commission, particularly those described in our Annual Report on Form 10-K and Quarterly Reports on Form 10-Q.
Due to the inherent risks and uncertainties associated with our forward-looking statements, the reader is cautioned not to place undue reliance on them. The reader is also cautioned that the forward-looking statements contained herein speak only as of the date of this news release and, except as required by law; we undertake no obligation to revise or update any forward-looking statements for any reason.
|
|
|
|
|
|
|
|
| GRANITE CONSTRUCTION INCORPORATED |
|
|
|
|
|
|
|
| CONDENSED CONSOLIDATED BALANCE SHEETS |
|
|
|
|
|
|
|
| (Unaudited - in thousands, except share and per share data) |
|
|
|
|
|
|
|
|
|
|
|
|
|
|
|
|
June 30, 2026 |
|
|
|
December 31, 2025 |
|
|
| ASSETS |
|
|
|
|
|
|
|
| Current assets: |
|
|
|
|
|
|
|
| Cash and cash equivalents |
$ |
877,121 |
|
|
$ |
529,220 |
|
| Short-term marketable securities |
|
36,852 |
|
|
|
71,021 |
|
| Receivables, net |
|
886,793 |
|
|
|
630,392 |
|
| Contract assets |
|
283,191 |
|
|
|
236,879 |
|
| Inventories |
|
182,116 |
|
|
|
143,129 |
|
| Equity in unconsolidated construction joint ventures |
|
131,096 |
|
|
|
134,670 |
|
| Other current assets |
|
52,979 |
|
|
|
66,920 |
|
| Total current assets |
|
2,450,148 |
|
|
|
1,812,231 |
|
| Property and equipment, net |
|
1,304,105 |
|
|
|
1,260,823 |
|
| Long-term marketable securities |
|
17,550 |
|
|
|
49,534 |
|
| Investments in affiliates |
|
102,424 |
|
|
|
96,764 |
|
| Goodwill |
|
445,984 |
|
|
|
400,814 |
|
| Intangible assets, net |
|
211,812 |
|
|
|
179,548 |
|
| Right of use assets |
|
167,074 |
|
|
|
152,678 |
|
| Other noncurrent assets |
|
79,779 |
|
|
|
78,001 |
|
| Total assets |
$ |
4,778,876 |
|
|
$ |
4,030,393 |
|
|
|
|
|
|
|
|
|
| LIABILITIES AND EQUITY |
|
|
|
|
|
|
|
| Current liabilities: |
|
|
|
|
|
|
|
| Current maturities of long-term debt |
$ |
381,008 |
|
|
$ |
375,896 |
|
| Accounts payable |
|
607,814 |
|
|
|
430,298 |
|
| Contract liabilities |
|
440,364 |
|
|
|
327,372 |
|
| Embedded conversion option derivative liability |
|
630,473 |
|
|
|
— |
|
| Accrued expenses and other current liabilities |
|
359,219 |
|
|
|
348,179 |
|
| Total current liabilities |
|
2,418,878 |
|
|
|
1,481,745 |
|
| Long-term debt |
|
1,177,644 |
|
|
|
963,233 |
|
| Long-term lease liabilities |
|
137,747 |
|
|
|
125,733 |
|
| Deferred income taxes, net |
|
143,955 |
|
|
|
141,489 |
|
| Other long-term liabilities |
|
95,316 |
|
|
|
96,660 |
|
| Commitments and contingencies |
|
|
|
|
|
|
|
| Equity: |
|
|
|
|
|
|
|
| Preferred stock, $0.01 par value, authorized 3,000,000 shares, none outstanding |
|
— |
|
|
|
— |
|
| Common stock, $0.01 par value, authorized 150,000,000 shares; issued and outstanding: 43,764,125 shares as of June 30, 2026 and 43,496,781 shares as of December 31, 2025 |
|
438 |
|
|
|
435 |
|
| Additional paid-in capital |
|
304,470 |
|
|
|
402,391 |
|
| Accumulated other comprehensive income |
|
4,568 |
|
|
|
1,581 |
|
| Retained earnings |
|
443,272 |
|
|
|
774,641 |
|
| Total Granite shareholders’ equity |
|
752,748 |
|
|
|
1,179,048 |
|
| Non-controlling interests |
|
52,588 |
|
|
|
42,485 |
|
| Total equity |
|
805,336 |
|
|
|
1,221,533 |
|
| Total liabilities and equity |
$ |
4,778,876 |
|
|
$ |
4,030,393 |
|
|
|
|
|
|
|
|
|
|
|
|
|
|
|
|
|
| GRANITE CONSTRUCTION INCORPORATED |
|
|
|
|
|
|
|
|
|
|
|
|
|
|
|
| CONDENSED CONSOLIDATED STATEMENTS OF OPERATIONS |
|
|
|
|
|
|
|
|
|
|
|
|
|
|
|
| (Unaudited - in thousands, except per share data) |
|
|
|
|
|
|
|
|
|
|
|
|
|
|
|
|
|
|
|
|
|
|
|
|
|
|
|
|
|
|
|
|
Three Months Ended June 30, |
|
|
|
|
|
|
|
Six Months Ended June 30, |
|
|
|
|
|
|
|
|
2026 |
|
|
|
2025 |
|
|
|
2026 |
|
|
|
2025 |
|
| Revenue |
$ |
1,455,872 |
|
|
$ |
1,125,964 |
|
|
$ |
2,368,337 |
|
|
$ |
1,825,511 |
|
| Cost of revenue |
|
1,217,101 |
|
|
|
926,865 |
|
|
|
2,019,661 |
|
|
|
1,542,563 |
|
| Gross profit |
|
238,771 |
|
|
|
199,099 |
|
|
|
348,676 |
|
|
|
282,948 |
|
| Selling, general and administrative expenses |
|
107,794 |
|
|
|
85,887 |
|
|
|
248,744 |
|
|
|
201,798 |
|
| Other costs, net |
|
5,406 |
|
|
|
13,253 |
|
|
|
8,443 |
|
|
|
22,679 |
|
| Gain on sales of property and equipment, net |
|
(1,237 |
) |
|
|
(3,606 |
) |
|
|
(4,186 |
) |
|
|
(5,343 |
) |
| Operating income |
|
126,808 |
|
|
|
103,565 |
|
|
|
95,675 |
|
|
|
63,814 |
|
| Other (income) expense: |
|
|
|
|
|
|
|
|
|
|
|
|
|
|
|
| Loss on convertible debt transactions, net |
|
359,719 |
|
|
|
— |
|
|
|
369,423 |
|
|
|
— |
|
| Interest income |
|
(5,147 |
) |
|
|
(5,761 |
) |
|
|
(10,996 |
) |
|
|
(12,029 |
) |
| Interest expense(1) |
|
21,761 |
|
|
|
7,927 |
|
|
|
38,093 |
|
|
|
15,684 |
|
| Equity in income of affiliates, net |
|
(5,697 |
) |
|
|
(3,698 |
) |
|
|
(9,170 |
) |
|
|
(4,792 |
) |
| Other income, net |
|
(4,492 |
) |
|
|
(2,462 |
) |
|
|
(3,831 |
) |
|
|
(2,525 |
) |
| Total other (income) expense, net |
|
366,144 |
|
|
|
(3,994 |
) |
|
|
383,519 |
|
|
|
(3,662 |
) |
| Income (loss) before income taxes |
|
(239,336 |
) |
|
|
107,559 |
|
|
|
(287,844 |
) |
|
|
67,476 |
|
| Provision for income taxes |
|
32,248 |
|
|
|
27,214 |
|
|
|
20,129 |
|
|
|
15,458 |
|
| Net income (loss) |
|
(271,584 |
) |
|
|
80,345 |
|
|
|
(307,973 |
) |
|
|
52,018 |
|
| Amount attributable to non-controlling interests |
|
(6,578 |
) |
|
|
(8,645 |
) |
|
|
(11,888 |
) |
|
|
(13,974 |
) |
| Net income (loss) attributable to Granite |
$ |
(278,162 |
) |
|
$ |
71,700 |
|
|
$ |
(319,861 |
) |
|
$ |
38,044 |
|
|
|
|
|
|
|
|
|
|
|
|
|
|
|
|
|
| Net income (loss) per share attributable to common shareholders: |
|
|
|
|
|
|
|
|
|
|
|
|
|
|
|
| Basic |
$ |
(6.36 |
) |
|
$ |
1.64 |
|
|
$ |
(7.33 |
) |
|
$ |
0.87 |
|
| Diluted |
$ |
(6.36 |
) |
|
$ |
1.42 |
|
|
$ |
(7.33 |
) |
|
$ |
0.84 |
|
| Weighted average shares outstanding: |
|
|
|
|
|
|
|
|
|
|
|
|
|
|
|
| Basic |
|
43,751 |
|
|
|
43,746 |
|
|
|
43,641 |
|
|
|
43,605 |
|
| Diluted |
|
43,751 |
|
|
|
52,755 |
|
|
|
43,641 |
|
|
|
52,616 |
|
|
|
|
| (1) |
|
Interest expense includes $3.5 million related to the amortization of convertible debt discount associated with the 3.75% convertible notes during the three and six months ended June 30, 2026. |
|
|
|
|
|
|
|
|
| GRANITE CONSTRUCTION INCORPORATED |
|
|
|
|
|
|
|
| CONDENSED CONSOLIDATED STATEMENTS OF CASH FLOWS |
|
|
|
|
|
|
|
| (Unaudited - in thousands) |
|
|
|
|
|
|
|
|
|
|
|
|
|
|
|
| Six Months Ended June 30, |
|
2026 |
|
|
|
2025 |
|
| Operating activities: |
|
|
|
|
|
|
|
| Net income (loss) |
$ |
(307,973 |
) |
|
$ |
52,018 |
|
| Adjustments to reconcile net income (loss) to net cash provided by operating activities: |
|
|
|
|
|
|
|
| Depreciation, depletion and amortization |
|
89,048 |
|
|
|
65,368 |
|
| Amortization of debt issuance costs |
|
3,344 |
|
|
|
2,163 |
|
| Amortization of convertible debt discount |
|
3,511 |
|
|
|
— |
|
| Loss on derivative remeasurement related to convertible notes |
|
363,530 |
|
|
|
— |
|
| Convertible debt inducement expense |
|
2,900 |
|
|
|
— |
|
| Gain on sales of property and equipment, net |
|
(4,186 |
) |
|
|
(5,343 |
) |
| Stock-based compensation |
|
43,860 |
|
|
|
34,632 |
|
| Equity in net income from unconsolidated construction joint ventures |
|
(13,096 |
) |
|
|
(3,814 |
) |
| Net income from affiliates |
|
(9,170 |
) |
|
|
(4,792 |
) |
| Other non-cash adjustments |
|
2,782 |
|
|
|
(207 |
) |
| Changes in assets and liabilities |
|
(33,006 |
) |
|
|
(134,587 |
) |
| Net cash provided by operating activities |
$ |
141,544 |
|
|
$ |
5,438 |
|
| Investing activities: |
|
|
|
|
|
|
|
| Purchases of marketable securities |
|
— |
|
|
|
(172,578 |
) |
| Maturities of marketable securities |
|
66,500 |
|
|
|
17,600 |
|
| Purchases of property and equipment |
|
(55,868 |
) |
|
|
(61,022 |
) |
| Proceeds from sales of property and equipment |
|
11,041 |
|
|
|
8,346 |
|
| Acquisition of business, net of cash acquired |
|
(162,098 |
) |
|
|
— |
|
| Collection of note receivable |
|
24,960 |
|
|
|
— |
|
| Other investing activities |
|
1,037 |
|
|
|
399 |
|
| Net cash used in investing activities |
$ |
(114,428 |
) |
|
$ |
(207,255 |
) |
| Financing activities: |
|
|
|
|
|
|
|
| Proceeds from long-term debt |
|
770,000 |
|
|
|
— |
|
| Debt repayments |
|
(465,293 |
) |
|
|
(552 |
) |
| Proceeds from partial unwind of capped call |
|
56,675 |
|
|
|
— |
|
| Debt issuance costs |
|
(9,220 |
) |
|
|
— |
|
| Cash dividends paid |
|
(11,342 |
) |
|
|
(11,338 |
) |
| Repurchases of common stock |
|
(18,669 |
) |
|
|
(15,317 |
) |
| Contributions from non-controlling partners |
|
2,400 |
|
|
|
— |
|
| Distributions to non-controlling partners |
|
(4,185 |
) |
|
|
(27,250 |
) |
| Other financing activities, net |
|
419 |
|
|
|
(39 |
) |
| Net cash provided by (used in) financing activities |
$ |
320,785 |
|
|
$ |
(54,496 |
) |
| Net increase (decrease) in cash and cash equivalents |
|
347,901 |
|
|
|
(256,313 |
) |
| Cash and cash equivalents at beginning of period |
|
529,220 |
|
|
|
578,330 |
|
| Cash and cash equivalents at end of period |
$ |
877,121 |
|
|
$ |
322,017 |
|
Non-GAAP Financial Information
The tables below contain financial information calculated other than in accordance with U.S. generally accepted accounting principles (“GAAP”). Specifically, we believe that non-GAAP financial measures such as EBITDA and EBITDA margin are useful in evaluating operating performance and are regularly used by securities analysts, institutional investors and other interested parties, and that such supplemental measures facilitate comparisons between companies that have different capital and financing structures and/or tax rates.
We are also providing adjusted EBITDA and adjusted EBITDA margin, non-GAAP measures, to indicate the impact of stock-based compensation, loss on convertible debt transactions, net and other costs, net, which includes strategic acquisition and integration expenses, and in 2025 legal fees for the defense of a former company officer in his now resolved civil litigation with the Securities and Exchange Commission and reorganization costs.
We provide adjusted income before income taxes, adjusted provision for income taxes, adjusted net income attributable to Granite, adjusted diluted weighted average shares of common stock and adjusted diluted earnings per share attributable to common shareholders, non-GAAP measures, to indicate the impact of the following:
- Acquired intangible asset amortization and acquisition-related depreciation;
- Stock-based compensation;
- Loss on convertible debt transactions, net;
- Amortization of convertible debt discount; and
- Other costs, net as described above.
We also provide cash gross profit and cash gross profit per ton for the materials segment and product lines to exclude the impact of non-cash costs from gross profit. Non-cash costs include depreciation, depletion and amortization, and, starting in the first quarter of 2026, unrealized gains and losses from the change in fair value of commodity derivative instruments included in cost of revenue. Cash gross profit and cash gross profit per ton are presented to illustrate the operational performance generated by the assets of the materials segment and its product lines. In addition, we exclude barge delivery revenue from our calculation of average selling price per ton to improve comparability with prior periods. The acquisition of Warren Paving introduced barge delivery revenue starting in the third quarter of 2025.
We believe that these additional non-GAAP financial measures are useful in evaluating operating performance, are regularly used by securities analysts, institutional investors and other interested parties, and facilitate comparisons to prior periods and between industry peer companies. Additionally, we use these non-GAAP financial measures in evaluating our performance. However, the reader is cautioned that any non-GAAP financial measures provided by us are provided in addition to, and not as alternatives for, our reported results prepared in accordance with GAAP. Items that may have a significant impact on our financial position, results of operations and cash flows must be considered when assessing our actual financial condition and performance regardless of whether these items are included in non-GAAP financial measures. The methods used by us to calculate non-GAAP financial measures may differ significantly from methods used by other companies to compute similar measures. As a result, any non-GAAP financial measures provided by us may not be comparable to similar measures provided by other companies.
|
|
|
|
|
|
|
|
|
|
|
|
|
|
|
|
| GRANITE CONSTRUCTION INCORPORATED |
|
|
|
|
|
|
|
|
|
|
|
|
|
|
|
| EBITDA AND ADJUSTED EBITDA(1) |
|
|
|
|
|
|
|
|
|
|
|
|
|
|
|
| (Unaudited - dollars in thousands) |
|
|
|
|
|
|
|
|
|
|
|
|
|
|
|
|
|
|
|
|
|
|
|
|
|
|
|
|
|
|
|
|
Three Months Ended June 30, |
|
|
|
|
|
|
|
Six Months Ended June 30, |
|
|
|
|
|
|
|
|
2026 |
|
|
|
2025 |
|
|
|
2026 |
|
|
|
2025 |
|
| EBITDA: |
|
|
|
|
|
|
|
|
|
|
|
|
|
|
|
| Net income (loss) attributable to Granite |
$ |
(278,162 |
) |
|
$ |
71,700 |
|
|
$ |
(319,861 |
) |
|
$ |
38,044 |
|
| Net income (loss) margin(2) |
|
(19.1 |
)% |
|
|
6.4 |
% |
|
|
(13.5 |
)% |
|
|
2.1 |
% |
|
|
|
|
|
|
|
|
|
|
|
|
|
|
|
|
| Depreciation, depletion and amortization expense(3) |
|
47,434 |
|
|
|
35,678 |
|
|
|
90,001 |
|
|
|
66,030 |
|
| Provision for income taxes |
|
32,248 |
|
|
|
27,214 |
|
|
|
20,129 |
|
|
|
15,458 |
|
| Interest expense, net |
|
16,614 |
|
|
|
2,166 |
|
|
|
27,097 |
|
|
|
3,655 |
|
| EBITDA(1) |
$ |
(181,866 |
) |
|
$ |
136,758 |
|
|
$ |
(182,634 |
) |
|
$ |
123,187 |
|
| EBITDA margin(1)(2) |
|
(12.5 |
)% |
|
|
12.1 |
% |
|
|
(7.7 |
)% |
|
|
6.7 |
% |
|
|
|
|
|
|
|
|
|
|
|
|
|
|
|
|
| ADJUSTED EBITDA: |
|
|
|
|
|
|
|
|
|
|
|
|
|
|
|
| Stock-based compensation |
|
2,674 |
|
|
|
2,415 |
|
|
|
48,271 |
|
|
|
34,632 |
|
| Loss on convertible debt transactions, net |
|
359,719 |
|
|
|
— |
|
|
|
369,423 |
|
|
|
— |
|
| Other costs, net |
|
5,406 |
|
|
|
13,253 |
|
|
|
8,443 |
|
|
|
22,679 |
|
| Adjusted EBITDA(1) |
$ |
185,933 |
|
|
$ |
152,426 |
|
|
$ |
243,503 |
|
|
$ |
180,498 |
|
| Adjusted EBITDA margin(1)(2) |
|
12.8 |
% |
|
|
13.5 |
% |
|
|
10.3 |
% |
|
|
9.9 |
% |
|
|
|
| (1) |
|
We define EBITDA as GAAP net income/loss attributable to Granite, adjusted for net interest expense, taxes, depreciation, depletion and amortization. Adjusted EBITDA and adjusted EBITDA margin exclude the impact of stock-based compensation, loss on convertible debt transactions, net and other costs, net as described above. |
| (2) |
|
Represents net income/loss, EBITDA and adjusted EBITDA divided by consolidated revenue of $1.46 billion and $1.13 billion for the three months ended June 30, 2026 and 2025, respectively, and $2.37 billion and $1.83 billion for the six months ended June 30, 2026 and 2025, respectively. |
| (3) |
|
Amount includes the sum of depreciation, depletion and amortization which are classified as cost of revenue and selling, general and administrative expenses in the condensed consolidated statements of operations. |
|
|
|
|
|
|
|
|
|
|
|
|
|
|
|
|
| GRANITE CONSTRUCTION INCORPORATED |
|
|
|
|
|
|
|
|
|
|
|
|
|
|
|
| ADJUSTED NET INCOME RECONCILIATION |
|
|
|
|
|
|
|
|
|
|
|
|
|
|
|
| (Unaudited - in thousands, except per share data) |
|
|
|
|
|
|
|
|
|
|
|
|
|
|
|
|
|
|
|
|
|
|
|
|
|
|
|
|
|
|
|
|
Three Months Ended June 30, |
|
|
|
|
|
|
|
Six Months Ended June 30, |
|
|
|
|
|
|
|
|
2026 |
|
|
|
2025 |
|
|
|
2026 |
|
|
|
2025 |
|
| Income (loss) before income taxes |
$ |
(239,336 |
) |
|
$ |
107,559 |
|
|
$ |
(287,844 |
) |
|
$ |
67,476 |
|
| Acquired intangible asset amortization and acquisition-related depreciation |
|
13,834 |
|
|
|
3,992 |
|
|
|
24,391 |
|
|
|
7,979 |
|
| Stock-based compensation |
|
2,674 |
|
|
|
2,415 |
|
|
|
48,271 |
|
|
|
34,632 |
|
| Loss on convertible debt transactions, net |
|
359,719 |
|
|
|
— |
|
|
|
369,423 |
|
|
|
— |
|
| Amortization of convertible debt discount |
|
3,511 |
|
|
|
— |
|
|
|
3,511 |
|
|
|
— |
|
| Other costs, net |
|
5,406 |
|
|
|
13,253 |
|
|
|
8,443 |
|
|
|
22,679 |
|
| Adjusted income before income taxes |
$ |
145,808 |
|
|
$ |
127,219 |
|
|
$ |
166,195 |
|
|
$ |
132,766 |
|
|
|
|
|
|
|
|
|
|
|
|
|
|
|
|
|
| Provision for income taxes |
$ |
32,248 |
|
|
$ |
27,214 |
|
|
$ |
20,129 |
|
|
$ |
15,458 |
|
| Tax effect of adjusting items(1) |
|
5,643 |
|
|
|
5,062 |
|
|
|
20,885 |
|
|
|
16,812 |
|
| Adjusted provision for income taxes |
$ |
37,891 |
|
|
$ |
32,276 |
|
|
$ |
41,014 |
|
|
$ |
32,270 |
|
|
|
|
|
|
|
|
|
|
|
|
|
|
|
|
|
| Net income (loss) attributable to Granite |
$ |
(278,162 |
) |
|
$ |
71,700 |
|
|
$ |
(319,861 |
) |
|
$ |
38,044 |
|
| After-tax adjusting items |
|
379,501 |
|
|
|
14,598 |
|
|
|
433,154 |
|
|
|
48,478 |
|
| Adjusted net income attributable to Granite |
$ |
101,339 |
|
|
$ |
86,298 |
|
|
$ |
113,293 |
|
|
$ |
86,522 |
|
|
|
|
|
|
|
|
|
|
|
|
|
|
|
|
|
| Diluted weighted average shares of common stock |
|
43,751 |
|
|
|
52,755 |
|
|
|
43,641 |
|
|
|
52,616 |
|
| Add: dilutive effect of restricted stock units and Convertible Notes |
|
8,471 |
|
|
|
— |
|
|
|
9,214 |
|
|
|
— |
|
| Less: dilutive effect of Convertible Notes(2) |
|
(5,293 |
) |
|
|
(8,040 |
) |
|
|
(5,924 |
) |
|
|
(8,055 |
) |
| Adjusted diluted weighted average shares of common stock |
|
46,929 |
|
|
|
44,715 |
|
|
|
46,931 |
|
|
|
44,561 |
|
|
|
|
|
|
|
|
|
|
|
|
|
|
|
|
|
| Diluted net income (loss) per share attributable to common shareholders |
$ |
(6.36 |
) |
|
$ |
1.42 |
|
|
$ |
(7.33 |
) |
|
$ |
0.84 |
|
| After-tax adjusting items per share attributable to common shareholders |
|
8.52 |
|
|
|
0.51 |
|
|
|
9.74 |
|
|
|
1.10 |
|
| Adjusted diluted earnings per share attributable to common shareholders |
$ |
2.16 |
|
|
$ |
1.93 |
|
|
$ |
2.41 |
|
|
$ |
1.94 |
|
|
|
|
| (1) |
|
The tax effect of adjusting items was calculated using our estimated annual statutory tax rate. The tax effect of adjusting items for the three and six months ended June 30, 2026 excludes the loss on convertible debt transactions, net and amortization of convertible debt discount as they were non-tax deductible. |
| (2) |
|
When calculating diluted net income attributable to common shareholders, GAAP requires that we include potential share dilution from the convertible notes when not antidilutive. We entered into capped call transactions relating to both the 3.25% and 3.75% convertible notes to offset the dilutive impact of the convertible notes. The impact of the capped call transactions was excluded from the GAAP diluted net income attributable to common shareholders calculation as the impact would be antidilutive. For the purpose of calculating our adjusted diluted net income per share attributable to common shareholders, the dilutive effect of the convertible notes up to the capped call price is removed to reflect the impact of the capped call transactions. |
|
|
|
|
|
|
|
|
|
|
|
|
|
|
|
|
| GRANITE CONSTRUCTION INCORPORATED |
|
|
|
|
|
|
|
|
|
|
|
|
|
|
|
| MATERIALS SEGMENT PRODUCT LINE INFORMATION |
|
|
|
|
|
|
|
|
|
|
|
|
|
|
|
| (Unaudited - in thousands, except per ton data) |
|
|
|
|
|
|
|
|
|
|
|
|
|
|
|
|
|
|
|
|
|
|
|
|
|
|
|
|
|
|
|
|
Materials Product Line(1) |
|
|
|
|
|
|
|
|
|
|
|
Total Materials Segment |
|
|
| Three Months Ended June 30, 2026 |
Aggregate |
|
|
|
Asphalt |
|
|
|
Other and Eliminations(2) |
|
|
|
|
|
|
| External revenue |
$ |
115,763 |
|
|
$ |
131,864 |
|
|
$ |
766 |
|
|
$ |
248,393 |
|
| Internal revenue(3) |
|
55,637 |
|
|
|
98,976 |
|
|
|
(154,613 |
) |
|
$ |
— |
|
| Total Revenue |
$ |
171,400 |
|
|
$ |
230,840 |
|
|
$ |
(153,847 |
) |
|
$ |
248,393 |
|
|
|
|
|
|
|
|
|
|
|
|
|
|
|
|
|
| Sales tons |
|
7,997 |
|
|
|
2,576 |
|
|
|
|
|
|
|
|
|
| Average selling price per ton(4) |
$ |
19.88 |
|
|
$ |
89.61 |
|
|
|
|
|
|
|
|
|
|
|
|
|
|
|
|
|
|
|
|
|
|
|
|
|
| Gross profit |
$ |
24,995 |
|
|
|
34,647 |
|
|
$ |
(19,565 |
) |
|
$ |
40,077 |
|
| Gross profit as a % of revenue |
|
14.6 |
% |
|
|
15.0 |
% |
|
|
NM |
|
|
|
16.1 |
% |
| Gross profit per ton |
$ |
3.13 |
|
|
$ |
13.45 |
|
|
|
|
|
|
|
|
|
| Non-cash costs(5) |
$ |
23,554 |
|
|
$ |
4,453 |
|
|
$ |
2,082 |
|
|
$ |
30,089 |
|
| Cash gross profit |
$ |
48,549 |
|
|
$ |
39,100 |
|
|
$ |
(17,483 |
) |
|
$ |
70,166 |
|
| Cash gross profit as a % of revenue |
|
28.3 |
% |
|
|
16.9 |
% |
|
|
NM |
|
|
|
28.2 |
% |
| Cash gross profit per ton |
$ |
6.07 |
|
|
$ |
15.18 |
|
|
|
|
|
|
|
|
|
|
|
|
|
|
|
|
|
|
|
|
|
|
|
|
|
|
Materials Product Line(1) |
|
|
|
|
|
|
|
|
|
|
|
Total Materials Segment |
|
|
| Three Months Ended June 30, 2025 |
Aggregate |
|
|
|
Asphalt |
|
|
|
Other and Eliminations(2) |
|
|
|
|
|
|
| External revenue |
$ |
59,643 |
|
|
$ |
128,625 |
|
|
$ |
270 |
|
|
$ |
188,538 |
|
| Internal revenue(3) |
|
45,901 |
|
|
|
57,337 |
|
|
|
(103,238 |
) |
|
$ |
— |
|
| Total Revenue |
$ |
105,544 |
|
|
$ |
185,962 |
|
|
$ |
(102,968 |
) |
|
$ |
188,538 |
|
|
|
|
|
|
|
|
|
|
|
|
|
|
|
|
|
| Sales tons |
|
6,299 |
|
|
|
2,329 |
|
|
|
|
|
|
|
|
|
| Average selling price per ton(4) |
$ |
16.76 |
|
|
$ |
79.85 |
|
|
|
|
|
|
|
|
|
|
|
|
|
|
|
|
|
|
|
|
|
|
|
|
|
| Gross profit |
$ |
24,869 |
|
|
|
29,770 |
|
|
$ |
(9,206 |
) |
|
$ |
45,433 |
|
| Gross profit as a % of revenue |
|
23.6 |
% |
|
|
16.0 |
% |
|
|
NM |
|
|
|
24.1 |
% |
| Gross profit per ton |
$ |
3.95 |
|
|
$ |
12.78 |
|
|
|
|
|
|
|
|
|
| Non-cash costs(5) |
$ |
9,430 |
|
|
$ |
4,060 |
|
|
$ |
78 |
|
|
$ |
13,568 |
|
| Cash gross profit |
$ |
34,299 |
|
|
$ |
33,830 |
|
|
$ |
(9,128 |
) |
|
$ |
59,001 |
|
| Cash gross profit as a % of revenue |
|
32.5 |
% |
|
|
18.2 |
% |
|
|
NM |
|
|
|
31.3 |
% |
| Cash gross profit per ton |
$ |
5.45 |
|
|
$ |
14.53 |
|
|
|
|
|
|
|
|
|
|
|
|
| NM - not meaningful |
|
|
| (1) |
|
The Aggregate product line includes aggregates, barge delivery and recycled materials. The Asphalt product line includes asphalt concrete and liquid asphalt. External revenue includes freight and delivery costs that we pass along to our customers. |
| (2) |
|
Represents our other product line which is comprised of immaterial amounts of products and services that are not considered core product lines, as well as eliminations of interproduct and intersegment transactions and unrealized gains and losses on commodity derivatives. |
| (3) |
|
Includes both intersegment and interproduct revenues. Intersegment revenues for the three months ended June 30, 2026 and June 30, 2025 were $116.5 million and $63.3 million, respectively. |
| (4) |
|
Aggregate average selling price per ton for the three months ended June 30, 2026 was calculated by dividing total aggregate revenue of $171.4 million, less $12.4 million of revenues associated with barge delivery, or $159.0 million, by sales tons for the period. There was no adjustment in the three months ended June 30, 2025. |
| (5) |
|
Non-cash costs include depreciation, depletion and amortization, and, starting in the first quarter of 2026, unrealized gains and losses from the change in fair value of commodity derivative instruments included in cost of revenue. Unrealized gains and losses on commodity derivatives were immaterial in prior periods, and therefore cash gross profit for 2025 is unchanged from what was previously presented. |
|
|
|
|
|
|
|
|
|
|
|
|
|
|
|
|
|
Materials Product Line(1) |
|
|
|
|
|
|
|
|
|
|
|
Total Materials Segment |
|
|
| Six Months Ended June 30, 2026 |
Aggregate |
|
|
|
Asphalt |
|
|
|
Other and Eliminations(2) |
|
|
|
|
|
|
| External revenue |
$ |
206,736 |
|
|
$ |
187,302 |
|
|
$ |
766 |
|
|
$ |
394,804 |
|
| Internal revenue(3) |
|
82,340 |
|
|
|
132,175 |
|
|
|
(214,515 |
) |
|
|
— |
|
| Total Revenue |
$ |
289,076 |
|
|
$ |
319,477 |
|
|
$ |
(213,749 |
) |
|
$ |
394,804 |
|
|
|
|
|
|
|
|
|
|
|
|
|
|
|
|
|
| Sales tons |
|
13,259 |
|
|
|
3,613 |
|
|
|
|
|
|
|
|
|
| Average selling price per ton(4) |
$ |
19.79 |
|
|
$ |
88.42 |
|
|
|
|
|
|
|
|
|
|
|
|
|
|
|
|
|
|
|
|
|
|
|
|
|
| Gross profit |
$ |
34,775 |
|
|
$ |
35,967 |
|
|
$ |
(22,940 |
) |
|
$ |
47,802 |
|
| Gross profit as a % of revenue |
|
12.0 |
% |
|
|
11.3 |
% |
|
|
NM |
|
|
|
12.1 |
% |
| Gross profit per ton |
$ |
2.62 |
|
|
$ |
9.95 |
|
|
|
|
|
|
|
|
|
|
|
|
|
|
|
|
|
|
|
|
|
|
|
|
|
| Non-cash costs(5) |
|
38,826 |
|
|
|
8,654 |
|
|
|
684 |
|
|
|
48,164 |
|
| Cash gross profit |
$ |
73,601 |
|
|
$ |
44,621 |
|
|
$ |
(22,256 |
) |
|
$ |
95,966 |
|
| Cash gross profit as a % of revenue |
|
25.5 |
% |
|
|
14.0 |
% |
|
|
NM |
|
|
|
24.3 |
% |
| Cash gross profit per ton |
$ |
5.55 |
|
|
$ |
12.35 |
|
|
|
|
|
|
|
|
|
|
|
|
|
|
|
|
|
|
|
|
|
|
|
|
|
|
Materials Product Line(1) |
|
|
|
|
|
|
|
|
|
|
|
Total Materials Segment |
|
|
| Six Months Ended June 30, 2025 |
Aggregate |
|
|
|
Asphalt |
|
|
|
Other and Eliminations(2) |
|
|
|
|
|
|
| External revenue |
$ |
100,045 |
|
|
$ |
173,063 |
|
|
$ |
359 |
|
|
$ |
273,467 |
|
| Internal revenue(3) |
|
64,413 |
|
|
|
74,364 |
|
|
|
(138,777 |
) |
|
|
— |
|
| Total Revenue |
$ |
164,458 |
|
|
$ |
247,427 |
|
|
$ |
(138,418 |
) |
|
$ |
273,467 |
|
|
|
|
|
|
|
|
|
|
|
|
|
|
|
|
|
| Sales tons |
|
10,067 |
|
|
|
3,062 |
|
|
|
|
|
|
|
|
|
| Average selling price per ton(4) |
$ |
16.34 |
|
|
$ |
80.81 |
|
|
|
|
|
|
|
|
|
|
|
|
|
|
|
|
|
|
|
|
|
|
|
|
|
| Gross profit |
$ |
28,609 |
|
|
$ |
26,966 |
|
|
$ |
(11,731 |
) |
|
$ |
43,844 |
|
| Gross profit as a % of revenue |
|
17.4 |
% |
|
|
10.9 |
% |
|
|
NM |
|
|
|
16.0 |
% |
| Gross profit per ton |
$ |
2.84 |
|
|
$ |
8.81 |
|
|
|
|
|
|
|
|
|
|
|
|
|
|
|
|
|
|
|
|
|
|
|
|
|
| Non-cash costs(5) |
|
17,750 |
|
|
|
7,730 |
|
|
|
154 |
|
|
|
25,634 |
|
| Cash gross profit |
$ |
46,359 |
|
|
$ |
34,696 |
|
|
$ |
(11,577 |
) |
|
$ |
69,478 |
|
| Cash gross profit as a % of revenue |
|
28.2 |
% |
|
|
14.0 |
% |
|
|
NM |
|
|
|
25.4 |
% |
| Cash gross profit per ton |
$ |
4.61 |
|
|
$ |
11.33 |
|
|
|
|
|
|
|
|
|
|
|
|
| NM - not meaningful |
|
|
| (1) |
|
The Aggregate product line includes aggregates, barge delivery and recycled materials. The Asphalt product line includes asphalt concrete and liquid asphalt. External revenue includes freight and delivery costs that we pass along to our customers. |
| (2) |
|
Represents our other product line which is comprised of immaterial amounts of products and services that are not considered core product lines, as well as eliminations of interproduct and intersegment transactions and unrealized gains and losses on commodity derivatives. |
| (3) |
|
Includes both intersegment and interproduct revenues. Intersegment revenues for the six months ended June 30, 2026 and June 30, 2025 were $167.5 million and $84.0 million, respectively. |
| (4) |
|
Aggregate average selling price per ton for the six months ended June 30, 2026 was calculated by dividing total aggregate revenue of $289.1 million, less $26.7 million of revenues associated with barge delivery, or $262.4 million, by sales tons for the period. There was no adjustment in the six months ended June 30, 2025. |
| (5) |
|
Non-cash costs include depreciation, depletion and amortization, and, starting in the first quarter of 2026, unrealized gains and losses from the change in fair value of commodity derivative instruments included in cost of revenue. Unrealized gains and losses on commodity derivatives were immaterial in prior periods, and therefore cash gross profit for 2025 is unchanged from what was previously presented. |

View source version on businesswire.com: https://www.businesswire.com/news/home/20260729515860/en/
Investors
Wenjun Xu, 831-761-7861
Or
Media
Erin Kuhlman, 831-768-4111
Source: Granite Construction Incorporated


© 2026 Granite Construction Inc. All Rights Reserved
California Transparency in Supply Chain Act
| Credits
Goodbye For Now
You are leaving the Granite Construction website.
You will automatically be redirected to
[link]
momentarily.
Cancel Redirect
Continue Arrow Icon

 Location, Location, Location