October 28, 2026 Company reports record third quarter operating results and raises full year guidance SCHAFFHAUSEN, Switzerland, Oct. 28, 2026 /PRNewswire/ -- Garmin® Ltd. (NYSE: GRMN), today announced results for the third quarter ended September…
October 28, 2026
Company reports record third quarter operating results and raises full year guidance
SCHAFFHAUSEN, Switzerland, Oct. 28, 2026 /PRNewswire/ -- Garmin® Ltd. (NYSE: GRMN), today announced results for the third quarter ended September 26, 2026.

Highlights include:
- Record consolidated revenue of $1.99 billion, a 12% increase compared to the prior year quarter
- Gross and operating margins expanded to 63.3% and 30.8% respectively, compared to the prior year quarter
- Record operating income of $612 million, a 34% increase compared to the prior year quarter
- GAAP EPS of $2.80 and pro forma EPS(1) of $2.76, representing a 39% increase in pro forma EPS compared to the prior year quarter
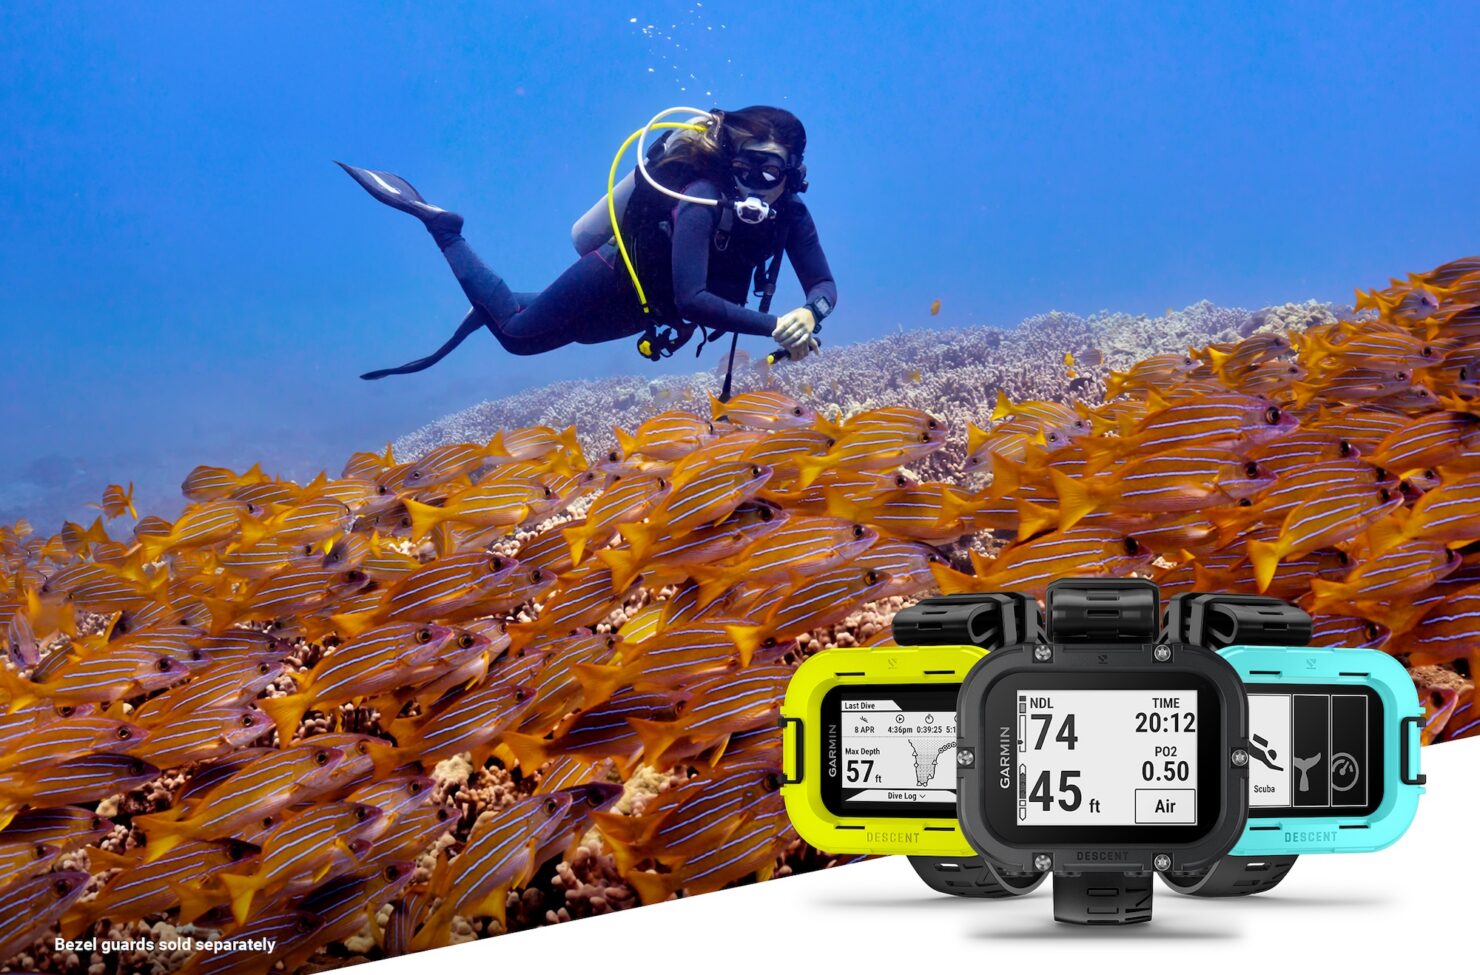
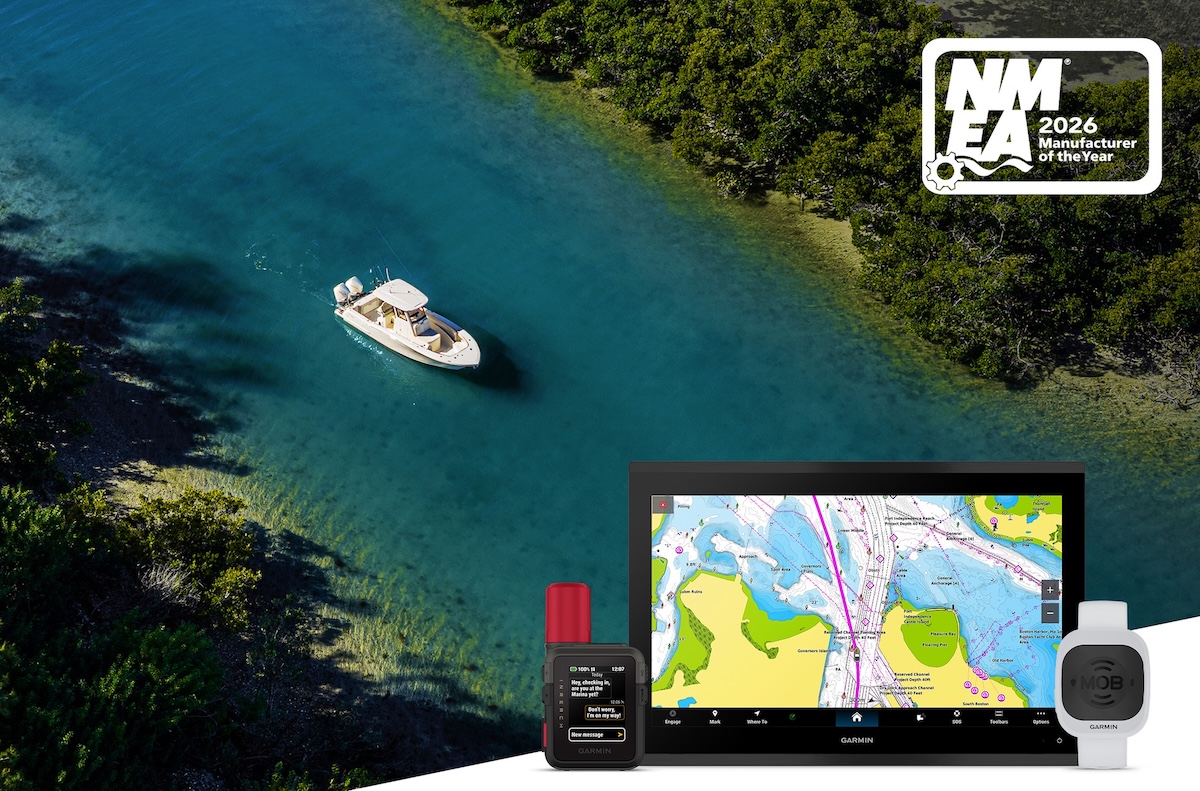
- Named 2026 Manufacturer of the Year by the National Marine Electronics Association for the 12th consecutive year, and received six Product of Excellence awards
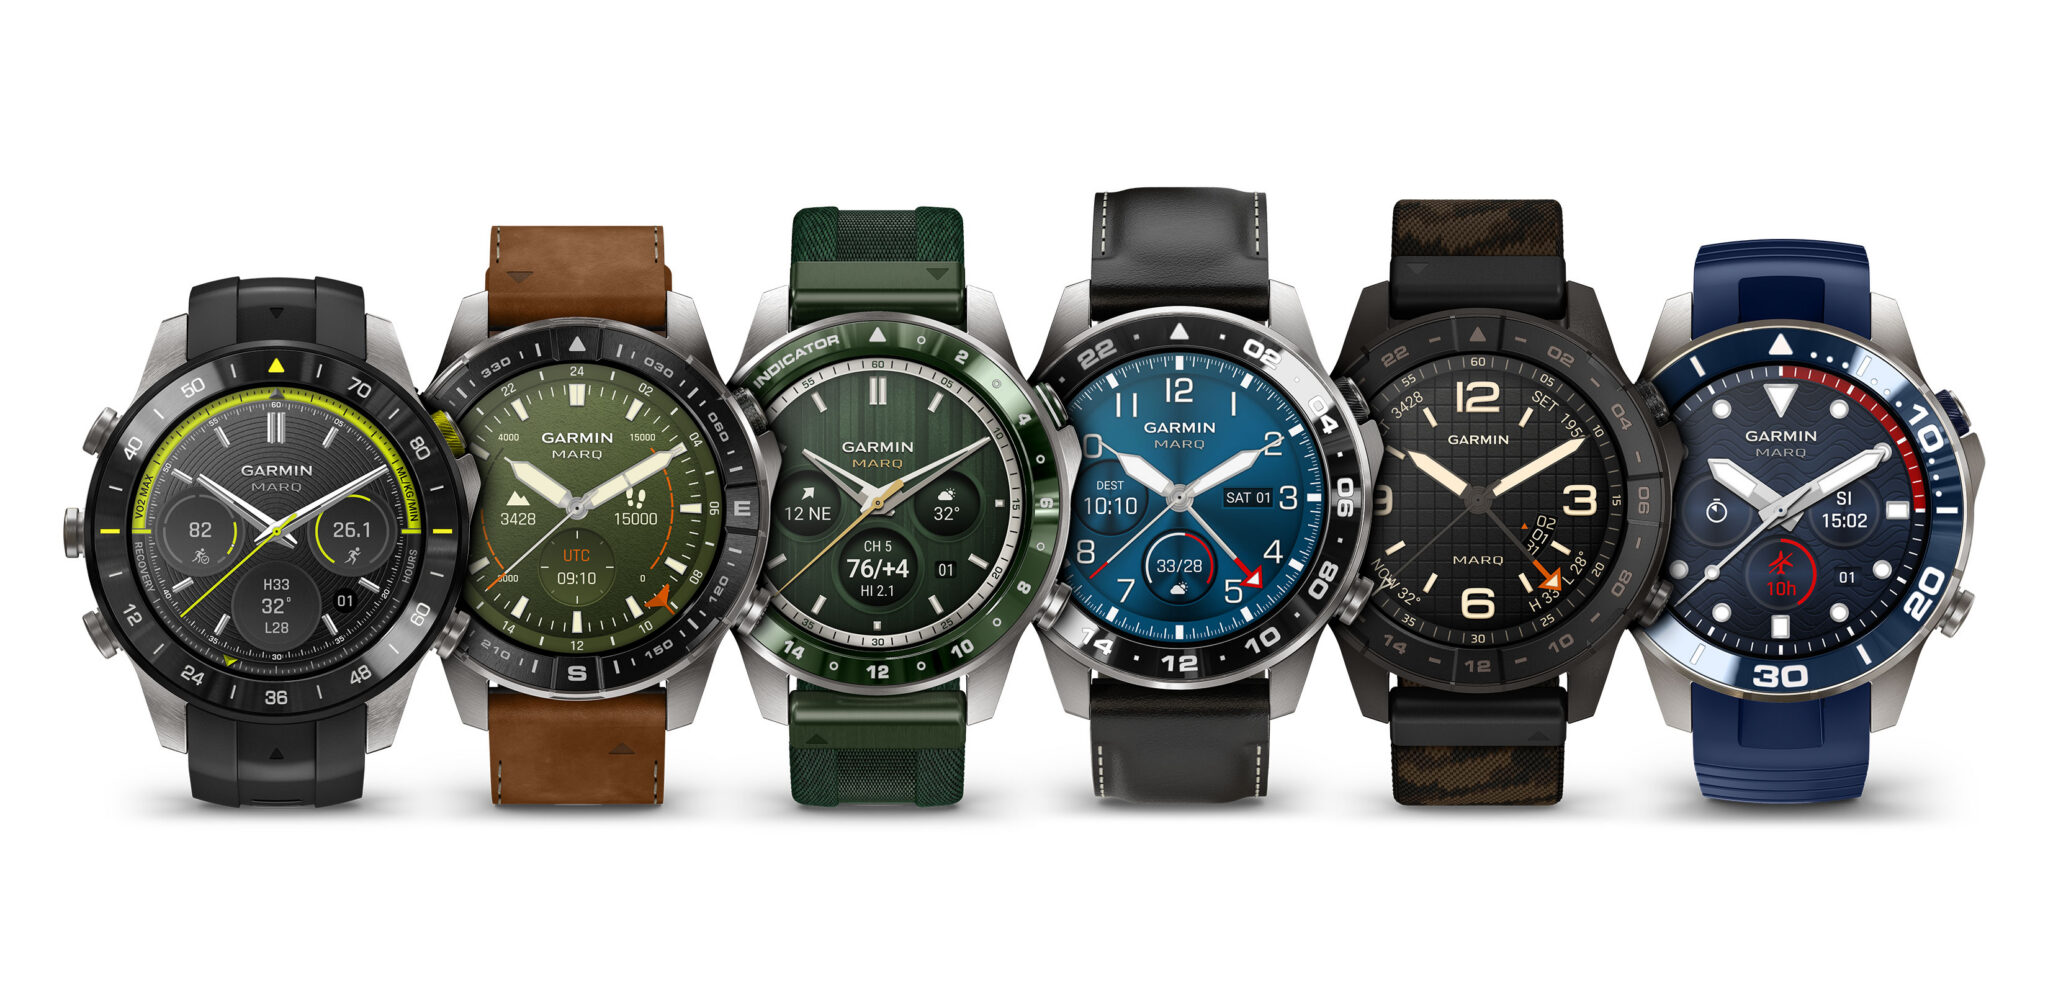
- Launched the fēnix® 9 and fēnix 9 Pro adventure watch series, expanding our flagship performance smartwatch lineup
- Recently announced the delivery of our 1,000th G1000® integrated flight deck retrofit for King Air aircraft making this one of the most successful retrofit flight deck programs in aviation history
- Announced that more than 2,500 aircraft are equipped with the revolutionary Garmin Autoland system, the world's first and only certified autonomous system designed to activate during an emergency to safely fly and land an aircraft without human interaction
|
|
|
|
|
|
|
|
|
|
|
|
|
|
|
|
|
|
|
|
|
|
|
|
|
| (In thousands, except per share information) |
|
13-Weeks Ended |
|
|
|
|
|
|
|
|
|
|
|
39-Weeks Ended |
|
|
|
|
|
|
|
|
|
|
|
|
September 26, |
|
|
|
September 27, |
|
|
|
YoY |
|
|
|
September 26, |
|
|
|
September 27, |
|
|
|
YoY |
|
|
|
|
2026 |
|
|
|
2025 |
|
|
|
Change |
|
|
|
2026 |
|
|
|
2025 |
|
|
|
Change |
|
|
| Net sales |
|
$ |
1,986,076 |
|
|
$ |
1,770,901 |
|
|
12 % |
|
|
|
$ |
5,761,658 |
|
|
$ |
5,120,564 |
|
|
13 % |
|
|
| Fitness |
|
|
694,328 |
|
|
|
601,013 |
|
|
16 % |
|
|
|
|
1,997,974 |
|
|
|
1,591,159 |
|
|
26 % |
|
|
| Outdoor |
|
|
597,301 |
|
|
|
497,598 |
|
|
20 % |
|
|
|
|
1,497,571 |
|
|
|
1,426,451 |
|
|
5 % |
|
|
| Aviation |
|
|
252,657 |
|
|
|
240,445 |
|
|
5 % |
|
|
|
|
785,248 |
|
|
|
712,926 |
|
|
10 % |
|
|
| Marine |
|
|
309,878 |
|
|
|
267,005 |
|
|
16 % |
|
|
|
|
1,006,262 |
|
|
|
885,704 |
|
|
14 % |
|
|
| Auto OEM |
|
|
131,912 |
|
|
|
164,840 |
|
|
(20) % |
|
|
|
|
474,603 |
|
|
|
504,324 |
|
|
(6) % |
|
|
|
|
|
|
|
|
|
|
|
|
|
|
|
|
|
|
|
|
|
|
|
|
|
|
|
| Gross profit |
|
|
1,257,768 |
|
|
|
1,046,487 |
|
|
20 % |
|
|
|
|
3,562,078 |
|
|
|
2,998,043 |
|
|
19 % |
|
|
| Gross margin % |
|
|
63.3 |
% |
|
|
59.1 |
% |
|
|
|
|
|
|
61.8 |
% |
|
|
58.5 |
% |
|
|
|
|
|
|
|
|
|
|
|
|
|
|
|
|
|
|
|
|
|
|
|
|
|
|
|
|
|
| Operating Income |
|
|
611,648 |
|
|
|
456,803 |
|
|
34 % |
|
|
|
|
1,658,821 |
|
|
|
1,261,922 |
|
|
31 % |
|
|
| Operating income % |
|
|
30.8 |
% |
|
|
25.8 |
% |
|
|
|
|
|
|
28.8 |
% |
|
|
24.6 |
% |
|
|
|
|
|
|
|
|
|
|
|
|
|
|
|
|
|
|
|
|
|
|
|
|
|
|
|
|
|
| GAAP diluted EPS |
|
$ |
2.80 |
|
|
$ |
2.08 |
|
|
35 % |
|
|
|
$ |
7.69 |
|
|
$ |
5.87 |
|
|
31 % |
|
|
| Pro forma diluted EPS(1) |
|
$ |
2.76 |
|
|
$ |
1.99 |
|
|
39 % |
|
|
|
$ |
7.65 |
|
|
$ |
5.77 |
|
|
33 % |
|
|
|
|
|
|
|
|
|
|
|
|
|
|
|
|
|
|
|
|
|
|
|
|
|
|
|
|
|
| (1) See attached Non-GAAP Financial Information for discussion and reconciliation of non-GAAP financial measures, including pro forma diluted EPS |
|
Executive Overview from Cliff Pemble, President and Chief Executive Officer:
"We achieved another quarter of record operating results driven by strength across markets and product categories, with meaningful contributions from recently launched products. Our results were further enhanced by strong operational execution resulting in record consolidated gross margin and impressive operating profit leverage. We are raising our 2026 outlook based on the results we have achieved so far and the momentum we are experiencing as we enter the important holiday selling season." - Cliff Pemble, President and Chief Executive Officer of Garmin Ltd.
Fitness:
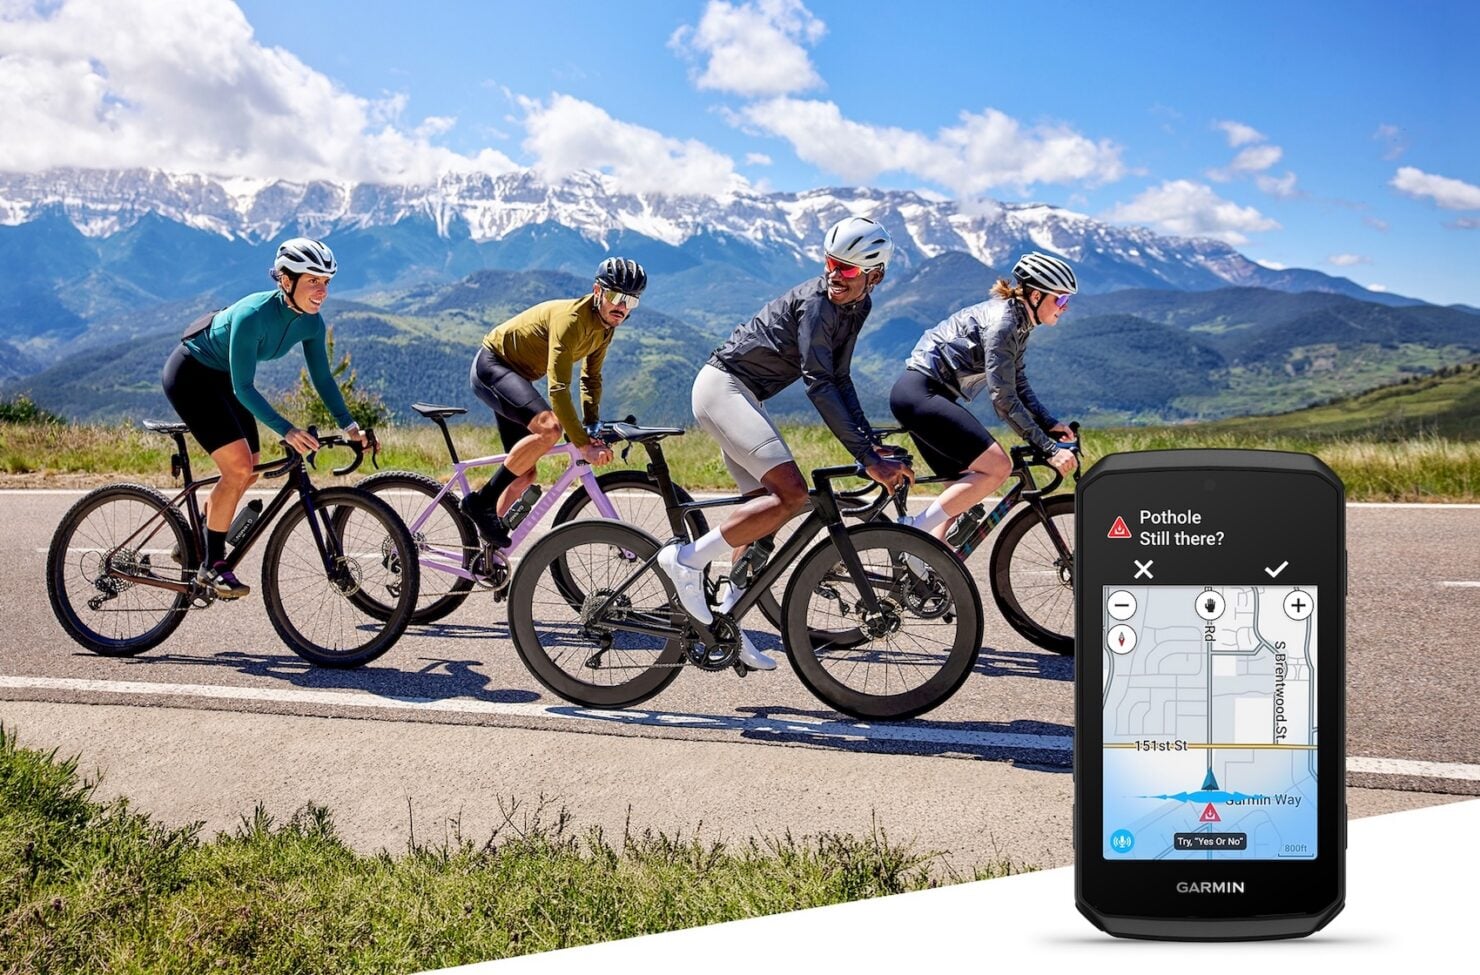
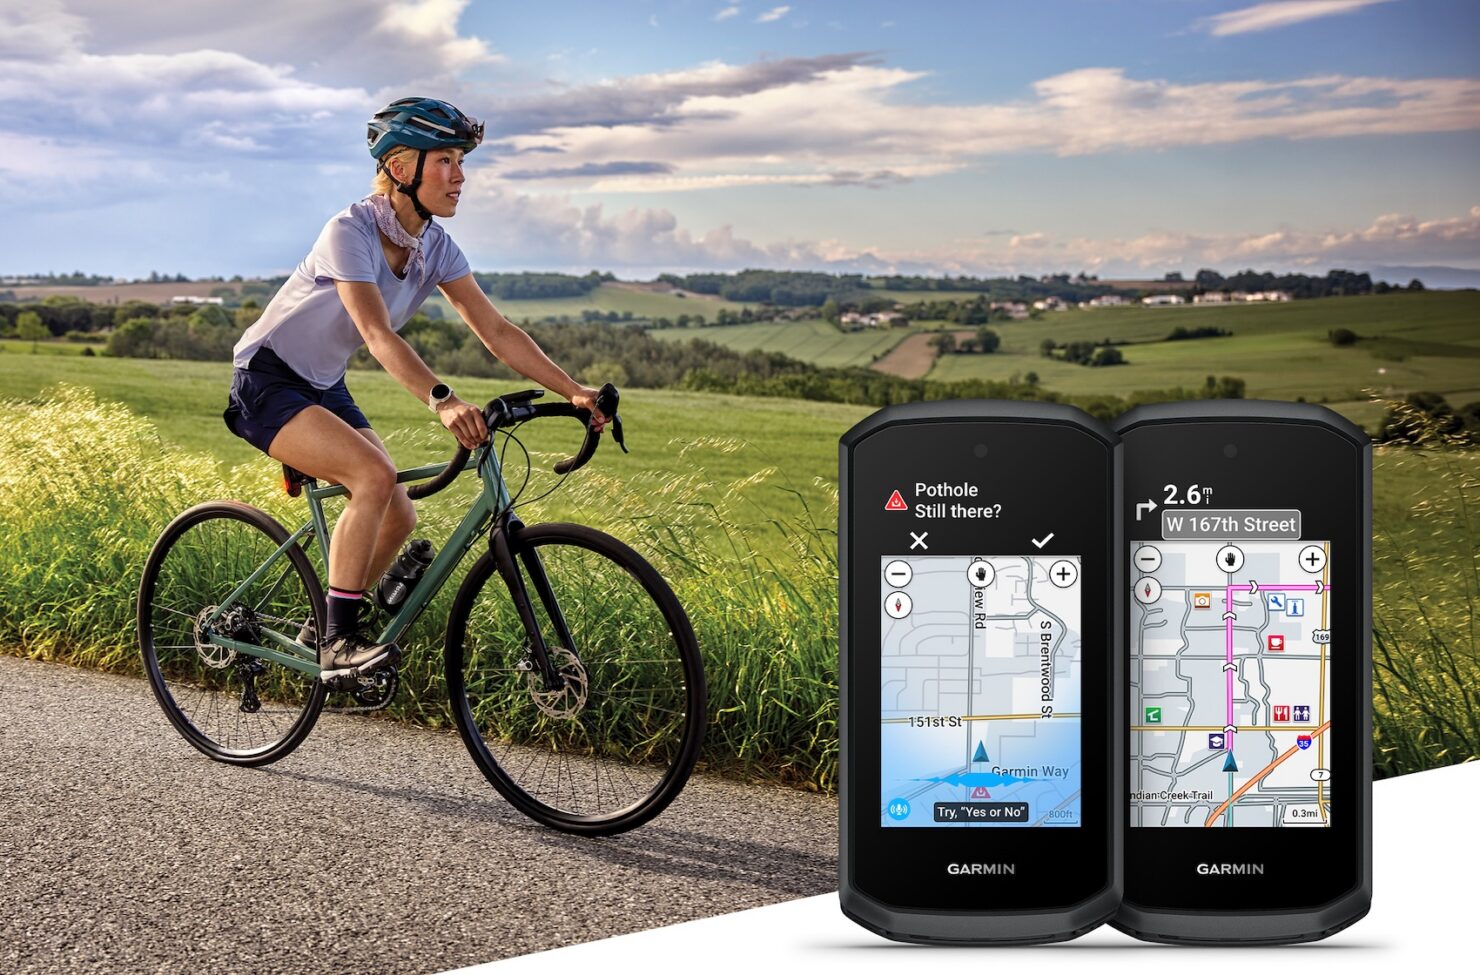
Revenue from the fitness segment increased 16% in the third quarter with growth led by strong demand for wearables. Gross and operating margins were 63% and 33%, respectively, resulting in $231 million of operating income. During the quarter, we launched the CIRQA™ Smart Band, a screenless wearable offering rich wellness and fitness insights that expands our addressable market for wellness devices. In addition, we recently announced the next generation of Edge® cycling computers with the Edge 1060 featuring a built-in microphone and speaker for hands-free voice control capability and the Edge Explore 3 series, an easy-to-use bike computer for riders of all levels.
Outdoor:
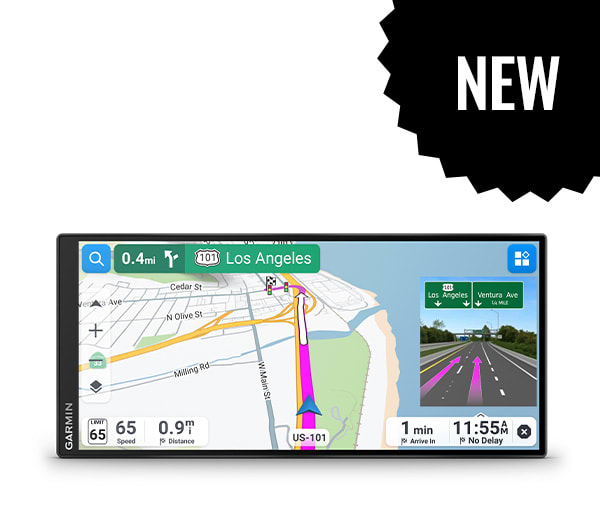
Revenue from the outdoor segment increased 20% in the third quarter with growth primarily driven by adventure watches. Gross and operating margins were 68% and 39%, respectively, resulting in $233 million of operating income. During the quarter, we launched the fēnix 9 and fēnix 9 Pro series, with an all-titanium watch case option and the largest available AMOLED screen in our flagship adventure watch lineup. Also during the quarter, we launched the all-new Garmin Drive™ GPS navigators with high-resolution ultrawide format displays and an elevated user experience.
Aviation:
Revenue from the aviation segment increased 5% in the third quarter with growth primarily driven by OEM product categories. Gross and operating margins were 78% and 26%, respectively, resulting in $66 million of operating income. During the quarter, we unveiled the G2000® PRIME, bringing PRIME flight deck functionality to the high-performance piston and electric aircraft market. Also during the quarter, we announced the certification of an all-glass retrofit cockpit for the original Cessna CitationJet. Pilatus Aircraft and Epic Aircraft recently announced the certification of Garmin Autoland on the PC-12 Pro and the e1000 airplanes, respectively. We also made important updates to Garmin Pilot™, adding SmartCharts coverage for Canada and Mexico, as well as Mobile Clearance Delivery which allows pilots to obtain clearances electronically through the Garmin Pilot app.
Marine:
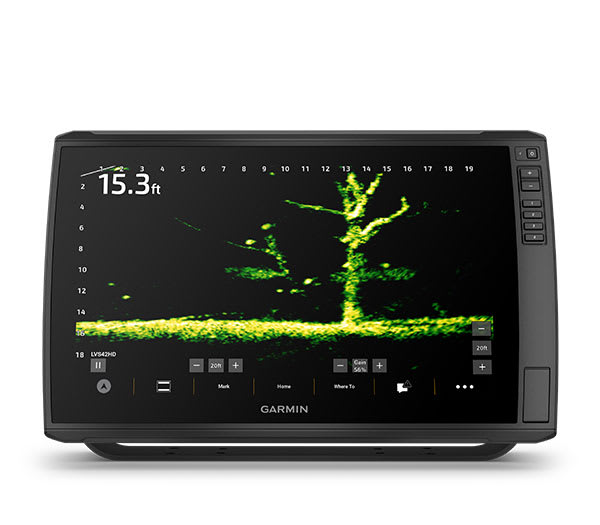
Revenue from the marine segment increased 16% in the third quarter with broad-based growth across multiple categories, led by the sonar product category. Gross and operating margins were 64% and 30%, respectively, resulting in $94 million of operating income. During the quarter, we launched the next generation LiveScope™ 2, delivering live sonar images with improved range and clarity. Also during the quarter, we expanded our sailboat product lineup with the GMI™ 40 instrument display and the SmartDrive™ brushless linear steering actuator. We also launched the JL Audio A60 head unit series, and M200 speaker systems.
Auto OEM:
Revenue from the auto OEM segment decreased 20% during the third quarter primarily due to domain controllers. Gross margin was 16% and we recorded an operating loss of $12 million in the quarter.
Additional Financial Information:
The consolidated third quarter gross margin expanded 420 basis points to 63.3%, compared to the prior year quarter, with higher margins across all segments. The consolidated gross margin increase was primarily attributable to favorable segment mix, lower product cost, and approximately $33 million in refunds of previously paid tariffs.
Total operating expenses in the third quarter were $646 million, a 10% increase over the prior year. Research and development increased 9% driven primarily by personnel-related costs. Selling, general and administrative expenses increased 10%, driven primarily by personnel-related costs and advertising expenses.
The effective tax rate in the third quarter was 18.1%, compared to an effective tax rate of 21.2% in the prior year quarter. The decrease in the effective tax rate is primarily driven by an increase in expected U.S. deductions due to certain provisions of the U.S. tax legislation enacted in 2025 that became effective in 2026.
In the third quarter of 2026, we generated operating cash flows of $394 million and free cash flow(1) of $293 million. We paid a quarterly dividend of $202 million and repurchased $41 million of the Company's shares within the quarter, leaving approximately $407 million remaining as of September 26, 2026 in the $500 million share repurchase program authorized through December 2028. We ended the quarter with cash and marketable securities of approximately $4.1 billion.
(1) See attached Non-GAAP Financial Information for discussion and reconciliation of non-GAAP financial measures, including pro forma effective tax rate and free cash flow.
Fiscal Year 2026 Guidance:
Based on our performance in the first three quarters of 2026 and our positive outlook for the remainder of the year, we are raising our full year 2026 guidance. We now anticipate revenue of approximately $8.15 billion and pro forma EPS of $10.80 based on gross margin of 61.0%, operating margin of 29.0% and a full year tax rate of 16.5% (see attached discussion on Forward-looking Financial Measures).
Dividend Recommendation:
At the 2026 annual shareholders' meeting, Garmin shareholders, in accordance with Swiss corporate law, approved a cash dividend in the total amount of $4.20 per share, payable in four equal installments on dates to be determined by the Board in its discretion. The first and second payments were made on June 26, 2026 and September 25, 2026. The Board of Directors has established December 24, 2026, as the payment date for the next dividend installment of $1.05 per share with a record date of December 11, 2026. The Board currently anticipates the scheduling of the remaining quarterly dividend installment as follows:
|
|
|
|
|
| Dividend Date |
|
Record Date |
|
$'s per share |
| March 26, 2027 |
|
March 12, 2027 |
|
$1.05 |
Webcast Information/Forward-Looking Statements:
The information for Garmin Ltd.'s earnings call is as follows:
An archive of the live webcast will be available until October 27, 2027 on the Garmin website at www.garmin.com
. To access the replay, click on the Investors link and click over to the News & Events page.
This release includes projections and other forward-looking statements regarding Garmin Ltd. and its business that are commonly identified by words such as "anticipates," "would," "may," "expects," "estimates," "plans," "intends," "projects," and other words or phrases with similar meanings. Any statements regarding the Company's expected fiscal 2026 GAAP and pro forma estimated earnings, EPS, and effective tax rate, and the Company's expected segment revenue growth rates, consolidated revenue, gross margins, operating margins, tariffs and other global trade related impacts, potential future acquisitions, share repurchase programs, currency movements, expenses, pricing, new product launches, market reach, statements relating to possible future dividends, and the Company's plans and objectives are forward-looking statements. The forward-looking events and circumstances discussed in this release may not occur and actual results could differ materially as a result of risk factors and uncertainties affecting Garmin, including, but not limited to, the risk factors that are described in the Annual Report on Form 10-K for the year ended December 27, 2025 filed by Garmin with the Securities and Exchange Commission (Commission file number 001-41118). A copy of Garmin's 2025 Form 10-K can be downloaded from https://investors.garmin.com/financials/sec-filings/default.aspx
. All information provided in this release and in the attachments is as of September 26, 2026. We undertake no duty to update this information unless required by law.
This release and the attachments contain non-GAAP financial measures. A reconciliation to the nearest GAAP measure and a discussion of the Company's use of these measures are included in the attachments.
Garmin, the Garmin logo, the Garmin delta, Edge, fēnix, G1000, G2000, and JL Audio are trademarks of Garmin Ltd. or its subsidiaries and are registered in one or more countries, including the U.S. CIRQA, Garmin Drive, Garmin Pilot, SmartDrive, GMI, and LiveScope are trademarks of Garmin Ltd. or its subsidiaries. All other brands, product names, company names, trademarks and service marks are the properties of their respective owners. All rights reserved.
|
|
|
|
|
|
|
|
|
|
|
|
|
|
|
|
|
| Garmin Ltd. and Subsidiaries Condensed Consolidated Statements of Income (Unaudited) (In thousands, except per share information) |
|
|
|
|
|
|
|
|
|
|
|
|
|
|
|
|
|
|
|
|
|
|
|
|
|
|
|
|
|
|
|
|
|
|
|
13-Weeks Ended |
|
|
|
|
|
|
|
39-Weeks Ended |
|
|
|
|
|
|
|
|
September 26, |
|
|
|
September 27, |
|
|
|
September 26, |
|
|
|
September 27, |
|
|
|
|
2026 |
|
|
|
2025 |
|
|
|
2026 |
|
|
|
2025 |
|
|
| Net sales |
|
$ |
1,986,076 |
|
|
$ |
1,770,901 |
|
|
$ |
5,761,658 |
|
|
$ |
5,120,564 |
|
| Cost of goods sold |
|
|
728,308 |
|
|
|
724,414 |
|
|
|
2,199,580 |
|
|
|
2,122,521 |
|
| Gross profit |
|
|
1,257,768 |
|
|
|
1,046,487 |
|
|
|
3,562,078 |
|
|
|
2,998,043 |
|
|
|
|
|
|
|
|
|
|
|
|
|
|
|
|
|
|
| Research and development expense |
|
|
312,916 |
|
|
|
286,464 |
|
|
|
912,673 |
|
|
|
831,247 |
|
| Selling, general and administrative expenses |
|
|
333,204 |
|
|
|
303,220 |
|
|
|
990,584 |
|
|
|
904,874 |
|
| Total operating expense |
|
|
646,120 |
|
|
|
589,684 |
|
|
|
1,903,257 |
|
|
|
1,736,121 |
|
|
|
|
|
|
|
|
|
|
|
|
|
|
|
|
|
|
| Operating income |
|
|
611,648 |
|
|
|
456,803 |
|
|
|
1,658,821 |
|
|
|
1,261,922 |
|
|
|
|
|
|
|
|
|
|
|
|
|
|
|
|
|
|
| Other income (expense): |
|
|
|
|
|
|
|
|
|
|
|
|
|
|
|
|
| Interest income |
|
|
36,357 |
|
|
|
32,085 |
|
|
|
110,504 |
|
|
|
94,316 |
|
| Foreign currency gains |
|
|
9,788 |
|
|
|
20,334 |
|
|
|
10,417 |
|
|
|
21,582 |
|
| Other income |
|
|
3,329 |
|
|
|
598 |
|
|
|
4,970 |
|
|
|
1,329 |
|
| Total other income (expense) |
|
|
49,474 |
|
|
|
53,017 |
|
|
|
125,891 |
|
|
|
117,227 |
|
|
|
|
|
|
|
|
|
|
|
|
|
|
|
|
|
|
| Income before income taxes |
|
|
661,122 |
|
|
|
509,820 |
|
|
|
1,784,712 |
|
|
|
1,379,149 |
|
| Income tax provision |
|
|
119,461 |
|
|
|
108,205 |
|
|
|
296,052 |
|
|
|
243,943 |
|
| Net income |
|
$ |
541,661 |
|
|
$ |
401,615 |
|
|
$ |
1,488,660 |
|
|
$ |
1,135,206 |
|
|
|
|
|
|
|
|
|
|
|
|
|
|
|
|
|
|
| Net income per share: |
|
|
|
|
|
|
|
|
|
|
|
|
|
|
|
|
| Basic |
|
$ |
2.81 |
|
|
$ |
2.09 |
|
|
$ |
7.72 |
|
|
$ |
5.90 |
|
| Diluted |
|
$ |
2.80 |
|
|
$ |
2.08 |
|
|
$ |
7.69 |
|
|
$ |
5.87 |
|
|
|
|
|
|
|
|
|
|
|
|
|
|
|
|
|
|
| Weighted average common shares outstanding: |
|
|
|
|
|
|
|
|
|
|
|
|
|
|
|
|
| Basic |
|
|
192,836 |
|
|
|
192,464 |
|
|
|
192,782 |
|
|
|
192,510 |
|
| Diluted |
|
|
193,617 |
|
|
|
193,533 |
|
|
|
193,556 |
|
|
|
193,551 |
|
|
|
|
|
|
|
|
|
|
| Garmin Ltd. and Subsidiaries Condensed Consolidated Balance Sheets (Unaudited) (In thousands) |
|
|
|
|
|
|
|
|
|
|
|
|
|
|
|
|
|
|
|
September 26,2026 |
|
|
|
December 27, 2025 |
|
|
| Assets |
|
|
|
|
|
|
|
|
| Current assets: |
|
|
|
|
|
|
|
|
| Cash and cash equivalents |
|
$ |
2,039,779 |
|
|
$ |
2,278,646 |
|
| Marketable securities |
|
|
299,693 |
|
|
|
459,202 |
|
| Accounts receivable, net |
|
|
1,137,167 |
|
|
|
1,253,015 |
|
| Inventories |
|
|
2,251,741 |
|
|
|
1,772,257 |
|
| Deferred costs |
|
|
12,508 |
|
|
|
17,538 |
|
| Prepaid expenses and other current assets |
|
|
742,631 |
|
|
|
467,558 |
|
| Total current assets |
|
|
6,483,519 |
|
|
|
6,248,216 |
|
|
|
|
|
|
|
|
|
|
| Property and equipment, net |
|
|
1,496,143 |
|
|
|
1,375,348 |
|
| Operating lease right-of-use assets |
|
|
207,636 |
|
|
|
196,183 |
|
| Noncurrent marketable securities |
|
|
1,727,086 |
|
|
|
1,396,929 |
|
| Deferred income tax assets |
|
|
704,893 |
|
|
|
718,094 |
|
| Noncurrent deferred costs |
|
|
3,918 |
|
|
|
4,373 |
|
| Goodwill |
|
|
978,557 |
|
|
|
760,241 |
|
| Other intangible assets, net |
|
|
270,875 |
|
|
|
198,362 |
|
| Other noncurrent assets |
|
|
121,156 |
|
|
|
95,923 |
|
| Total assets |
|
$ |
11,993,783 |
|
|
$ |
10,993,669 |
|
|
|
|
|
|
|
|
|
|
| Liabilities and Stockholders' Equity |
|
|
|
|
|
|
|
|
| Current liabilities: |
|
|
|
|
|
|
|
|
| Accounts payable |
|
$ |
500,671 |
|
|
$ |
347,493 |
|
| Salaries and benefits payable |
|
|
256,762 |
|
|
|
228,267 |
|
| Accrued warranty costs |
|
|
76,874 |
|
|
|
72,921 |
|
| Accrued sales program costs |
|
|
113,724 |
|
|
|
153,193 |
|
| Other accrued expenses |
|
|
271,233 |
|
|
|
257,651 |
|
| Deferred revenue |
|
|
119,858 |
|
|
|
105,646 |
|
| Income taxes payable |
|
|
384,351 |
|
|
|
381,549 |
|
| Dividend payable |
|
|
404,779 |
|
|
|
173,351 |
|
| Total current liabilities |
|
|
2,128,252 |
|
|
|
1,720,071 |
|
|
|
|
|
|
|
|
|
|
| Deferred income tax liabilities |
|
|
116,224 |
|
|
|
109,701 |
|
| Noncurrent income taxes payable |
|
|
3,325 |
|
|
|
3,596 |
|
| Noncurrent deferred revenue |
|
|
22,400 |
|
|
|
22,277 |
|
| Noncurrent operating lease liabilities |
|
|
173,491 |
|
|
|
164,835 |
|
| Other noncurrent liabilities |
|
|
565 |
|
|
|
625 |
|
|
|
|
|
|
|
|
|
|
| Stockholders' equity: |
|
|
|
|
|
|
|
|
| Common shares, $0.10 par value (194,901 and 194,901 shares authorized andissued; 192,757 and 192,620 shares outstanding) |
|
|
19,490 |
|
|
|
19,490 |
|
| Additional paid-in capital |
|
|
2,425,759 |
|
|
|
2,368,670 |
|
| Treasury shares (2,144 and 2,281 shares) |
|
|
(468,628) |
|
|
|
(406,423) |
|
| Retained earnings |
|
|
7,648,939 |
|
|
|
6,970,182 |
|
| Accumulated other comprehensive income (loss) |
|
|
(76,034) |
|
|
|
20,645 |
|
| Total stockholders' equity |
|
|
9,549,526 |
|
|
|
8,972,564 |
|
| Total liabilities and stockholders' equity |
|
$ |
11,993,783 |
|
|
$ |
10,993,669 |
|
|
|
|
|
|
|
|
|
|
| Garmin Ltd. and Subsidiaries Condensed Consolidated Statements of Cash Flows (Unaudited) (In thousands) |
|
|
|
|
|
|
|
|
|
|
|
|
|
|
|
|
|
|
|
39-Weeks Ended |
|
|
|
|
|
|
|
|
September 26, 2026 |
|
|
|
September 27, 2025 |
|
|
| Operating Activities: |
|
|
|
|
|
|
|
|
| Net income |
|
$ |
1,488,660 |
|
|
$ |
1,135,206 |
|
| Adjustments to reconcile net income to net cash provided by operating activities: |
|
|
|
|
|
|
|
|
| Depreciation |
|
|
122,519 |
|
|
|
115,633 |
|
| Amortization |
|
|
26,692 |
|
|
|
26,874 |
|
| (Gain) loss on sale or disposal of property and equipment |
|
|
(639) |
|
|
|
375 |
|
| Unrealized foreign currency gains |
|
|
(7,347) |
|
|
|
(37,606) |
|
| Deferred income taxes |
|
|
33,523 |
|
|
|
19,324 |
|
| Stock compensation expense |
|
|
133,526 |
|
|
|
125,003 |
|
| Realized loss on marketable securities |
|
|
587 |
|
|
|
857 |
|
| Changes in operating assets and liabilities, net of acquisitions: |
|
|
|
|
|
|
|
|
| Accounts receivable, net of allowance for doubtful accounts |
|
|
102,946 |
|
|
|
68,818 |
|
| Inventories |
|
|
(488,774) |
|
|
|
(324,880) |
|
| Other current and noncurrent assets |
|
|
(266,274) |
|
|
|
(18,466) |
|
| Accounts payable |
|
|
156,023 |
|
|
|
(7,531) |
|
| Other current and noncurrent liabilities |
|
|
5,978 |
|
|
|
1,944 |
|
| Deferred revenue |
|
|
3,642 |
|
|
|
(11,603) |
|
| Deferred costs |
|
|
5,486 |
|
|
|
8,703 |
|
| Income taxes |
|
|
16,851 |
|
|
|
(23,077) |
|
| Net cash provided by operating activities |
|
|
1,333,399 |
|
|
|
1,079,574 |
|
|
|
|
|
|
|
|
|
|
| Investing activities: |
|
|
|
|
|
|
|
|
| Purchases of property and equipment |
|
|
(294,982) |
|
|
|
(146,273) |
|
| Purchase of marketable securities |
|
|
(632,001) |
|
|
|
(724,091) |
|
| Redemption of marketable securities |
|
|
403,842 |
|
|
|
531,804 |
|
| Net payments for acquisitions |
|
|
(320,588) |
|
|
|
(175,655) |
|
| Other investing activities, net |
|
|
2,388 |
|
|
|
387 |
|
| Net cash used in investing activities |
|
|
(841,341) |
|
|
|
(513,828) |
|
|
|
|
|
|
|
|
|
|
| Financing activities: |
|
|
|
|
|
|
|
|
| Dividends |
|
|
(578,474) |
|
|
|
(490,919) |
|
| Proceeds from issuance of treasury shares related to equity awards |
|
|
31,425 |
|
|
|
29,065 |
|
| Purchase of treasury shares related to equity awards |
|
|
(47,069) |
|
|
|
(33,476) |
|
| Purchase of treasury shares under share repurchase plan |
|
|
(123,206) |
|
|
|
(130,149) |
|
| Net cash used in financing activities |
|
|
(717,324) |
|
|
|
(625,479) |
|
|
|
|
|
|
|
|
|
|
| Effect of exchange rate changes on cash and cash equivalents |
|
|
(13,570) |
|
|
|
53,125 |
|
|
|
|
|
|
|
|
|
|
| Net decrease in cash, cash equivalents, and restricted cash |
|
|
(238,836) |
|
|
|
(6,608) |
|
| Cash, cash equivalents, and restricted cash at beginning of period |
|
|
2,279,360 |
|
|
|
2,080,154 |
|
| Cash, cash equivalents, and restricted cash at end of period |
|
$ |
2,040,524 |
|
|
$ |
2,073,546 |
|
|
|
|
|
|
|
|
|
|
|
|
|
|
|
|
|
|
|
|
|
|
|
|
|
|
| Garmin Ltd. and Subsidiaries Net Sales, Gross Profit and Operating Income by Segment (Unaudited) (In thousands) |
|
|
|
|
|
|
|
|
|
|
|
|
|
|
|
|
|
|
|
|
|
|
|
|
|
|
|
|
|
|
|
|
|
|
|
|
|
|
|
|
|
|
|
|
|
|
|
|
|
|
|
Fitness |
|
|
|
Outdoor |
|
|
|
Aviation |
|
|
|
Marine |
|
|
|
Auto OEM |
|
|
|
Total |
|
|
| 13-Weeks Ended September 26, 2026 |
|
|
|
|
|
|
|
|
|
|
|
|
|
|
|
|
|
|
|
|
|
|
|
|
| Net sales |
|
$ |
694,328 |
|
|
$ |
597,301 |
|
|
$ |
252,657 |
|
|
$ |
309,878 |
|
|
$ |
131,912 |
|
|
$ |
1,986,076 |
|
| Gross profit |
|
|
434,456 |
|
|
|
406,731 |
|
|
|
196,421 |
|
|
|
198,442 |
|
|
|
21,718 |
|
|
|
1,257,768 |
|
| Operating income (loss) |
|
|
230,634 |
|
|
|
233,043 |
|
|
|
65,835 |
|
|
|
93,994 |
|
|
|
(11,858) |
|
|
|
611,648 |
|
|
|
|
|
|
|
|
|
|
|
|
|
|
|
|
|
|
|
|
|
|
|
|
|
|
| 13-Weeks Ended September 27, 2025 |
|
|
|
|
|
|
|
|
|
|
|
|
|
|
|
|
|
|
|
|
|
|
|
|
| Net sales |
|
$ |
601,013 |
|
|
$ |
497,598 |
|
|
$ |
240,445 |
|
|
$ |
267,005 |
|
|
$ |
164,840 |
|
|
$ |
1,770,901 |
|
| Gross profit |
|
|
362,849 |
|
|
|
329,749 |
|
|
|
180,708 |
|
|
|
148,238 |
|
|
|
24,943 |
|
|
|
1,046,487 |
|
| Operating income (loss) |
|
|
193,600 |
|
|
|
169,734 |
|
|
|
60,768 |
|
|
|
49,396 |
|
|
|
(16,695) |
|
|
|
456,803 |
|
|
|
|
|
|
|
|
|
|
|
|
|
|
|
|
|
|
|
|
|
|
|
|
|
|
| 39-Weeks Ended September 26, 2026 |
|
|
|
|
|
|
|
|
|
|
|
|
|
|
|
|
|
|
|
|
|
|
|
|
| Net sales |
|
$ |
1,997,974 |
|
|
$ |
1,497,571 |
|
|
$ |
785,248 |
|
|
$ |
1,006,262 |
|
|
$ |
474,603 |
|
|
$ |
5,761,658 |
|
| Gross profit |
|
|
1,253,701 |
|
|
|
1,016,992 |
|
|
|
595,702 |
|
|
|
604,781 |
|
|
|
90,902 |
|
|
|
3,562,078 |
|
| Operating income (loss) |
|
|
665,293 |
|
|
|
515,416 |
|
|
|
208,936 |
|
|
|
284,598 |
|
|
|
(15,422) |
|
|
|
1,658,821 |
|
|
|
|
|
|
|
|
|
|
|
|
|
|
|
|
|
|
|
|
|
|
|
|
|
|
| 39-Weeks Ended September 27, 2025 |
|
|
|
|
|
|
|
|
|
|
|
|
|
|
|
|
|
|
|
|
|
|
|
|
| Net sales |
|
$ |
1,591,159 |
|
|
$ |
1,426,451 |
|
|
$ |
712,926 |
|
|
$ |
885,704 |
|
|
$ |
504,324 |
|
|
$ |
5,120,564 |
|
| Gross profit |
|
|
947,661 |
|
|
|
936,713 |
|
|
|
534,082 |
|
|
|
496,509 |
|
|
|
83,078 |
|
|
|
2,998,043 |
|
| Operating income (loss) |
|
|
468,943 |
|
|
|
456,402 |
|
|
|
172,508 |
|
|
|
199,181 |
|
|
|
(35,112) |
|
|
|
1,261,922 |
|
|
|
|
|
|
|
|
|
|
|
|
|
|
|
|
|
|
|
|
|
|
|
|
|
|
| Garmin Ltd. and Subsidiaries Net Sales by Geography (Unaudited) (In thousands) |
|
|
|
|
|
|
|
|
|
|
|
|
|
|
|
|
|
|
|
|
|
|
|
|
|
|
|
|
|
|
|
|
|
|
|
|
|
|
|
|
|
|
|
|
|
|
|
|
|
|
|
13-Weeks Ended |
|
|
|
|
|
|
|
|
|
|
|
39-Weeks Ended |
|
|
|
|
|
|
|
|
|
|
|
|
September 26, |
|
|
|
September 27, |
|
|
|
YoY |
|
|
|
September 26, |
|
|
|
September 27, |
|
|
|
YoY |
|
|
|
|
2026 |
|
|
|
2025 |
|
|
|
Change |
|
|
|
2026 |
|
|
|
2025 |
|
|
|
Change |
|
|
| Net sales |
|
$ |
1,986,076 |
|
|
$ |
1,770,901 |
|
|
12 % |
|
|
|
$ |
5,761,658 |
|
|
$ |
5,120,564 |
|
|
13 % |
|
|
| Americas |
|
|
913,081 |
|
|
|
795,624 |
|
|
15 % |
|
|
|
|
2,714,100 |
|
|
|
2,419,371 |
|
|
12 % |
|
|
| EMEA |
|
|
778,021 |
|
|
|
692,557 |
|
|
12 % |
|
|
|
|
2,200,935 |
|
|
|
1,938,912 |
|
|
14 % |
|
|
| APAC |
|
|
294,974 |
|
|
|
282,720 |
|
|
4 % |
|
|
|
|
846,623 |
|
|
|
762,281 |
|
|
11 % |
|
|
|
|
|
|
|
|
|
|
|
|
|
|
|
|
|
|
|
|
|
|
|
|
|
|
|
| Americas - North America & South America; EMEA - Europe, Middle East & Africa; APAC - Asia Pacific & Australian Continent |
|
|
|
|
|
|
|
|
|
|
|
|
|
|
|
|
|
|
|
|
|
|
|
|
Non-GAAP Financial Information
To supplement our financial results presented in accordance with GAAP, this release includes the following measures defined by the Securities and Exchange Commission as non-GAAP financial measures: pro forma effective tax rate, pro forma net income (earnings) per share and free cash flow. These non-GAAP measures are not based on any comprehensive set of accounting rules or principles and should not be considered a substitute for, or superior to, financial measures calculated in accordance with GAAP, and may be different from non-GAAP measures used by other companies, limiting the usefulness of the measures for comparison with other companies. Management believes providing investors with an operating view consistent with how it manages the Company provides enhanced transparency into the operating results of the Company, as described in more detail by category below.
The tables below provide reconciliations between the GAAP and non-GAAP measures.
Pro forma effective tax rate
The Company's income tax expense is occasionally impacted by discrete tax items that are not reflective of income tax expense incurred as a result of current period earnings. Therefore, management believes the effective tax rate and income tax provision before the effect of certain discrete tax items are important measures to permit investors' consistent comparison between periods. In the first three quarters of 2026 and 2025 there were no such discrete tax items identified.
Pro forma net income (earnings) per share
Management believes net income (earnings) per share before the impact of foreign currency gains or losses and certain discrete income tax items, as discussed above, is an important measure to permit a consistent comparison of the Company's performance between periods.
|
|
|
|
|
|
|
|
|
|
|
|
|
|
|
|
|
| (In thousands, except per share information) |
|
13-Weeks Ended |
|
|
|
|
|
|
|
39-Weeks Ended |
|
|
|
|
|
|
|
|
September 26, |
|
|
|
September 27, |
|
|
|
September 26, |
|
|
|
September 27, |
|
|
|
|
2026 |
|
|
|
2025 |
|
|
|
2026 |
|
|
|
2025 |
|
|
| GAAP net income |
|
$ |
541,661 |
|
|
$ |
401,615 |
|
|
$ |
1,488,660 |
|
|
$ |
1,135,206 |
|
| Foreign currency gains / losses(1) |
|
|
(9,788) |
|
|
|
(20,334) |
|
|
|
(10,417) |
|
|
|
(21,582) |
|
| Tax effect of foreign currency gains / losses(2) |
|
|
1,769 |
|
|
|
4,316 |
|
|
|
1,728 |
|
|
|
3,817 |
|
| Pro forma net income |
|
$ |
533,642 |
|
|
$ |
385,597 |
|
|
$ |
1,479,971 |
|
|
$ |
1,117,441 |
|
|
|
|
|
|
|
|
|
|
|
|
|
|
|
|
|
|
| GAAP net income per share: |
|
|
|
|
|
|
|
|
|
|
|
|
|
|
|
|
| Basic |
|
$ |
2.81 |
|
|
$ |
2.09 |
|
|
$ |
7.72 |
|
|
$ |
5.90 |
|
| Diluted |
|
$ |
2.80 |
|
|
$ |
2.08 |
|
|
$ |
7.69 |
|
|
$ |
5.87 |
|
|
|
|
|
|
|
|
|
|
|
|
|
|
|
|
|
|
| Pro forma net income per share: |
|
|
|
|
|
|
|
|
|
|
|
|
|
|
|
|
| Basic |
|
$ |
2.77 |
|
|
$ |
2.00 |
|
|
$ |
7.68 |
|
|
$ |
5.80 |
|
| Diluted |
|
$ |
2.76 |
|
|
$ |
1.99 |
|
|
$ |
7.65 |
|
|
$ |
5.77 |
|
|
|
|
|
|
|
|
|
|
|
|
|
|
|
|
|
|
| Weighted average common shares outstanding: |
|
|
|
|
|
|
|
|
|
|
|
|
|
|
|
|
| Basic |
|
|
192,836 |
|
|
|
192,464 |
|
|
|
192,782 |
|
|
|
192,510 |
|
| Diluted |
|
|
193,617 |
|
|
|
193,533 |
|
|
|
193,556 |
|
|
|
193,551 |
|
|
|
|
|
|
|
|
|
|
|
|
|
|
|
|
|
|
|
|
| (1) Foreign currency gains and losses for the Company are driven by movements of a number of currencies in relation to the U.S. Dollar and the related exchange rate impact on the significant cash, receivables, and payables held in a currency other than the functional currency at a given legal entity. However, there is minimal cash impact from such foreign currency gains and losses. |
|
|
|
| (2) The tax effect of foreign currency gains was calculated using the effective tax rates of 18.1% and 16.6% for the 13-weeks and 39-weeks ended September 26, 2026, respectively, and 21.2% and 17.7% for the 13-weeks and 39-weeks ended September 27, 2025, respectively. |
|
Free cash flow
Management believes free cash flow is an important liquidity measure because it represents the amount of cash provided by operations that is available for investing and defines it as operating cash flows less capital expenditures for property and equipment. Management believes excluding purchases of property and equipment provides a better understanding of the underlying trends in the Company's operations and allows more accurate comparisons of the Company's results between periods. This metric may also be useful to investors but should not be considered in isolation as it is not a measure of cash flow available for discretionary expenditures. The most comparable GAAP measure is net cash provided by operating activities.
|
|
|
|
|
|
|
|
|
|
|
|
|
|
|
|
|
| (In thousands) |
|
13-Weeks Ended |
|
|
|
|
|
|
|
39-Weeks Ended |
|
|
|
|
|
|
|
|
September 26, |
|
|
|
September 27, |
|
|
|
September 26, |
|
|
|
September 27, |
|
|
|
|
2026 |
|
|
|
2025 |
|
|
|
2026 |
|
|
|
2025 |
|
|
| Net cash provided by operating activities |
|
$ |
393,855 |
|
|
$ |
485,616 |
|
|
$ |
1,333,399 |
|
|
$ |
1,079,574 |
|
| Less: purchases of property and equipment |
|
|
(100,587) |
|
|
|
(60,483) |
|
|
|
(294,982) |
|
|
|
(146,273) |
|
| Free cash flow |
|
$ |
293,268 |
|
|
$ |
425,133 |
|
|
$ |
1,038,417 |
|
|
$ |
933,301 |
|
Forward-looking Financial Measures
The forward-looking measures in our 2026 guidance include certain economic assumptions such as foreign currency exchange rates and tariffs which are fluid and can rapidly change favorably or unfavorably.
The forward-looking financial measures in our 2026 guidance provided above do not consider the potential future net effect of foreign currency exchange gains and losses, certain discrete tax items and any other impacts that may be identified as pro forma adjustments in calculating the non-GAAP measures described above.
The estimated impact of foreign currency gains and losses cannot be reasonably estimated on a forward-looking basis due to the high variability and low visibility with respect to non-operating foreign currency exchange gains and losses and the related tax effects of such gains and losses. The impact on diluted net income per share of foreign currency gains and losses, net of tax effects, was $0.04 per share for the 39-week period ended September 26, 2026.
At this time, management is unable to determine whether or not significant discrete tax items will occur in fiscal 2026, estimate the impact of any such items, or anticipate the impact of any other events that may be considered in the calculation of non-GAAP financial measures.
 View original content to download multimedia:https://www.prnewswire.com/news-releases/garmin-announces-third-quarter-2026-results-302921655.html
SOURCE Garmin Ltd.
View All News