3Q 2026 Webcast October 28, 2026 © 2026 GE Vernova and/or its affiliates. All rights reserved. GE and the GE Monogram are trademarks of General Electric Company used under trademark license 1 Caution concerning forward-looking statements: Certain…
3Q 2026 Webcast
October 28, 2026
© 2026 GE Vernova and/or its affiliates. All rights reserved.
GE and the GE Monogram are trademarks of General Electric Company used under trademark license
1
Caution concerning forward-looking statements:
Certain statements contained in this presentation may constitute “forward-looking statements” that involve risks and uncertainties. These statements by their nature address
matters that are uncertain to different degrees. Forward-looking statements provide current expectations of future events based on certain assumptions and include any
statement that does not directly relate to any historical or current fact. Words such as “anticipates,” “believes,” “will,” “expects,” “estimates,” “intends,” “guidance,” “outlook,”
“plans,” “projects,” and similar expressions, may identify such forward-looking statements. Any forward-looking statement in this presentation speaks only as of the date on
which it is made.
Although we believe that the forward-looking statements contained in this presentation are based on reasonable assumptions, you should be aware that many factors could
affect our and Trench Group’s actual financial results, cash flows, or results of operations and our proposed Trench Group acquisition, including expected benefits, costs, and
closing, and could cause actual results to differ materially from those in such forward-looking statements. These factors may cause our actual future results to be materially
different than those expressed in our forward-looking statements, and are more fully discussed in our most recent Annual Report on Form 10-K and in any subsequent
Quarterly Report on Form 10-Q of ours, including in the “Risk Factors,” “Management's Discussion and Analysis of Financial Condition and Results of Operations,” and
“Forward-Looking Statements” sections included therein, as may be updated from time to time in our filings with the U.S. Securities and Exchange Commission (SEC) and as
posted on our website at www.gevernova.com/investors/fls.
There may be other factors not presently known to GE Vernova or which we currently consider to be immaterial that could cause our and Trench Group’s actual results and
our proposed Trench Group acquisition, including expected benefits, costs, and closing, to differ materially from those projected in any forward-looking statement that we
make. We do not undertake any obligation to update or revise our forward-looking statements except as required by applicable law or regulation. This presentation also
includes certain forward-looking projected financial information that is based on current estimates and forecasts. Actual results could differ materially.
Non-GAAP financial measures:
In this presentation, we sometimes use information derived from consolidated financial data but not presented in our financial statements prepared in accordance with U.S.
generally accepted accounting principles (GAAP). Certain of these data are considered “non-GAAP financial measures” under the SEC rules. In addition, we also provide nonGAAP financial measures for the Trench Group business. The non-GAAP financial measures supplement our GAAP disclosures and should not be considered an alternative to
the GAAP measure. The reasons we use these non-GAAP financial measures and the reconciliations to their most directly comparable GAAP financial measures are included in
our earnings press release and in the appendix of this presentation, as applicable.
Additional Information:
GE Vernova’s Investor Relations website at https://www.gevernova.com/investors contains a significant amount of information about GE Vernova, including financial and other
information for investors. GE Vernova encourages investors to visit this website from time to time, as information is updated and new information is posted. Investors are also
encouraged to visit GE Vernova’s LinkedIn and other social media accounts, which are platforms on which the Company posts information from time to time.
Trench Group Acquisition Price and Financial Information:
The Trench Group acquisition price and financial information presented in this presentation are expressed in U.S. dollar equivalents based on a EUR/USD exchange rate of
1.12. Actual U.S. dollar equivalent amounts may differ based on the prevailing EUR/USD exchange rate at the applicable times. The Trench Group financial information was
prepared by GE Vernova based on data provided by Trench Group and reflect Trench Group's accounting policies, which may differ from GE Vernova's.
© 2026 GE Vernova and/or its affiliates. All rights reserved.
1
Opportunity to create value is accelerating
Growth continues to accelerate across our existing and new offerings
Margin expansion to date is encouraging … expect substantially more ahead
Significant cash generation and a strong balance sheet ... investing for growth, profitable
returns, and long-term competitiveness
• Signed agreement to acquire Trench Group, a global leader in high-voltage equipment
• Board authorized an increase in share repurchase program, from $10B to $20B
Building a unique company to serve growing demand and deliver for shareholders
© 2026 GE Vernova and/or its affiliates. All rights reserved.
33
Trench Group Acquisition
© 2026 GE Vernova and/or its affiliates. All rights reserved.
GE and the GE Monogram are trademarks of General Electric Company used under trademark license
4
Acquiring Trench Group, a strategic addition
Brings differentiated technology & scale for high-voltage solutions
Strengthens ability to serve customers in high-voltage market reaching ~$130B by ’30-a)
Vertically integrates an existing supplier; increases capacity for key grid equipment
Strong management team; broad & deep customer relationships with utilities & hyperscalers
$9.0B purchase price / 13x ’28 adjusted EBITDA*-b) with expected late ’27 close
Expands our capabilities and product portfolio in Electrification
- Non-GAAP Financial Measure | (a- high-voltage equipment serviceable addressable market (SAM), considering BNEF, IEA, and internal GE Vernova estimates | (b – excluding synergies
© 2026 GE Vernova and/or its affiliates. All rights reserved.
5
Increasing scale with differentiated technology
Key products that strengthen our portfolio
2026E Revenue by Product
Bushings
$0.6B
$0.1B
Instrument
Transformers
$0.5B
$0.2B
Connection
Measurement
Coils
$0.3B
$0.1B
Total
$1.4B
$0.3B
Reliability
Bushings for high voltage direct current (HVDC)
and alternating current (AC) transformers …
reaching voltages up to 1,200kV to enable
more efficient, large-scale transmission
Instrument transformers covering AC and
HVDC voltage ranges … including more
sustainable offerings
Broad range of medium and high voltage coils
with advanced applications to enhance grid
reliability and power quality
Proven and high-quality products
© 2026 GE Vernova and/or its affiliates. All rights reserved.
Accelerating development of high-voltage solutions
Trench’s products are key components in the growing
high-voltage equipment market
Market increasing for these products and solutions
~8%–a) annually to ~$130B in 2030
Bushings
Instrument
Transformers
Power
Transformers
Switchgear
HVDC
Systems
Substations
Stability
Solutions
✔
✔
✔
✔
✔
✔
✔
✔
✔
✔
✔
✔
Coils
Why customers benefit
• Enables the design and development of
more optimized, integrated solutions
• Improves lead times through combined
global footprint and joint operations
• Increases our capabilities to serve 765 kV
high-voltage transmission build-out in U.S.
• Expands Trench Group’s reach in select
regions, including India, Southeast Asia, &
Middle East
Better positioning Electrification to serve increasing demand
(a- 8% is compounded annual growth rate of the high-voltage serviceable addressable market (SAM), considering BNEF, IEA, and internal GE Vernova estimates, using a 2025 estimate of $90B high-voltage SAM
© 2026 GE Vernova and/or its affiliates. All rights reserved.
7
Enhances Electrification’s two largest businesses
3Q’26 Backlog of $46B-a)
Broad Suite of Offerings
Grid Systems Integration (GSI)
• HVDC systems and substations, including key data
center solutions
Power Transmission (PT)
• Switchgear, transformers, and capacitors to expand and
modernize the grid
Power Conversion & Storage (PC&S)
• Equipment to improve grid resiliency by addressing
intermittency and growing electro-intensive demand
Grid Automation & Software (GA&S)
• Grid monitoring products and enhanced digitization to
drive more predictive and autonomous grid management
Trench Group expands and increases our
capabilities in GSI & PT
• Greater incorporation of technologically
advanced products, including high voltage
direct current (HVDC) bushings and coils,
into our GSI solutions
• Strengthens PT with differentiated
technology for higher-voltage bushings
and instrument transformers
• Improves supply-chain certainty and
delivery lead times for critical high-voltage
equipment
• Increases capacity by adding a global and
growing footprint
Further enabling our ability to grow and deliver our backlog
(a - Electrification segment backlog defined as remaining performance obligation (RPO)
© 2026 GE Vernova and/or its affiliates. All rights reserved.
8
Financial Profile
$B
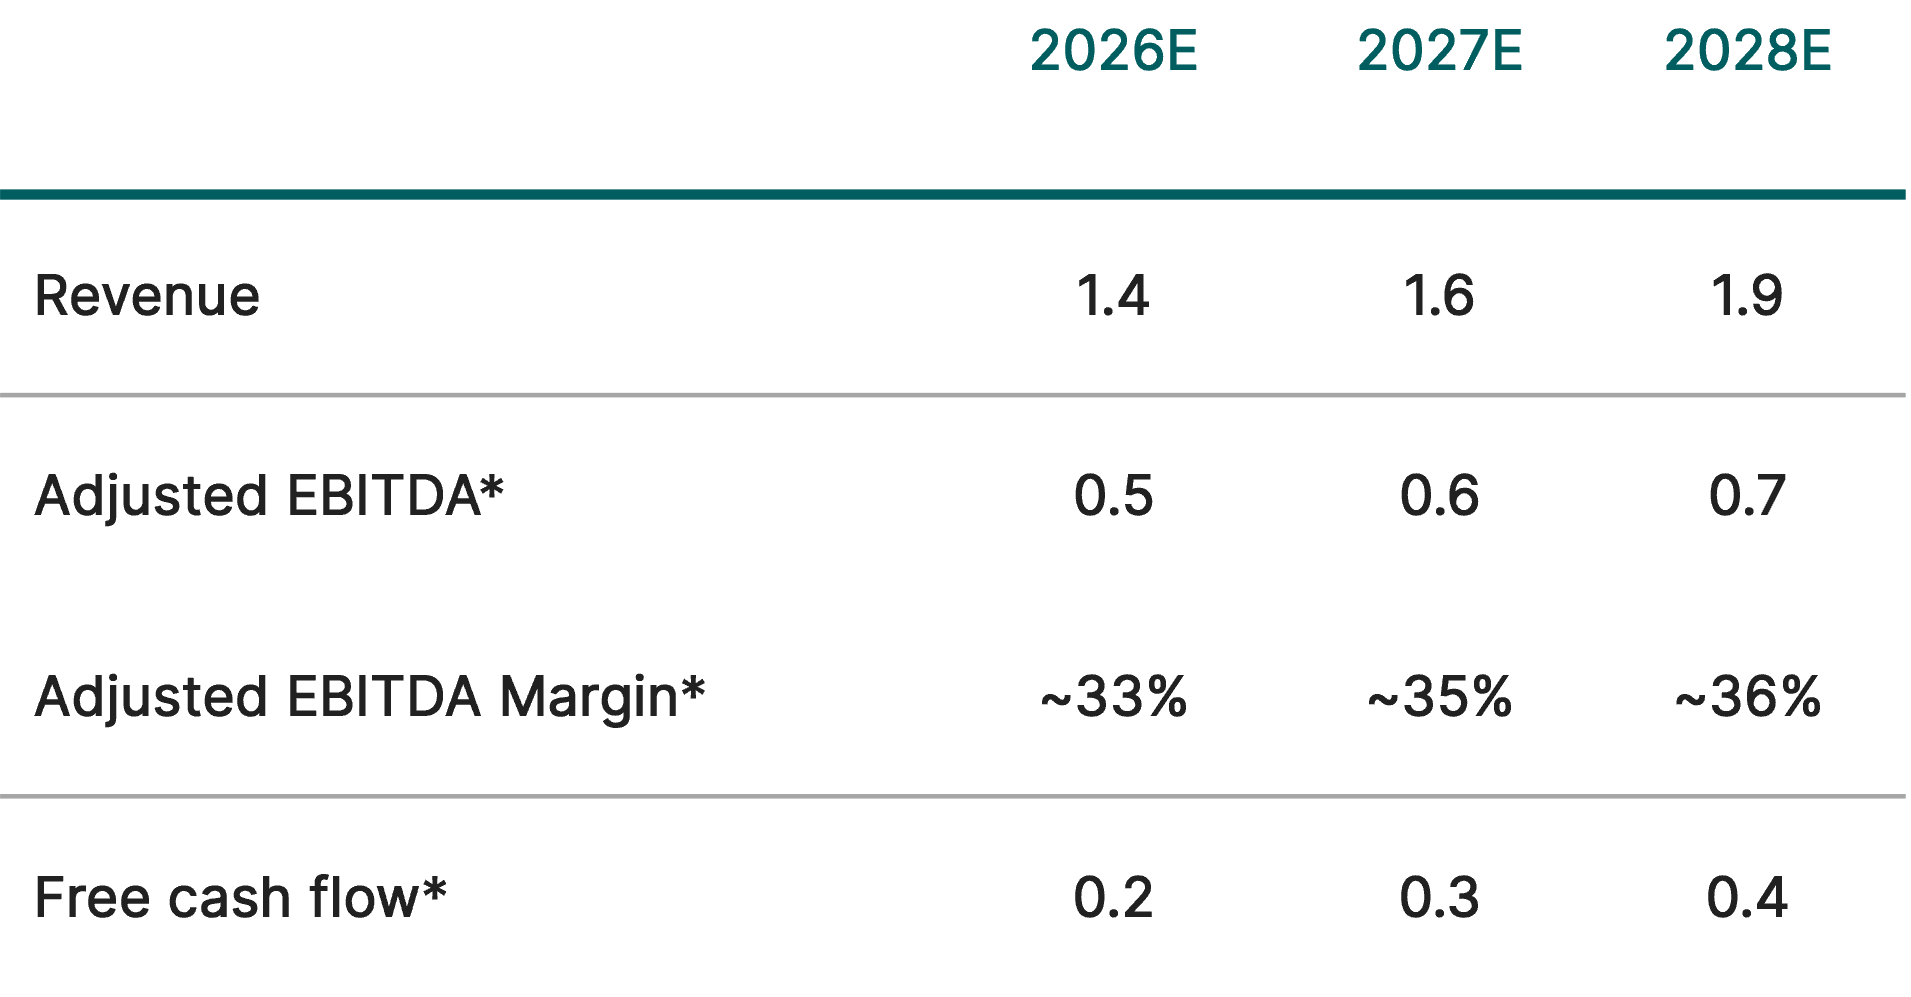
Standalone Trench Group financials
2026E
2027E
Transaction highlights
2028E
•
$9.0B purchase price
•
Currently expect to fund with ~50% cash and ~50% debt
•
Anticipate annual interest cost of ~$0.2B
Revenue
1.4
1.6
1.9
Adjusted EBITDA*
0.5
0.6
0.7
•
Committed to maintain investment grade balance sheet
Adjusted EBITDA Margin*
~33%
~35%
~36%
•
Debt to adj. EBITDA* ratio expected to remain <1X
Free cash flow*
0.2
0.3
0.4
~$5B in backlog and framework agreements-a) as of 3Q’26
•
Revenue growth supported by planned capacity expansions
•
Purchase price reflects 13x ’28 adjusted EBITDA*, with an
expected late ’27 close
Double-digit revenue CAGR-b)
High growth and accretive acquisition before synergies
- Non-GAAP Financial Measure | (a- Includes $2.6B in backlog, which is defined as remaining performance obligation (RPO) | (b- compound annual growth rate from 2026 through 2028
© 2026 GE Vernova and/or its affiliates. All rights reserved.
9
Potential acquisition synergies
Cost synergies
Upside from revenue synergies
• Implement combined manufacturing expertise
• Broaden relationships across complementary
customers, especially in North America
• Expand lean to increase productivity
• Leverage joint sourcing efforts
• Further utilize best-cost locations
• Grow Trench’s revenues using GEV
commercial capabilities in India, Southeast
Asia & Middle East
• Localize and increase production of Trench’s
offerings, including at GEV sites
Cost synergies of ~$50-100M by 2030, with additional revenue synergies expected
© 2026 GE Vernova and/or its affiliates. All rights reserved.
10
Executing our capital allocation strategy
Trench Group, an attractive acquisition
• Provides scale and capabilities in Electrification
• High visibility into long-term, profitable growth; immediately accretive to margins and cash flow
Electrification team delivering solid results
• Further building backlog, driving strong revenue growth, and significantly expanding margins
• Prolec integration progressing well; successfully driving revenue and cost synergies
Aligns with our disciplined capital allocation priorities
• Investing organically for profitable growth
• Returning significant capital to shareholders while maintaining a strong balance sheet
• Enhancing our core businesses through strategic M&A
© 2026 GE Vernova and/or its affiliates. All rights reserved.
11
11
3Q 2026
Financial Results & Outlook
© 2026 GE Vernova and/or its affiliates. All rights reserved.
GE and the GE Monogram are trademarks of General Electric Company used under trademark license
12
Strong year-to-date performance
Continued backlog growth, reaching nearly $200B at improved margins
Solid execution across all three segments
Developing and commercializing innovative new products
Raising 2026 guidance and further strengthening our financial position
Substantial opportunity today and for the long-term
© 2026 GE Vernova and/or its affiliates. All rights reserved.
13
Financial Snapshot
$ in billions
3Q’26 Dynamics-b)
3Q'25
3Q'26 ‘25 YTD ‘26 YTD
Orders
14.6
29.3
Backlog-a)
135.3
196.7
Revenue
10.0
12.6
27.1
33.1
Adjusted EBITDA*
0.8
1.9
2.0
Adjusted EBITDA
Margin*
8.1%
15.4%
7.5%
+1.1 Year-over-year growth and expansion driven by price, more profitable
12.4% 690bps volume, and productivity
Free cash flow
(FCF)*
0.7
5.4
1.9
15.3
37.1
71.8
+96%
Robust growth in both equipment and services
+61.5
Significant equipment growth at Power and Electrification, as well as
services, driven by Power
+18%
Increased equipment revenue at Power and Electrification, along with
higher services revenue, more than offset lower Wind equipment revenue
4.1
+4.7
Higher positive benefits from working capital and stronger adj. EBITDA*
partially offset by cash taxes, capex, and a voluntary payment for retiree
benefits
Significant growth, margin expansion, and FCF* with increasing backlog-a)
- Non-GAAP Financial Measure; YTD = year-to-date and refers to the nine-months ending September 30
(a - defined as remaining performance obligation (RPO)
(b - year-over-year variances and commentary for orders, revenue, & adj. EBITDA margin are presented on an organic basis; organic revenue & adj. organic EBITDA margin are non-GAAP financial measures
© 2026 GE Vernova and/or its affiliates. All rights reserved.
14
Power
3Q’26 Dynamics-a)
21.4%
EBITDA
Margin
19.0%
Revenue increased 25%, led by Gas Power from higher
equipment volume and favorable pricing
13.9%
13.4%
3,139
EBITDA margin expanded as higher price and volume more
than offset inflation as well as additional expenses to support
capacity and R&D investments
FY’26 Guidance-a)
1,954
EBITDA
($M)
651
Orders robust, increasing 178%, led by strength in Gas Power
equipment and services, driven by higher volume and price
1,297
3Q'25
3Q'26
‘25YTD
‘26YTD
Orders ($B)
7.8
21.8
21.2
48.5
Revenue ($B)
4.9
6.1
14.1
16.5
Backlog-b) ($B)
84.2
130.9
Organic revenue* growth of 19% - 21%
19% - 21% segment EBITDA margin
Robust demand growth, increased revenue & EBITDA margin
(a – year-over-year variance commentary for orders, revenue, and EBITDA margin are presented on an organic basis; organic revenue and organic EBITDA margin are non-GAAP financial measures
(b – defined as remaining performance obligation (RPO)
YTD = year-to-date and refers to the nine-months ending September 30
© 2026 GE Vernova and/or its affiliates. All rights reserved.
15
Electrification
EBITDA
Margin
3Q’26 Dynamics-a)
19.1%
15.1%
18.5%
13.8%
Orders strong, approximately 1.4 times revenue due to
growing grid equipment demand
Revenue increased 16%, from growth in substations, HVDC
equipment, and switchgear
EBITDA
($M)
387
739
1,939
Significant EBITDA margin expansion with strong volume,
productivity, and favorable pricing
FY’26 Guidance-a)
906
3Q'25
3Q'26
‘25YTD
‘26YTD
Orders ($B)
5.1
5.4
11.7
18.8
Revenue ($B)
2.6
3.9
6.6
10.5
Backlog-b) ($B)
29.8
46.1
$14.5B - $15.0B of revenue, including ~$3.1B from Prolec
18% - 20% segment EBITDA margin, trending toward higher end
Significant revenue growth & EBITDA margin expansion while further increasing backlog-b)
(a – year-over-year variance commentary for revenue and EBITDA margin are presented on an organic basis; organic revenue and organic EBITDA margin are non-GAAP financial measures
(b – defined as remaining performance obligation (RPO)
YTD = year-to-date and refers to the nine-months ending September 30
© 2026 GE Vernova and/or its affiliates. All rights reserved.
16
Wind
2.6%
EBITDA
($M)
(61)
3Q’26 Dynamics-a)
72
(2.3)%
Wind orders increased 16% with growth in Onshore Wind
equipment and services, primarily in North America
(373)
(585)
EBITDA
Margin
(5.5)%
Revenue increased 3% due to higher Onshore Wind services and
Offshore Wind equipment, partially offset by lower Onshore Wind
equipment deliveries
Delivered positive EBITDA, improving y/y due to lower Offshore
Wind project costs and improved Onshore Wind performance,
despite the impact of lower deliveries
(9.4)%
3Q'25
3Q'26
‘25YTD
‘26YTD
Orders ($B)
1.8
2.1
4.5
4.6
Revenue ($B)
2.6
2.7
6.7
6.2
Backlog-b) ($B)
21.5
20.0
FY’26 Guidance-a)
Organic revenue* down mid-single digits
$400M - $500M of segment EBITDA losses
Performance improving, driving a profitable quarter
(a – year-over-year variance commentary for orders, revenue, and EBITDA are presented on an organic basis; organic revenue and organic EBITDA are non-GAAP financial measures
(b – defined as remaining performance obligation (RPO)
YTD = year-to-date and refers to the nine-months ending September 30
© 2026 GE Vernova and/or its affiliates. All rights reserved.
17
Raising 2026 guidance
Power
• Organic revenue* growth of 19% - 21%
GE Vernova
July 22nd
October 28th
REVENUE
$45.5B - $46.5B
$46.5B - $47.5B
ADJUSTED
EBITDA MARGIN*-a)
12% - 14%
13.5% - 14.5%
FREE CASH FLOW*
$11.5B - $12.5B
$16B - $17B
(previous 18%-20%)
• 19% - 21% segment EBITDA margin
(previous 17%-19%)
Electrification
• $14.5B - $15.0B of revenue, including
~$3.1B from Prolec
• 18% - 20% segment EBITDA margin, now
trending toward higher end
Wind
• Organic revenue* down mid-single digits
(previous down low-double digits)
• $400M - $500M of segment EBITDA losses
(previous ~$400M of segment EBITDA losses)
(a – includes $(450)M - $(500)M of Corporate and other costs
Expecting additional growth in revenue and higher adjusted EBITDA margin* and FCF* in 2026
- Non-GAAP Financial Measure
© 2026 GE Vernova and/or its affiliates. All rights reserved.
18
Wrap-Up
Executing well in early stages of multi-year growth opportunity
Investing for near-, mid-, and long-term returns
Working with humility, confidence and conviction to deliver for all stakeholders
Our potential continues to grow
© 2026 GE Vernova and/or its affiliates. All rights reserved.
19
Q&A
Construction on the GE Vernova Hitachi BWRX-300
continues to progress at Ontario Power Generation’s
Darlington site.
© 2026 GE Vernova and/or its affiliates. All rights reserved.
GE Vernova's solid-state transformer prototype at our
lab in Malta, New York.
In October, GE Vernova signed an agreement to acquire
Trench Group, strengthening its offerings of highvoltage grid equipment, including bushings.
20
Appendix
© 2026 GE Vernova and/or its affiliates. All rights reserved.
GE and the GE Monogram are trademarks of General Electric Company used under trademark license
21
Trench Group transaction overview
Va lua t io n
F ina nc ing
B a la nc e
&
S he e t
I mp a c t
F ina nc ia l
I mp a c t
T ime line
•
$9.0B purchase price
•
13x 2028E adjusted EBITDA*, before synergies
•
Transaction not subject to any financing conditions
•
Currently expect to fund with ~50% cash and ~50% debt
•
GE Vernova will remain in a significant net cash position; Debt to adj. EBITDA* ratio expected to remain <1X
•
Accretive to adjusted EBITDA margin* and free cash flow*, before synergies
•
Expect to grow output through incremental capex investment
•
Subject to customary regulatory approvals and to information and consultation requirements
•
Transaction expected to close late 2027
- Non-GAAP Financial Measure
© 2026 GE Vernova and/or its affiliates. All rights reserved.
1
Electrification’s pro-forma footprint
50+
Manufacturing sites
And a presence in
60+
countries
Manufacturing sites
Electrification
Prolec
Trench Group
Site mapping does not include non-consolidated JV locations
© 2026 GE Vernova and/or its affiliates. All rights reserved.
23
High-voltage electrification market to reach ~$130B by ‘30
Global high-voltage equipment market
Demand Drivers
Serviceable addressable market-a), $B
Stability Solutions
• New generation additions require incremental
grid equipment, including data centers
~8%
CAGR
HVDC Systems
Substations
Switchgear
• Increasing need for grid modernization and
upgrades
Power Transformers
• Higher intermittency, driven by renewable
energy
• Expanding use of long-distance transmission
solutions
2030
2025
North
America
Europe
Asia
ROW
CAGR (’25-’30)
~9%
~7%
~7%
~6%
% of ’30 investment
~34%
~23%
~19%
~24%
• Increasing stability and flexibility
requirements
Demand rising globally requires significant customer investment
(a- 8% is compounded annual growth rate of the high-voltage serviceable addressable market (SAM), considering BNEF, IEA, and internal GE Vernova estimates
© 2026 GE Vernova and/or its affiliates. All rights reserved.
24
Bushings
Bushings
Power
Transformers
Switchgear
HVDC
Systems
Substations
Stability
Solutions
✔
✔
✔
✔
✔
Select Trench Offerings
Generator
bushings up to 36
kV / 50,000 A
Resin Impregnated
Paper (RIP)
transformer bushings
up to 1,200kV
Wall bushings up to
800kV
Gas-Insulated
Switchgear bushings
up to 550kV
Components that facilitate safe transfer of
high-voltage power into and out of
transformers, switchgear, and substations
Quality is essential for reliability, as poor
bushing performance can create cascading
effects across grid equipment
Trench’s expertise enables manufacturing of
high performing bushings at voltage levels
among the highest in the industry
Connects electrical equipment
© 2026 GE Vernova and/or its affiliates. All rights reserved.
Instrument transformers
Power
Transformers
Instrument
Transformers
Switchgear
HVDC
Systems
Substations
Stability
Solutions
✔
✔
✔
✔
Select Trench Offerings
Current transformers
up to 800 kV
Combined current /
voltage transformers
up to 800 kV
Instrument transformers act as the grid’s
sensory system, monitoring electricity flow
for system safety, reliability, and stability
Instrument
transformers for GIS
up to 800 kV
Precise, real-time measurement prevents
faults that can damage electrical equipment
in an increasingly complex system
Voltage transformers
up to 800 kV
Trench offers advanced measurement
technology that supports the highest-voltage
transmission corridors being built
Advanced measurement and monitoring capabilities
© 2026 GE Vernova and/or its affiliates. All rights reserved.
Coils
Power
Transformers
Switchgear
Coils
HVDC
Systems
Substations
Stability
Solutions
✔
✔
✔
Equipment that manages the flow of
electricity, shielding important grid assets
from surges, faults, and voltage instability
Select Trench Offerings
Air-core dry type
reactors
Line Traps
Coils and reactors improve long-distance
transmission stability and can reduce line
losses
High-voltage shunt
reactors
Earth fault
detection systems
27
Trench’s advanced materials and product
design provide efficiency and reduce firerelated risk
Increases system reliability
© 2026 GE Vernova and/or its affiliates. All rights reserved.
Financial trending metrics
Orders ($M)
1Q'25
2Q'25
3Q'25
4Q'25
1Q'26
2Q'26
3Q'26
3Q'26 y/y %
(organic)
Total Orders
10,152
12,364
14,608
22,192
18,279
24,216
29,318
96 %
Equipment
5,760
7,808
10,039
16,175
12,753
18,941
24,296
134 %
Services
4,392
4,555
4,569
6,017
5,526
5,275
5,022
10 %
Revenues ($M)
1Q'25
2Q'25
3Q'25
4Q'25
1Q'26
2Q'26
3Q'26
3Q'26 y/y %
(organic)*
Total Revenues
8,032
9,111
9,969
10,956
9,339
11,104
12,642
18%
Equipment
4,197
4,894
5,880
5,963
5,254
6,459
8,340
26%
Services
3,835
4,217
4,089
4,993
4,084
4,645
4,302
6%
RPO ($M)
1Q'25
2Q'25
3Q'25
4Q'25
1Q'26
2Q'26
3Q'26
3Q'26 y/y %
Total RPO
123,438
128,650
135,269
150,238
163,276
176,284
196,721
45%
Equipment
45,478
49,712
54,092
64,245
75,924
87,821
104,054
92%
Services
77,959
78,938
81,177
85,993
87,352
88,463
92,667
14%
- Non-GAAP Financial Measure
© 2026 GE Vernova and/or its affiliates. All rights reserved.
28
Financial trending metrics by segment
3Q'26 y/y %
(organic)*
Power ($M)
1Q'25
2Q'25
3Q'25
4Q'25
1Q'26
2Q'26
3Q'26
Segment Revenue
Equipment
Services
Segment EBITDA
Segment EBITDA margin
4,449
1,491
2,958
517
11.6%
4,785
1,504
3,280
785
16.4%
4,863
1,744
3,119
651
13.4%
5,776
1,946
3,830
982
17.0%
4,971
1,885
3,086
811
16.3%
5,477
1,965
3,512
1,031
18.8%
6,067
2,870
3,197
1,297
21.4%
830bps
Electrification ($M)
1Q'25
2Q'25
3Q'25
4Q'25
1Q'26
2Q'26
3Q'26
3Q'26 y/y %
(organic)*
Segment Revenue
Equipment
Services
Segment EBITDA
Segment EBITDA margin
1,840
1,391
448
205
11.1%
2,162
1,673
488
314
14.5%
2,565
2,035
530
387
15.1%
2,921
2,279
642
494
16.9%
2,959
2,501
459
528
17.8%
3,637
3,130
507
671
18.4%
3,862
3,377
485
739
19.1%
470bps
Wind ($M)
1Q'25
2Q'25
3Q'25
4Q'25
1Q'26
2Q'26
3Q'26
3Q'26 y/y %
(organic)*
Segment Revenue
1,850
1,412
438
(146)
(7.9)%
2,245
1,797
448
(165)
(7.3)%
2,647
2,203
445
(61)
(2.3)%
2,368
1,839
529
(225)
(9.5)%
1,432
889
543
(382)
(26.7)%
2,026
1,395
632
(275)
(13.6)%
2,741
2,121
620
72
2.6%
Equipment
Services
Segment EBITDA
Segment EBITDA margin
25%
65%
2%
16%
21%
(5)%
3%
(4)%
40%
420bps
- Non-GAAP Financial Measure
© 2026 GE Vernova and/or its affiliates. All rights reserved.
29
Power: key performance metrics
Orders ($M)
Equipment
Services
Total Orders
3Q'25
4,448
3,384
7,832
3Q'26
17,973
3,807
21,780
y/y % (organic)
304%
12%
178%
RPO ($M)
Equipment
Services
Total RPO
3Q'25
18,977
65,239
84,216
3Q'26
54,422
76,431
130,854
y/y %
187%
17%
55%
Segment Revenues and EBITDA ($M)
Gas Power
Nuclear Power
Hydro Power
Total Segment Revenues
Equipment
Services
Total Segment Revenues
Segment EBITDA
Segment EBITDA margin
3Q'25
3,948
664
251
4,863
1,744
3,119
4,863
651
13.4%
3Q'26 y/y % (organic)*
5,117
719
231
6,067
25%
2,870
65%
3,197
2%
6,067
25%
1,297
21.4%
830bps
3Q'25 YTD
10,810
10,394
21,204
3Q'26 YTD
36,234
12,282
48,516
y/y % (organic)
235%
18%
128%
3Q'25 YTD
11,464
1,975
658
14,097
4,740
9,357
14,097
1,954
13.9%
3Q'26 YTD
13,610
2,294
613
16,516
6,721
9,796
16,516
3,139
19.0%
y/y % (organic)*
17%
41%
4%
17%
560bps
- Non-GAAP Financial Measure
YTD = year-to-date and refers to the nine-months ending September 30
© 2026 GE Vernova and/or its affiliates. All rights reserved.
30
Electrification: key performance metrics
Orders ($M)
Equipment
Services
Total Orders
3Q'25
4,468
601
5,069
3Q'26
4,826
545
5,371
y/y % (organic)
(10)%
(7)%
(9)%
RPO ($M)
Equipment
Services
Total RPO
3Q'25
26,455
3,317
29,772
3Q'26
42,204
3,943
46,148
y/y %
60%
19%
55%
Segment Revenues and EBITDA ($M)
Power Transmission
Grid Systems Integration
Power Conversion & Storage
Grid Automation & Software
Total Segment Revenues
Equipment
Services
Total Segment Revenues
Segment EBITDA
Segment EBITDA margin
3Q'25
811
677
621
456
2,565
2,035
530
2,565
387
15.1%
3Q'26 y/y % (organic)*
1,868
1,002
569
424
3,862
16%
3,377
21%
485
(5)%
3,862
16%
739
19.1%
470bps
3Q'25 YTD
10,023
1,695
11,717
3Q'26 YTD
16,915
1,915
18,831
y/y % (organic)
43 %
14 %
39 %
3Q'25 YTD
2,262
1,646
1,413
1,246
6,566
5,100
1,466
6,566
906
13.8 %
3Q'26 YTD
y/y % (organic)*
5,124
2,499
1,585
1,251
10,459
24 %
9,008
31 %
1,451
(1) %
10,459
24 %
1,939
18.5 %
570bps
- Non-GAAP Financial Measure
YTD = year-to-date and refers to the nine-months ending September 30
© 2026 GE Vernova and/or its affiliates. All rights reserved.
31
Wind: key performance metrics
Orders ($M)
Equipment
Services
Total Orders
3Q'25
1,220
613
1,833
3Q'26
1,460
680
2,140
y/y % (organic)
18%
11%
16%
RPO ($M)
Equipment
Services
Total RPO
3Q'25
8,782
12,726
21,508
3Q'26
7,584
12,368
19,952
y/y %
(14)%
(3)%
(7)%
Segment Revenues and EBITDA ($M)
Onshore Wind
Offshore Wind
Total Segment Revenues
Equipment
Services
Total Segment Revenues
Segment EBITDA
Segment EBITDA margin
3Q'25
2,453
195
2,647
2,203
445
2,647
(61)
(2.3)%
3Q'26 y/y % (organic)*
2,468
273
2,741
3%
2,121
(4)%
620
40%
2,741
3%
72
2.6%
420bps
3Q'25 YTD
3,036
1,499
4,535
3Q'26 YTD
2,920
1,668
4,587
y/y % (organic)
(4) %
10 %
— %
3Q'25 YTD
6,118
624
6,742
5,412
1,331
6,742
(373)
(5.5)%
3Q'26 YTD
y/y % (organic)*
5,376
824
6,200
(9)%
4,405
(20) %
1,795
33 %
6,200
(9)%
(585)
(9.4)%
(360)bps
- Non-GAAP Financial Measure
YTD = year-to-date and refers to the nine-months ending September 30
© 2026 GE Vernova and/or its affiliates. All rights reserved.
32
Free cash flow* performance
FCF* ($M)
Net income (loss) (GAAP)
Adjustments to reconcile net income (loss) to cash from (used for) operating activities
Depreciation and amortization of property, plant, and equipment
Amortization of intangible assets
(Gains) losses on purchases and sales of business interests
Principal pension plans – net
Other postretirement benefit plans – net
Provision (benefit) for income taxes
Cash recovered (paid) during the year for income taxes
Changes in operating working capital:
Decrease (increase) in current receivables
Decrease (increase) in inventories, including deferred inventory costs
Decrease (increase) in current contract assets
Increase (decrease) in accounts payable and equipment project payables
Increase (decrease) in contract liabilities and current deferred income
All other operating activities
Cash from (used for) operating activities (GAAP)
Add: gross additions to property, plant and equipment and internal-use software
Free cash flow* (Non-GAAP)
Free cash flow conversion*-a)
3Q'25
453
3Q'26
1,289
y/y
835
3Q'25 YTD
1,209
3Q'26 YTD
6,687
y/y
5,478
152
61
(44)
(89)
(58)
293
(126)
200
239
(35)
(90)
(512)
493
(1,423)
48
178
8
(1)
(454)
200
(1,298)
446
177
(66)
(268)
(167)
514
(489)
548
650
(4,463)
(786)
(634)
1,123
(2,681)
102
474
(4,397)
(518)
(467)
609
(2,192)
(468)
(164)
(8)
359
558
61
980
(247)
732
162%
(824)
(308)
13
573
5,816
627
6,057
(647)
5,409
420%
(356)
(143)
21
214
5,257
566
5,077
(400)
4,677
563
(1,047)
(656)
566
2,419
(693)
2,508
(606)
1,902
157%
(1,667)
(2,052)
(345)
1,522
19,511
(675)
16,737
(1,430)
15,307
229%
(2,230)
(1,004)
311
956
17,092
17
14,229
(824)
13,405
- Non-GAAP Financial Measure
(a- Defined as free cash flow* divided by net income (loss)
YTD = year-to-date and refers to the nine-months ending September 30
© 2026 GE Vernova and/or its affiliates. All rights reserved.
33
Unit metrics: orders and sales
Orders
Gas Turbines
o Heavy-Duty Gas Turbines-a)
◦ HA-Turbines-b)
o Aeroderivatives-a)
Gas Turbines (GW)-d)
Wind Turbines-c)
Repower units
Wind Turbines and Repower (GW)-c),-d)
3Q'25
3Q'26
3Q'25 YTD
3Q'26 YTD
29
20
13
9
7.4
156
139
0.9
112
55
21
57
16.6
145
481
1.5
114
69
28
45
19.6
560
344
2.7
262
135
48
127
36.7
438
530
2.7
Sales
Gas Turbines
o Heavy-Duty Gas Turbines-a)
◦ HA-Turbines-b)
o Aeroderivatives-a)
Gas Turbines (GW)-d)
Wind Turbines-c)
Repower units
Wind Turbines and Repower (GW)-c),-d)
3Q'25
3Q'26
3Q'25 YTD
3Q'26 YTD
20
14
6
6
4.0
476
158
2.1
32
19
7
13
5.3
333
251
2.1
60
44
19
16
12.2
1,103
444
5.1
86
47
15
39
12.8
823
278
4.0
(a- Heavy-Duty Gas Turbines and Aeroderivatives are subsets of Gas Turbines
(b- HA-Turbines are a subset of Heavy-Duty Gas Turbines
(c- Includes Onshore and Offshore units
(d- Gigawatts reported associated with orders and sales in the periods presented
YTD = year-to-date and refers to the nine-months ending September 30
© 2026 GE Vernova and/or its affiliates. All rights reserved.
34
Share repurchase summary
In millions, except $ per share
Cumulative
Amount Number of Shares Average $ per
Repurchased ($)
Repurchased
share
Amount Number of Shares Average $ per
Repurchased ($)
Repurchased
share
4Q’24
3
0.0
337
3
0.0
337
1Q’25
1,204
4.0
303
1,207
4.0
303
2Q’25
379
1.2
317
1,586
5.2
306
3Q’25
658
1.1
600
2,243
6.3
357
4Q’25
1,075
1.9
566
3,319
8.2
406
1Q’26
1,295
1.8
720
4,613
10.0
462
2Q’26
2,350
2.5
952
6,963
12.5
559
3Q’26
1,630
1.7
949
8,593
14.2
607
October ‘26-a)
1,316
1.4
924
9,909
15.6
635
Largely completed our $10B authorization,
with 15.6M shares repurchased at an average price of ~$635 per share
(a- through October 23, 2026
© 2026 GE Vernova and/or its affiliates. All rights reserved.
35
Non-GAAP
reconciliations
© 2026 GE Vernova and/or its affiliates. All rights reserved.
GE and the GE Monogram are trademarks of General Electric Company used under trademark license
36
Non-GAAP reconciliations
Trench Group Adjusted EBITDA* and Adjusted EBITDA margin*
Trench Group’s Adjusted EBITDA* and Adjusted EBITDA margin* are non-GAAP financial measures and are forecasts of Trench Group as a standalone business prepared by GE Vernova based on data provided by Trench Group and
prepared under its accounting policies and exclude any expected synergies, integration costs, and purchase price accounting adjustments determined through due diligence. We believe that Trench Group’s Adjusted EBITDA* and
Adjusted EBITDA margin*, which are adjusted to exclude the effects of unique and/or noncash items that are not closely associated with ongoing operations, provide management and investors with meaningful measures of performance
that increase the period-to-period comparability by highlighting the results from ongoing operations and the underlying profitability factors. We believe Trench Group’s Adjusted EBITDA* and Adjusted EBITDA margin* provide additional
insight into how the business is expected to perform, on a normalized basis. However, Trench Group’s Adjusted EBITDA* and Adjusted EBITDA margin* should not be construed as inferring that Trench Group’s future results will be
unaffected by the items for which the measures adjust. We cannot provide a reconciliation of the differences between Trench Group’s expected Adjusted EBITDA* and Adjusted EBITDA margin* and the corresponding GAAP financial
measures without unreasonable effort due to the uncertainty and inherent difficulty of predicting the occurrence and financial impact of certain items, including the applicable tax rate, foreign exchange rates, the impacts of depreciation
and amortization, and changes to conform accounting to U.S. GAAP.
Trench Group free cash flow*
Trench Group’s free cash flow* is a non-GAAP financial measure and is a forecast of Trench Group as a standalone business prepared by GE Vernova based on data provided by Trench Group and prepared under its accounting policies
and exclude any expected synergies, integration costs, and purchase price accounting adjustments determined through due diligence. We cannot provide a reconciliation of the differences between Trench Group’s free cash flow* and
the corresponding GAAP financial measure without unreasonable effort, including due to the uncertainty of timing for capital expenditures, foreign exchange rates, and changes to conform accounting to U.S. GAAP.
2026 Guidance: Power organic revenue*
We cannot provide a reconciliation of the differences between the non-GAAP financial measures expectations and the corresponding GAAP financial measure of Power organic revenue* for 2026 without unreasonable effort due to the
uncertainty of foreign exchange rates.
2026 Guidance: Adjusted EBITDA margin*
We cannot provide a reconciliation of the differences between the non-GAAP financial measures expectations and the corresponding GAAP financial measures for adjusted EBITDA margin* in the 2026 guidance without unreasonable
effort due to the uncertainty of the costs and timing associated with potential restructuring actions and the impacts of depreciation and amortization.
2026 Guidance: Free cash flow*
We cannot provide a reconciliation of the differences between the non-GAAP financial measures expectations and the corresponding GAAP financial measure for free cash flow* in 2026 guidance without unreasonable effort due to the
uncertainty of timing for capital expenditures.
- Non-GAAP Financial Measure
© 2026 GE Vernova and/or its affiliates. All rights reserved.
37
Organic revenue*, Segment organic revenue*, Segment organic EBITDA* &
Segment organic EBITDA margin*
Three months ended September 30, ($ in millions)
2025
Power (GAAP)
Less: Acquisitions
Less: Business dispositions
Less: Foreign currency effect
Power organic* (Non-GAAP)
$
Electrification (GAAP)
Less: Acquisitions
Less: Business dispositions
Less: Foreign currency effect
Electrification organic* (Non-GAAP)
$
Wind (GAAP)
Less: Acquisitions
Less: Business dispositions
Less: Foreign currency effect
Wind organic* (Non-GAAP)
$
Total Company (GAAP)
Less: Acquisitions
Less: Business dispositions
Less: Foreign currency effect
Total Company organic* (Non-GAAP)
$
$
$
$
$
Revenues
2026
Equipment revenues
2025
2026
V%
V%
4,863 $
—
—
5
4,858 $
6,067
—
—
6
6,061
25%
$
25%
$
2,565 $
1
43
3
2,518 $
3,862
945
—
3
2,914
51%
$
16%
$
2,647 $
—
—
6
2,642 $
2,741
—
—
12
2,729
4%
$
3%
$
9,969 $ 12,642
1
945
43
—
14
22
9,911 $ 11,676
27%
$
18%
$
Services revenues
2025
2026
V%
1,744 $
—
—
—
1,744 $
2,870
—
—
(3)
2,874
65%
$
65%
$
2,035 $
—
—
3
2,033 $
3,377
921
—
4
2,452
66%
$
21%
$
2,203 $
—
—
6
2,197 $
2,121
—
—
15
2,106
(4)%
$
(4)%
$
5,880 $
—
—
9
5,871 $
8,340
921
—
16
7,404
42%
$
26%
$
2025
3,119 $
—
—
5
3,114 $
3,197
—
—
9
3,188
3%
$
2%
$
530 $
1
43
—
485 $
485
25
—
(1)
462
(8)%
$
(5)%
$
445 $
—
—
—
445 $
620
—
—
(3)
622
39%
$
40%
$
4,089 $
1
43
6
4,039 $
4,302
25
—
6
4,272
5%
$
6%
$
Segment EBITDA
2026
V%
Segment EBITDA Margin %
2025
2026
V%
99%
13.4%
21.4%
800 bps
105%
12.7%
21.0%
830 bps
91%
15.1%
19.1%
400 bps
57%
13.2%
17.9%
470 bps
651 $
—
—
33
619 $
1,297
—
—
27
1,271
387 $
(3)
60
(2)
332 $
739
212 (a)
—
7
521
(61) $
—
—
(45)
(17) $
72
—
—
(25)
97
218%
(2.3)%
2.6%
490 bps
671%
(0.6)%
3.6%
420 bps
811 $
(3)
60
(15)
770 $
1,943
210
—
12
1,721
140%
8.1%
15.4%
730 bps
124%
7.8%
14.7%
690 bps
(a) Includes $216 million of Prolec GE EBITDA. Prolec GE EBITDA is a non-GAAP financial measure, and is calculated by excluding depreciation and amortization of $(200) million, the impact of a fair value adjustment to Prolec GE,
certain integration costs and other of $(20) million from Prolec GE income (loss) before income taxes of $(5) million.
We believe Prolec GE EBITDA, which is adjusted to exclude the effects of unique and/or non-cash items that are not closely associated with ongoing operations, provide management and investors with meaningful measures of our
performance that increase the period-to-period comparability by highlighting results from ongoing operations and underlying profitability factors. We believe these measures provide additional insight into how our businesses are
performing, on a normalized basis.
We believe the organic measures presented above provide management and investors with a more complete understanding of underlying operating results and trends of established, ongoing operations by excluding the effect of
acquisitions, dispositions and foreign currency, which includes translational and transactional impacts, as these activities can obscure underlying trends.
- Non-GAAP Financial Measure
© 2026 GE Vernova and/or its affiliates. All rights reserved.
38
Organic revenue*, Segment organic revenue*, Segment organic EBITDA* &
Segment organic EBITDA margin*
Nine months ended September 30, ($ in millions)
2025
Revenues
2026
Power (GAAP)
Less: Acquisitions
Less: Business dispositions
Less: Foreign currency effect
Power organic* (Non-GAAP)
$ 14,097 $
—
—
12
$ 14,084 $
Electrification (GAAP)
Less: Acquisitions
Less: Business dispositions
Less: Foreign currency effect
Electrification organic* (Non-GAAP)
$
Wind (GAAP)
Less: Acquisitions
Less: Business dispositions
Less: Foreign currency effect
Wind organic* (Non-GAAP)
$
Total Company (GAAP)
Less: Acquisitions
Less: Business dispositions
Less: Foreign currency effect
Total Company organic* (Non-GAAP)
$
Equipment revenues
2025
2026
V%
V%
16,516
—
—
103
16,414
17%
$
17%
$
6,566 $ 10,459
1
2,291
125
26
16
182
6,424 $ 7,960
59%
$
24%
$
6,200
—
—
72
6,128
(8)%
$
(9)%
$
27,112 $ 33,084
1
2,291
125
26
11
356
$ 26,976 $ 30,411
22%
$
$
$
6,742 $
—
—
(18)
6,760 $
13%
Services revenues
2025
2026
V%
4,740 $
—
—
—
4,740 $
6,721
—
—
24
6,697
42%
$
41%
$
5,100 $
—
—
14
5,085 $
9,008
2,223
—
147
6,638
77%
$
31%
$
5,412 $
—
—
(18)
5,430 $
4,405
—
—
50
4,355
(19)%
$
(20)%
$
34%
$
14,971 $ 20,053
—
2,223
—
—
(4)
220
$ 14,975 $ 17,609
18%
9,357 $
—
—
13
9,344 $
9,796
—
—
78
9,717
1,466 $
1
125
2
1,339 $
2025
5%
$
4%
$
1,451
68
26
35
1,322
(1)%
$
(1)%
$
1,331 $
—
—
—
1,331 $
1,795
—
—
22
1,773
35%
$
33%
$
12,141 $
1
125
15
$ 12,001 $
13,031
68
26
136
12,801
7%
$
7%
$
Segment EBITDA
2026
1,954 $
1
—
65
1,888 $
3,139
2
—
15
3,122
V%
Segment EBITDA Margin %
2025
2026
V%
61%
13.9%
19.0%
510 bps
65%
13.4%
19.0%
560 bps
906 $
(3)
160
7
742 $
1,939
508 (a)
54
(4)
1,381
114%
13.8%
18.5%
470 bps
86%
11.6%
17.3%
570 bps
(373) $
—
—
(83)
(290) $
(585)
—
—
(102)
(483)
(57)%
(5.5)%
(9.4)%
(390) bps
(67)%
(4.3)%
(7.9)%
(360) bps
2,038 $
(2)
160
(13)
1,894 $
4,089
509
54
(112)
3,638
101%
7.5%
12.4%
490 bps
92%
7.0%
12.0%
500 bps
(a) Includes $520 million of Prolec GE EBITDA from the acquisition date through September 30, 2026. Prolec GE EBITDA is a non-GAAP financial measure, and is calculated by excluding depreciation and amortization of $(528)
million, the impact of a fair value adjustment to Prolec GE inventory of $(106) million, and certain integration costs and other of $(57) million from Prolec GE income (loss) before income taxes of $(171) million.
We believe Prolec GE EBITDA, which is adjusted to exclude the effects of unique and/or non-cash items that are not closely associated with ongoing operations, provide management and investors with meaningful measures of our
performance that increase the period-to-period comparability by highlighting results from ongoing operations and underlying profitability factors. We believe these measures provide additional insight into how our businesses are
performing, on a normalized basis.
We believe the organic measures presented above provide management and investors with a more complete understanding of underlying operating results and trends of established, ongoing operations by excluding the effect of
acquisitions, dispositions and foreign currency, which includes translational and transactional impacts, as these activities can obscure underlying trends.
- Non-GAAP Financial Measure
© 2026 GE Vernova and/or its affiliates. All rights reserved.
39
Adjusted general and administrative expenses*
ADJUSTED GENERAL AND ADMINISTRATIVE (G&A) EXPENSES
Three months ended September 30
($ in millions)
Selling, General and Administrative expense (GAAP)
2025
$
2026
1,221 $
Nine months ended September 30
V%
1,354
11 %
2025
$
2026
V%
3,594 $
4,024
Less: Restructuring and other charges
72
9
104
134
Less: Separation costs(a)
42
31
120
101
Less: Depreciation and amortization(b)
67
164
199
463
Less: Selling & marketing expense
308
311
911
927
Less: Prolec related G&A expense(c)
—
37
—
87
732 $
803
Adjusted G&A expenses* (Non-GAAP) excluding Prolec related G&A expense $
10 %
$
2,261 $
2,312
12 %
2 %
(a) Costs incurred in our separation from General Electric Company, including system implementations, advisory fees, one-time stock option grant, and other one-time costs.
(b) Excludes depreciation and amortization expense included in Restructuring and other charges.
(c) General and administrative expense attributed to Prolec GE from the acquisition date.
We believe Adjusted general and administrative expenses* provides investors with improved comparability of underlying operating results and a further understanding and additional transparency regarding how we evaluate our
business. Adjusted general and administrative expenses* also provides management and investors with additional perspective regarding the impact of certain significant items on our expenses. Adjusted general and administrative
expenses* excludes unique and/or non-cash items that can have a material impact on our results. However, Adjusted general and administrative expenses* should not be construed as inferring that our future results will be
unaffected by the items for which the measure adjusts.
- Non-GAAP Financial Measure
© 2026 GE Vernova and/or its affiliates. All rights reserved.
40
Adjusted EBITDA*, Adjusted EBITDA margin*, Adjusted organic EBITDA margin*&
Adjusted organic EBITDA margin*
Three months ended September 30
($ in millions)
Net income (loss) (GAAP)
$
Add: Restructuring and other charges
Add: (Gains) losses on purchases and sales of business interests(a)
Add: Separation costs(b)
Add: Non-operating benefit income
Add: Depreciation and amortization(c)
Add: Interest and other financial (income) charges – net(d)(e)
Add: Provision (benefit) for income taxes(e)
Adjusted EBITDA* (Non-GAAP)
$
Net income (loss) margin (GAAP)
Adjusted EBITDA margin* (Non-GAAP)
Adjusted EBITDA* (Non-GAAP)
Less: Acquisitions
Less: Business dispositions
Less: Foreign currency effect
Adjusted organic EBITDA* (Non-GAAP)
Adjusted organic EBITDA margin* (Non-GAAP)
$
$
2025
453 $
83
(113)
43
(115)
212
(44)
292
811 $
4.5%
8.1%
2026
1,289
6
(36)
31
(212)
439
(71)
496
1,943
10.2%
15.4%
811 $
(3)
60
(15)
770 $
7.8%
1,943
210
—
12
1,721
14.7%
V%
185%
Nine months ended September 30
$
140%
570 pts
730 pts
$
140%
$
124%
690 bps
$
2025
1,209 $
192
(131)
122
(340)
617
(141)
510
2,038 $
4.5%
7.5%
2026
6,687
109
(4,481)
92
(465)
1,199
(171)
1,119
4,089
20.2%
12.4%
2,038 $
(2)
160
(13)
1,894 $
7.0%
4,089
509
54
(112)
3,638
12.0%
V%
453%
101%
1,570 pts
490 pts
101%
92%
500 bps
(a) Includes a pre-tax gain of $3,992 million in the nine months ended September 30, 2026 related to the acquisition of the remaining 50% stake in Prolec GE from Xignux as a result of the remeasurement of our previously held equity
interest to fair value and an expense of $106 million for the impact of a fair value adjustment to Prolec GE inventory that was recorded in Cost of equipment in the nine months ended September 30, 2026. Includes a pre-tax gain of
$366 million related to the sale of our Proficy business in our Electrification segment in the nine months ended September 30, 2026. Also includes unrealized and realized (gains) losses related to our interest in China XD Electric Co.,
Ltd, which we sold the remainder of in 2026 and was recorded in Net interest and investment income (loss) which is part of Other income (expense) - net.
(b) Costs incurred in the separation from GE, including system implementations, advisory fees, one-time stock option grant, and other one-time costs.
(c) Excludes depreciation and amortization expense related to Restructuring and other charges. Includes amortization of basis differences included in Equity method investment income (loss) which is part of Other income (expense) - net.
(d) Consists of interest and other financial charges, net of interest income, other than financial interest related to our normal business operations primarily with customers.
(e) Excludes interest (income) expense of zero and zero and provision (benefit) for income taxes of $(3) million and zero for the three months ended September 30, 2026 and 2025, respectively, as well as excludes interest (income)
expense of zero and $(1) million and provision (benefit) for income taxes of $3 million and $4 million for the nine months ended September 30, 2026 and 2025, respectively, related to our Financial Services business which, because of
the nature of its investments, is measured on an after-tax basis.
We believe that Adjusted EBITDA*, Adjusted EBITDA margin*, Adjusted organic EBITDA* & Adjusted organic EBITDA margin*, which are adjusted to exclude the effects of unique and/or non-cash items that are not closely associated with
ongoing operations, provide management and investors with meaningful measures of our performance that increase the period-to-period comparability by highlighting the results from ongoing operations and the underlying profitability
factors. We believe these measures provide additional insight into how our businesses are performing, on a normalized basis. However, Adjusted EBITDA*, Adjusted EBITDA margin*, Adjusted organic EBITDA* & Adjusted organic EBITDA
margin* should not be construed as inferring that our future results will be unaffected by the items for which the measures adjust.
- Non-GAAP Financial Measure
© 2026 GE Vernova and/or its affiliates. All rights reserved.
41
Free Cash Flow*
Free Cash Flow (Non-GAAP)
Three months ended September 30
($ in millions)
Cash from (used for) operating activities (GAAP)
2025
$
Add: gross additions to property, plant and equipment and internal-use software
Free cash flow* (Non-GAAP)
980
2026
$
(247)
$
732
6,057
Nine months ended September 30
V%
518%
2025
$
(647)
$
5,409
2,508
$
(606)
639%
$
1,902
2026
V%
16,737
567%
(1,430)
$
15,307
705%
We believe that free cash flow* provides management and investors with an important measure of our ability to generate cash subsequent to fulfilling our capital obligations; however, free cash flow* does not delineate funds available for
discretionary uses as it does not deduct the payments required for certain investing and financing activities.
- Non-GAAP Financial Measure
© 2026 GE Vernova and/or its affiliates. All rights reserved.
42