GAP
Fiscal year ends January Quarters are offset from the calendar — Q1 is Feb–Apr

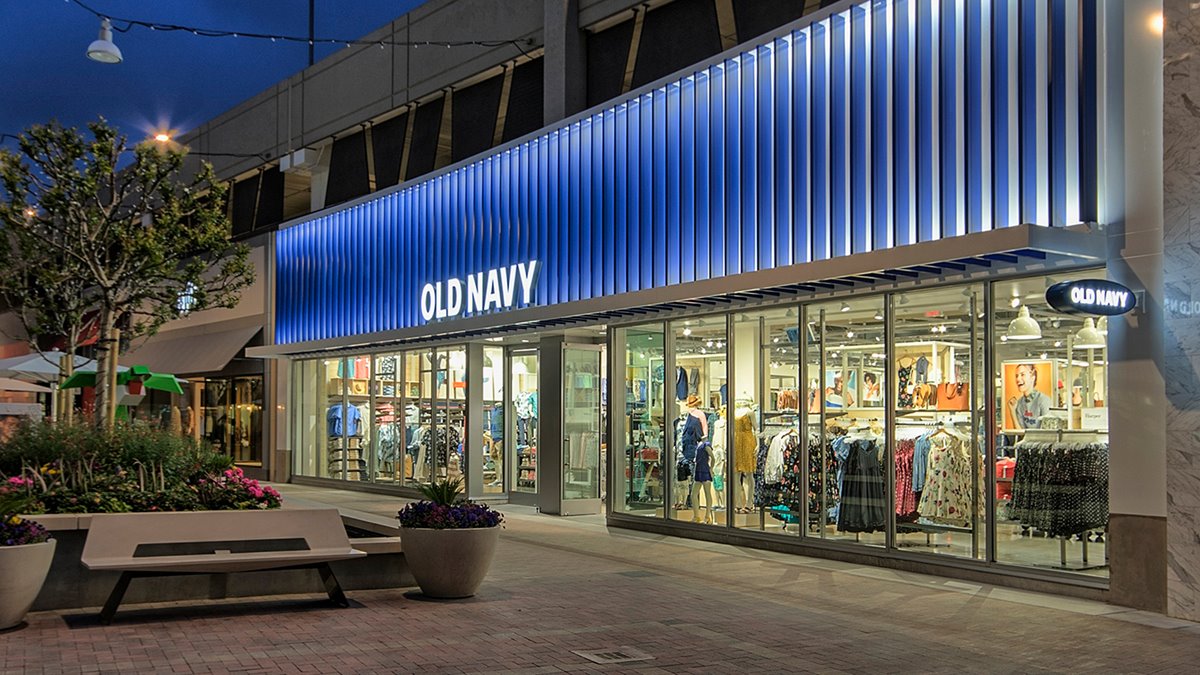
Gap, Inc. is an omni-channel apparel retailer offering clothing, accessories, and personal care products for men, women, and children. The company operates four primary brands: Old Navy, a value-oriented fashion brand; Gap, a casual American style brand; Banana Republic, a premium lifestyle brand; and Athleta, a performance lifestyle brand focused on women and girls. Gap Inc. sells through company-operated stores, franchise locations, and online channels across the United States, Canada, Japan, and Taiwan, with franchise agreements extending into Asia, Europe, Latin America, the Middle East, and Africa. Founded in 1969, the company acquired Banana Republic in 1983 and Athleta in 2008. It also launched Old Navy in 1994. The company utilizes shared supply chain and information technology investments across its brands to optimize operational efficiency. Gap Inc. offers private label and co-branded credit card programs and operates an integrated loyalty program called Encore. Merchandise is sourced from vendors with factories outside North America, with significant purchasing volume from Vietnam and Indonesia.

Summarised from the company's own disclosures, fiscal year ended Mar 2026

Industry Apparel Retail Homepage gapinc.com
Sector Consumer Cyclical IR page investors.gapinc.com/Investor-Relation/default.aspx
Tags
apparel, accessories, personal care, value fashion, casual wear, premium lifestyle, performance wear, omni-channel retail, franchise operations, loyalty programs, Old Navy, Gap, Banana Republic, Athleta, GapKids, babyGap, Gap Maternity, GapBody, GapFit, GapStudio, Gap Outlet, Gap Factory Stores, Banana Republic Factory, Encore
Press page gapinc.com/en-us/news/press-releases

Metrics

Valuation  
Market cap $ 8.327B
Market cap (USD) $ 8.327B
P/E 7.12
PEG —
P/BV 2.11
P/S 0.54
P/OCF 5.42
P/FCF 8.70
Dividend yield 2.9%
Turnover / mcap —
Returns  
ROE 23.1%
ROI 15.4%
ROIC 15.2%
Profit margin 5.3%
Growth  
Revenue growing Yes
Profits growing No
Revenue up 3y No
Revenue up 5y No
Earnings growth 3y (net profit CAGR) —
Quality  
Profitable Yes
Margin expanding No
Buying back stock No
Diluting (TTM) No
Debt/Equity 37.8%
Podcast bulls (TTM) Sign up
Podcast bears (TTM) Sign up
Podcast sentiment (TTM) Sign up
Podcast sentiment % (TTM) Sign up
News sentiment (TTM) 31
Quality score 31.6%
Insiders  
Buys, 1w Sign up
Buys, 1m Sign up
Buys, 1y Sign up
Sells, 1w Sign up
Sells, 1m Sign up
Sells, 1y Sign up

Sign up to see this company's insider trades

Figure FY 2025 FY 2024 FY 2023 FY 2022 FY 2021 FY 2020 FY 2019 FY 2018 FY 2017 FY 2016 FY 2015 FY 2014 FY 2013 FY 2012 FY 2011 FY 2010 FY 2009 FY 2008 FY 2007 FY 2006 FY 2005 FY 2004 FY 2003 FY 2002 FY 2001 FY 2000 FY 1999
Revenue 15.366B 15.086B 14.889B 15.616B 16.67B 13.8B 16.383B 16.58B 15.855B 15.516B 15.797B 16.435B 16.148B 15.651B 14.549B 14.664B 14.197B — 15.763B 15.943B 16.023B 16.267B — — — 13.673B 11.635B
Net profit 816M 844M 502M -202M 256M -665M 351M 1.003B 848M 676M 920M 1.262B 1.28B 1.135B 833M 1.204B 1.102B — 833M 778M 1.113B 1.15B 1.03B 477.457M -7.764M 877.497M 1.127B
Free cash flow 823M 1.039B 1.112B -78M 115M -155M 709M 676M 649M 1.195B 868M 1.415B 1.035B 1.277B 815M 1.187B 1.594B — 1.399B 678M 951M 1.178B 1.899B 935.072M 377.761M -567.457M 239.206M

Figure FY 2025 FY 2024 FY 2023 FY 2022 FY 2021 FY 2020 FY 2019 FY 2018 FY 2017 FY 2016 FY 2015 FY 2014 FY 2013 FY 2012 FY 2011 FY 2010 FY 2009 FY 2008 FY 2007 FY 2006 FY 2005 FY 2004 FY 2003 FY 2002 FY 2001 FY 2000 FY 1999
Share price 25.6 23.63 20.91 11.28 17.65 20.19 17.68 25.76 34.06 22.44 24.7 42.11 39.08 31.04 18.55 22.09 20.94 13.39 — — — — — — — — —
Price performance 12m 0.08 0.13 0.85 -0.36 -0.13 0.14 -0.31 -0.24 0.52 -0.09 -0.41 0.08 0.26 0.67 -0.16 0.05 0.56 — — — — — — — — — —

Filed figures

Figure Jan 2017 Jan 2018 Jan 2019 Jan 2020 Jan 2021 Jan 2022 Jan 2023 Jan 2024 Jan 2025 Jan 2026
Balance sheet detail
Trade receivables (USD) 335M 282M 359M 316M 363M 399M 340M 289M 301M 316M
↳ YoY growth +18.8% -15.8% +27.3% -12.0% +14.9% +9.9% -14.8% -15.0% +4.2% +5.0%
↳ 5y CAGR +2.4% -3.2% -4.9% +2.8% +5.2% +3.6% +3.8% -4.2% -1.0% -2.7%
Borrowings, current (USD) 90M 0.00 6M 6M 0.00 — — — — —
Borrowings, non-current (USD) 1.25B 1.25B 1.25B 1.25B 2.22B 1.48B 1.49B 1.49B 1.49B 1.49B
Lease liabilities (USD) — — 0.00 6.43B 5.45B 4.77B 4.18B 3.95B 3.99B 4.12B
Cash and deposits (USD) 1.78B 1.78B 1.08B 1.36B 1.99B 877M 1.22B 1.87B 2.34B 2.62B
Intangible assets (USD) — — — — 0.00 36M 27M 18M 10M 4M
Right-of-use assets (USD) — — 0.00 5.4B 4.22B 3.68B 3.17B 3.12B 3.24B 3.44B
Net debt (borrowings + leases - cash) (USD) -445M -534M 175M 6.32B 5.68B 5.37B 4.46B 3.57B 3.14B 3B
Cash flow detail
Operating cash flow (USD) 1.72B 1.38B 1.38B 1.41B 237M 809M 607M 1.53B 1.49B 1.29B
Purchases of property, plant and equipment (USD) -524M -731M -705M -702M -392M -694M -685M -420M -447M -470M
Change in payables (cash effect) (USD) 146M -90M -78M 66M 564M 186M -540M 42M 137M 57M
Dividends paid (cash effect) (USD) -367M -361M -373M -364M 0.00 -226M -220M -222M -225M -247M
Share buybacks (cash effect) (USD) 0.00 -315M -398M -200M 0.00 -201M -123M 0.00 -75M -155M
Interest paid (cash effect) (USD) -82M -76M -76M -76M -145M -180M -76M -74M -63M -63M
Income taxes paid (cash effect) (USD) -488M -570M -143M -176M -20M -215M 388M -49M -237M -235M
Share-based compensation (USD) 76M 87M 91M 68M 77M 139M 37M 80M 126M 162M
Free cash flow (OCF - PPE - intangibles) (USD) 1.2B 649M 676M 709M -155M 115M -78M 1.11B 1.04B 823M
Income detail
Research and development expense (USD) 46M 51M 50M 41M 46M 41M 46M 37M 40M 60M
↳ 5y CAGR -2.3% -2.0% -5.8% -0.5% +5.5%
Total comprehensive income (USD) 645M 830M 1.02B 338M -696M 285M -192M 497M 861M 794M
Comprehensive income to owners (USD) 645M 830M 1.02B 338M -696M 285M -192M 497M 861M 794M
Reported Mar 19, 2019 Mar 19, 2019 May 31, 2019 Mar 17, 2020 Mar 15, 2022 Mar 15, 2022 Mar 14, 2023 Mar 19, 2024 Mar 18, 2025 Mar 17, 2026

Sign up to see institutional holdings

Sign Up

Podcast Mentions

Sign up to see podcast mentions and sentiment

Sign Up

by Gap Inc.

Gap Inc.

October 29, 2026

Gap Inc. (NYSE: GAP) will report its third quarter fiscal 2026 financial results by press release on Thursday, November 19, 2026, at approximately 1:15 p.m. Pacific Time.

In addition, the company will host a conference call to review its third quarter fiscal 2026 results on Thursday, November 19, 2026, beginning at approximately 2:00 p.m. Pacific Time.

A live webcast of the conference call will be available online at investors.gapinc.com .  A replay of the webcast will be available at the same location.

About Gap Inc.
Gap Inc., a purpose-driven house of iconic brands, is the largest specialty apparel company in America. Its Old Navy , Gap , Banana Republic , and Athleta brands offer clothing, accessories, and lifestyle products for men, women and children available worldwide through company-operated and franchise stores, and e-commerce sites. Through Encore , its cross-brand membership program, Gap Inc. has created products and experiences that shape culture, while doing right by employees, communities and the planet through its commitment to bridge gaps to create a better world. For more information, please visit www.gapinc.com .

Investor Relations Contact:
Whitney Notaro
[email protected]

Media Relations Contact:
[email protected]

Don’t miss out on the latest Gap Inc. news! Sign-up to get email alerts about news on Gap Inc. and our brands.

Categories

Related Articles

Press Release

Read more about Banana Republic Celebrates the Holiday Season with Actress and Musician Ella Hunt

Banana Republic

Banana Republic Celebrates the Holiday Season with Actress and Musician Ella Hunt

October 27, 2026

Press Release

Read more about Gap Inc. Reimagines Holiday Hiring with AI Tools to Help  Connect Talent with its Iconic Brands

Gap Inc.

Gap Inc. Reimagines Holiday Hiring with AI Tools to Help  Connect Talent with its Iconic Brands

October 23, 2026

Press Release

Read more about Gap and Victoria Beckham Unveil Their Second Collection for Fall/Winter 2026

Gap

Gap and Victoria Beckham Unveil Their Second Collection for Fall/Winter 2026

October 20, 2026

Press Release

Read more about Banana Republic and Zankov Holiday Capsule Celebrating Heritage , Craftsmanship, and a Timeless Wardrobe

Banana Republic

Banana Republic and Zankov Holiday Capsule Celebrating Heritage , Craftsmanship, and a Timeless Wardrobe

October 15, 2026

Gap logo

Company

Company : click to collapse : click to expand

Follow Us

Follow Us : click to collapse : click to expand

Brands

Brands : click to collapse : click to expand

Help

Help : click to collapse : click to expand

2026 © Gap Inc. All rights reserved

Back to top

by Banana Republic

Banana Republic

October 27, 2026

Banana Republic welcomes the holiday season with a new campaign starring actress and musician Ella Hunt, celebrating the joy of connection, shared experiences and the moments that make the season memorable.

Rooted in the brand's spirit of exploration and discovery, the Holiday 2026 campaign follows Hunt and a close-knit group of friends as they come together for festive gatherings and spontaneous adventures. The campaign captures the warmth and energy of the season through an effortless approach to holiday dressing.

The accompanying collection celebrates Banana Republic's commitment to quality, craftsmanship and modern classics, featuring cozy cashmere, heritage-inspired knitwear, rich textures and sophisticated outerwear. Designed for both everyday moments and special occasions, the assortment brings together timeless silhouettes and thoughtful details that feel equally suited for personal style and holiday gifting.

Highlights include Fair Isle sweaters inspired by archival Banana Republic designs from 1992 through 2002, premium 100% cashmere essentials, and statement outerwear crafted from wool, suede and shearling. Seasonal favorites range from the women's Rocky Mountain Handknit Sweater and Drape Midori Sweater Dress to the men's Wood Alpine Bomber and Shearling Rancher Jacket.

Extending beyond apparel, Banana Republic's holiday gifting assortment features cashmere accessories alongside a curated selection of lifestyle pieces and accessories from brands including Timex, Breda, Louise Damas and Brigitte Tanaka.

Press Contact:
Banana Republic | PR Consulting
[email protected]

About Banana Republic:
Banana Republic is a storyteller’s brand, outfitting the modern explorer with premium, expertly crafted collections and experiences to inspire and enrich their journeys. Founded in 1978 in San Francisco, Banana Republic connects with customers across online and company-operated and franchise retail locations globally. For more information, please visit www.bananarepublic.com and follow @BananaRepublic on social channels.

Don’t miss out on the latest Gap Inc. news! Sign-up to get email alerts about news on Gap Inc. and our brands.

Categories

Related Articles

Press Release

Read more about Gap Inc. to Report Third Quarter Fiscal 2026 Results on November 19

Gap Inc.

Gap Inc. to Report Third Quarter Fiscal 2026 Results on November 19

October 29, 2026

Press Release

Read more about Gap Inc. Reimagines Holiday Hiring with AI Tools to Help  Connect Talent with its Iconic Brands

Gap Inc.

Gap Inc. Reimagines Holiday Hiring with AI Tools to Help  Connect Talent with its Iconic Brands

October 23, 2026

Press Release

Read more about Gap and Victoria Beckham Unveil Their Second Collection for Fall/Winter 2026

Gap

Gap and Victoria Beckham Unveil Their Second Collection for Fall/Winter 2026

October 20, 2026

Press Release

Read more about Banana Republic and Zankov Holiday Capsule Celebrating Heritage , Craftsmanship, and a Timeless Wardrobe

Banana Republic

Banana Republic and Zankov Holiday Capsule Celebrating Heritage , Craftsmanship, and a Timeless Wardrobe

October 15, 2026

Gap logo

Company

Company : click to collapse : click to expand

Follow Us

Follow Us : click to collapse : click to expand

Brands

Brands : click to collapse : click to expand

Help

Help : click to collapse : click to expand

2026 © Gap Inc. All rights reserved

Back to top
Banana Republic Bull 1 Bear 0 Product/operations

Banana Republic

List of articles

See more stories

Gap logo

Company

Company : click to collapse : click to expand

Follow Us

Follow Us : click to collapse : click to expand

Brands

Brands : click to collapse : click to expand

Help

Help : click to collapse : click to expand

2026 © Gap Inc. All rights reserved

Back to top

Prompts

Gap, Inc. (The) (ticker GAP), listed in United States.

Company History

Date Change Detail
— Former tickers GPS

ETFs Holding Gap, Inc. (The)

ETF Weight in ETF Shares Market value As of
LSEQ 2.40% 18,945 $ 399.171K Nov 13, 2026
UDI 1.76% 3,822 $ 71.395K Jun 30, 2026
QVAL 1.56% 586,599 $ 11.35M Nov 18, 2026
RNIN 1.09% 118,138 $ 2.29M Nov 18, 2026
SDVD 0.75% 318,555 $ 6.858M Nov 11, 2026
DSMC 0.69% 47,816 $ 893.203K Jun 30, 2026
WTV 0.40% 638,829 $ 11.933M Jun 30, 2026
FEMV 0.39% 1,108 $ 20.697K Jun 30, 2026
DFAT 0.39% 5,762,047 $ 122.443M Nov 12, 2026
DFSV 0.38% 4,936,278 $ 104.896M Nov 12, 2026
FMDE 0.35% 1,382,908 $ 25.833M Jun 30, 2026
GMOV 0.33% 15,945 $ 355.733K Aug 31, 2026
LSVD 0.29% 94,449 $ 1.897M Jul 31, 2026
VFVA 0.28% 121,007 $ 2.7M Aug 31, 2026
AFMC 0.26% 35,107 $ 693.714K Nov 16, 2026
CDX short -0.20% -25,893.4143 $ -501.038K Nov 17, 2026
VFMF 0.20% 88,464 $ 1.974M Aug 31, 2026
INFO 0.20% 96,746 $ 2.038M Nov 13, 2026
SMDX 0.20% 12,737 $ 251.683K Nov 17, 2026
DFAS 0.17% 2,601,127 $ 55.274M Nov 12, 2026
AVMV 0.16% 66,610 $ 1.316M Nov 16, 2026
FTHI 0.14% 180,263 $ 3.562M Nov 16, 2026
IEDI 0.14% 1,898 $ 38.131K Jul 31, 2026
FELV 0.13% 223,749 $ 4.18M Jun 30, 2026
AVLV 0.11% 1,269,349 $ 25.082M Nov 16, 2026
REMC 0.09% 167 $ 3,119.56 Jun 30, 2026
JMEE 0.09% 139,036 $ 2.69M Nov 17, 2026
EBI 0.08% 25,244 $ 563.194K Aug 31, 2026
RUSC 0.08% 3,444 $ 64.334K Jun 30, 2026
FTLS short -0.08% -111,156 $ 0.00 Nov 16, 2026
GVLU 0.08% 11,227 $ 221.846K Nov 17, 2026
DXUV 0.06% 177,419 $ 3.77M Nov 12, 2026
AVMC 0.06% 17,325 $ 342.342K Nov 16, 2026
AVSU 0.05% 11,946 $ 236.053K Nov 16, 2026
LCTU 0.05% 30,401 $ 600.724K Nov 16, 2026
SFGV 0.05% 28,660 $ 550K Nov 18, 2026
DVAL 0.05% 1,755 $ 32.783K Jun 30, 2026
DFUV 0.04% 321,872 $ 6.84M Nov 12, 2026
DFSU 0.04% 46,573 $ 989.676K Nov 12, 2026
AVUV 0.04% 589,930 $ 11.657M Nov 16, 2026
FYEE 0.04% 4,247 $ 85.322K Jul 31, 2026
FHEQ 0.03% 14,570 $ 292.711K Jul 31, 2026
AVUS 0.03% 208,812 $ 4.126M Nov 16, 2026
DFAC 0.03% 1,237,523 $ 26.297M Nov 12, 2026
DCOR 0.02% 502,468 $ 10.677M Nov 12, 2026
MSSM 0.02% 6,682 $ 149.075K Aug 31, 2026
INRO 0.02% 5,641 $ 111.466K Nov 16, 2026
VSLU 0.02% 5,316 $ 99.303K Jun 30, 2026
DFAU 0.02% 109,533 $ 2.328M Nov 12, 2026
IALT short -0.01% -23,168 $ -457.8K Nov 16, 2026
AVLC 0.01% 6,756 $ 133.499K Nov 16, 2026
SHRT 0.01% 47 $ 928.72 Nov 17, 2026
DFUS 0.01% 84,408 $ 1.794M Nov 12, 2026
ENHU 0.00% 17 $ 335.92 Nov 16, 2026
THRO 0.00% 35 $ 691.60 Nov 16, 2026