Genpact is an agentic and advanced technology solutions company that provides business process outsourcing, data and AI services, and digital operations to global enterprises. The company operates through three reportable segments: Financial Services, Consumer and Healthcare, and High Tech and Manufacturing. Its service offerings are divided into Advanced Technology Solutions, which include Data and AI, Digital Technology, Advisory Services, and Agentic Solutions, and Core Business Services, comprising Decision Support Services, Technology Services, and Digital Operations. Genpact serves clients in banking, capital markets, insurance, retail, healthcare, and manufacturing sectors, supporting functions such as customer onboarding, loan operations, risk management, and supply chain processes. The company was established as the global capability center for General Electric Company. It leverages proprietary technologies and partnerships to deploy AI agents and robotic process automation for end-to-end workflow management.

Summarised from the company's own disclosures, fiscal year ended Feb 2026

Industry Information Technology Services Homepage genpact.com
Sector Technology IR page genpact.com/investors
Tags
business process outsourcing, agentic ai, data analytics, financial services, healthcare, manufacturing, risk management, digital operations, advisory services, robotic process automation, Genpact Record-to-Report Suite
Press page genpact.com/newsroom

Metrics

Valuation  
Market cap $ 7.198B
Market cap (USD) $ 7.198B
P/E 12.55
PEG 0.78
P/BV 2.66
P/S 1.35
P/OCF 16.79
P/FCF 20.19
Dividend yield 1.7%
Turnover / mcap —
Returns  
ROE 22.4%
ROI 13.5%
ROIC 13.9%
Profit margin 10.9%
Growth  
Revenue growing Yes
Profits growing No
Revenue up 3y Yes
Revenue up 5y Yes
Earnings growth 3y (net profit CAGR) 16.1%
Quality  
Profitable Yes
Margin expanding Yes
Buying back stock Yes
Diluting (TTM) No
Debt/Equity 43.3%
Podcast bulls (TTM) Sign up
Podcast bears (TTM) Sign up
Podcast sentiment (TTM) Sign up
Podcast sentiment % (TTM) Sign up
News sentiment (TTM) 16
Quality score 47.4%
Insiders  
Buys, 1w Sign up
Buys, 1m Sign up
Buys, 1y Sign up
Sells, 1w Sign up
Sells, 1m Sign up
Sells, 1y Sign up

Sign up to see this company's insider trades

Figure FY 2025 FY 2024 FY 2023 FY 2022 FY 2021 FY 2020 FY 2019 FY 2018 FY 2017 FY 2016 FY 2015 FY 2014 FY 2013 FY 2012 FY 2011 FY 2010 FY 2009 FY 2008 FY 2007 FY 2006
Revenue 5.08B 4.767B 4.477B 4.371B 4.022B 3.709B 3.521B 3.001B 2.737B 2.571B 2.461B 2.279B 2.132B 1.902B 1.6B 1.259B 1.12B 1.041B 822.684M 613.047M
Net profit 552.494M 513.67M 631.255M 353.404M 369.448M 308.276M 304.881M 282.019M 263.111M 269.684M 239.817M 192.002M 229.717M 178.216M 184.294M 142.181M 127.301M 125.141M 56.423M 39.772M
Free cash flow 734.653M 532.658M 435.391M 393.056M 640.94M 514.138M 352.961M 254.533M 301.847M 257M 265.268M 209.261M 262.725M 227.323M 230.836M 107.927M 105.629M 148.814M 84.091M -42.649M

Figure FY 2025 FY 2024 FY 2023 FY 2022 FY 2021 FY 2020 FY 2019 FY 2018 FY 2017 FY 2016 FY 2015 FY 2014 FY 2013 FY 2012 FY 2011 FY 2010 FY 2009 FY 2008 FY 2007 FY 2006
Share price 46.78 42.95 34.71 46.32 53.08 41.36 42.17 26.99 31.74 24.34 24.98 18.93 18.37 15.5 14.91 14.86 14.74 7.49 14.73 —
Price performance 12m 0.09 0.24 -0.25 -0.13 0.28 -0.02 0.56 -0.15 0.3 -0.03 0.32 0.03 0.19 0.04 0 0.01 0.97 -0.49 — —

Filed figures

Figure Dec 2016 Dec 2017 Dec 2018 Dec 2019 Dec 2020 Dec 2021 Dec 2022 Dec 2023 Dec 2024 Dec 2025
Balance sheet detail
Trade receivables (USD) 615M 693M 774M 914M 881M 888M 995M 1.12B 1.2B 1.24B
↳ YoY growth +4.3% +12.6% +11.7% +18.1% -3.6% +0.8% +12.1% +12.2% +7.4% +3.5%
↳ 5y CAGR +8.9% +8.9% +8.9% +11.7% +8.3% +7.6% +7.5% +7.6% +5.6% +7.1%
Borrowings, current (USD) 199M 209M 328M 104M 284M 383M 177M 442M 26.2M 376M
Borrowings, non-current (USD) 698M 1.01B 976M 1.34B 1.31B 1.27B 1.25B 825M 1.2B 1.17B
Lease liabilities (USD) — — — 390M 395M 344M 272M 236M 224M 222M
Cash and deposits (USD) 423M 504M 368M 467M 680M 899M 647M 584M 648M 854M
Intangible assets (USD) 72M 132M 177M 231M 237M 170M 89.7M 53M 27M 67M
Right-of-use assets (USD) — — — 331M 305M 271M 198M 186M 182M 182M
Net debt (borrowings + leases - cash) (USD) 475M 711M 936M 1.37B 1.31B 1.1B 1.05B 919M 797M 911M
Cash flow detail
Operating cash flow (USD) 346M 359M 340M 428M 584M 694M 444M 491M 615M 813M
Purchases of property, plant and equipment (USD) -88.8M -57.2M -85M -74.9M -70.2M -53.3M -50.6M -55.4M -82.8M -78.2M
Purchases of intangible assets (USD) -6.85M -16.4M -75.4M -33.8M -10.2M -3.91M -3.78M -3.36M -2.47M -10.3M
Change in receivables (cash effect) (USD) -48.6M -57.3M -76.9M -122M 42.5M -11.8M -112M -131M -96.6M -44.2M
Change in payables (cash effect) (USD) -463,000 -2.16M 26.4M -21.4M -12.5M 11.7M 14.2M -8.22M 8.73M -6.42M
Dividends paid (cash effect) (USD) — -46.7M -57.1M -64.7M -74.2M -80.5M -91.8M -100M -108M -118M
Share buybacks (cash effect) (USD) -345M -220M -154M -30M -137M -298M -214M -225M -253M —
Interest paid (cash effect) (USD) -17.9M -27.9M -41.5M -45.1M -49.1M -46.3M -51.1M -48M -68.9M -59.7M
Income taxes paid (cash effect) (USD) -46.7M -66.2M -81.4M -104M -194M -31.8M -146M -157M -114M -144M
Share-based compensation (USD) 25.1M 35.7M 49M 83.9M 74M 82M 77.4M 88.6M 66.4M 89.6M
Operating cash flow before change in receivables (USD) 394M 416M 416M 550M 542M 706M 556M 622M 712M 857M
Free cash flow (OCF - PPE - intangibles) (USD) 257M 285M 179M 319M 504M 637M 389M 432M 530M 724M
Income detail
Total comprehensive income (USD) 263M 366M 128M 280M 295M 360M 175M 642M 442M 485M
Comprehensive income to owners (USD) 263M 366M 128M 280M 295M 360M 175M 642M 442M 485M
Provision for credit losses (USD) 7.28M 9.82M 1.86M 7.44M 5.71M 1.49M 1.58M 3.98M 13.8M 20.5M
Credit cost ratio (credit losses / average receivables) (%) 1.2% 1.5% 0.3% 0.9% 0.6% 0.2% 0.2% 0.4% 1.2% 1.7%
Reported Mar 1, 2019 Mar 1, 2019 Mar 1, 2019 Mar 2, 2020 Mar 1, 2021 Mar 1, 2022 Mar 1, 2023 Feb 29, 2024 Mar 3, 2025 Feb 26, 2026

Sign up to see institutional holdings

Sign Up

Podcast Mentions

Sign up to see podcast mentions and sentiment

Sign Up

On November 10, 2026, Genpact Limited, a Bermuda company (the “Company”), held a special general meeting of shareholders (the “Special Meeting”) at 521 Fifth Avenue, 14th Floor, New York, NY. At the Special Meeting, Company shareholders voted on two proposals. The full results of the votes are set forth below. Each proposal is described in detail in the Company’s previously filed proxy statement/prospectus related to the Special Meeting. Proposal 1

Company shareholders approved the change of the Company’s jurisdiction of incorporation from Bermuda to the State of Delaware by discontinuing as an exempted company limited by shares in Bermuda and continuing and domesticating as a corporation incorporated under the laws of the State of Delaware (the “Domestication” and such proposal, the “Domestication Proposal”) as set forth below.

Genpact Reports Third Quarter 2026 Results Bull 4 Bear 0 Results

Genpact Reports Third Quarter 2026 Results

_Advanced Technology Solutions net revenue growth, up 30% year-over-year, drives Q3 performance;
_Genpact raises 2026 guidance for gross margin and adjusted diluted earnings per share1

NEW YORK, Nov. 5, 2026 /PRNewswireopens in a new tab / -- Genpact Limited (NYSE: G), the Agentic Operations company, today announced financial results for the third quarter ended September 30, 2026.

Genpact Logo

"Q3 was another clear proof point that our pivot to Agentic Operations is working, as our flywheel continues to accelerate. Total revenue grew 7.3% year-over-year, and Advanced Technology Solutions revenue growth increased to 30.3%," said Balkrishan "BK" Kalra, President and CEO, Genpact. "What matters as much as the pace is the quality: we are driving organic growth and winning high-quality revenue. We are building a fundamentally new Genpact in a rapidly expanding market, and that is increasingly showing up in our results."

"Our Q3 results reflect the strength of our differentiation and execution, with strong revenue growth, significant year-over-year gross margin expansion, and adjusted diluted EPS1 growth of 10.3%, and we are raising our full year 2026 gross margin and adjusted diluted EPS1 guidance to reflect this," said Sumita Pandit, Chief Financial Officer, Genpact. "We continue to invest significantly in Agentic Operations, strengthening our market position and building a high-quality business with durable growth."

Key Financial Highlights – Third Quarter 2026

  • Net revenues were $1.385 billion, up 7.3% year-over-year, and 7.5% on a constant currency basis.2
    • Advanced Technology Solutions net revenues were $405 million, up 30.3% year-over-year, representing 29% of total net revenues.
    • Core Business Services net revenues were $980 million, flat year over year, representing 71% of total net revenues.
  • Gross profit was $527 million, up 12.1% year-over-year, with a corresponding margin of 38.0%.
  • Net income was $152 million, up 4.0% year-over-year, with a corresponding margin of 10.9%.
  • Income from operations was $211 million, up 10.1% year-over-year, with a corresponding margin of 15.2%.
  • Adjusted income from operations3 was $247 million, up 7.7% year-over-year, with a corresponding margin of 17.8%.
  • Diluted earnings per share was $0.89, up 7.2% year-over-year.
  • Adjusted diluted earnings per share1 was $1.07, up 10.3% year-over-year.
  • Cash generated from operations was $93 million.
  • Genpact repurchased approximately 870,000 common shares during the quarter for total consideration of approximately $31 million at an average price per share of $35.49. Genpact returned approximately $31 million in dividends to shareholders.
  • Year-to-date, Genpact returned approximately $246 million to shareholders through share repurchases and dividends.

Outlook

Genpact's updated outlook for the full year 2026 is as follows:

  • Net revenue growth of at least 7% year-over-year on an as reported basis, or 6.8% on a constant currency basis.2
    • In Advanced Technology Solutions, we expect revenue to grow at least 25% year-over-year.
    • In Core Business Services, we expect growth to continue year-over-year.
  • Gross margin outlook increased to approximately 36.9%, up approximately 90 basis points year-over-year.
  • Adjusted income from operations margin4 of approximately 17.7%, up approximately 25 basis points year-over-year.
  • Adjusted diluted earnings per share5 growth increased to at least 13% year-over-year.

Third Quarter 2026 Earnings Call

Genpact's management will host a conference call on November 5, 2026 at 5:00PM ET to discuss the company's performance for the third quarter ended September 30, 2026. Participants are encouraged to register hereopens in a new tab  to receive a dial-in number and unique PIN for seamless access. It is recommended to join 10 minutes before the call starts, although registration and dial-in will be available at any time. A live webcast, as well as supplemental investor materials, will be available on the Genpact Investor Relations website. An archived replay and transcript will be available on the website shortly after the call.

**About Genpact
**Genpact (NYSE: G) is the Agentic Operations company, where frontier AI meets context-rich process intelligence. For decades, we have run mission-critical operations for the world's leading enterprises across finance, risk, supply chain, banking, insurance, and procurement. Today, with Agentic Operations, agents run the work, and our experts own the outcomes, so clients grow faster, operate leaner, and convert more to cash. Get to know us at genpact.com and on LinkedIn, X, YouTube, and Facebook.

**Safe Harbor
**This press release contains certain statements concerning our future growth prospects, including our outlook for the full year 2026, financial results and other forward-looking statements, as defined in the safe harbor provisions of the U.S. Private Securities Litigation Reform Act of 1995. These statements involve a number of risks, uncertainties and other factors that could cause actual results to differ materially from those in such forward-looking statements. These risks, uncertainties, and other factors include but are not limited to macroeconomic uncertainty, U.S. and global trade and tariff policies and general economic conditions, any deterioration in the global economic environment and its impact on our clients, our ability to develop and successfully execute our business strategies, our transition away from work that is not aligned with our Agentic Operations strategy, our ability to develop and successfully implement technological innovations, including AI technologies such as agentic AI, generative AI and large language models, and our ability to invest in new technologies and adapt to industry developments and client needs at sufficient speed and scale, our ability to effectively price our services and maintain pricing and employee utilization rates, general inflationary pressures and our ability to share increased costs with our clients, wage increases in locations in which we have operations, our ability to attract and retain skilled professionals, our ability to protect our and our clients' data from security incidents or cyberattacks, political, economic or business conditions in countries in which we operate, the economic and other impacts of geopolitical conflicts and any related sanctions and other measures that have been or may be implemented or imposed in response thereto, as well as any potential expansion or escalation of existing conflicts or economic disruption beyond their current scope, a slowdown in the geographic regions or sectors in which we or our clients operate, the risks and uncertainties arising from our past and future acquisitions or divestitures, our ability to convert bookings to revenues, the effects of our recent enterprise resource planning system implementation on our invoicing, collections and cash flows, our ability to manage growth, factors which may impact our cost advantage, changes in tax rates and tax legislation, tax audits, investigations and tax proceedings, changes in the interpretation or enforcement of tax laws and other laws and regulations, our ability to effectively execute our tax planning strategies, highly competitive markets and any inability to compete effectively, claims and lawsuits, including by clients, employees or other third parties, risks and uncertainties regarding fluctuations in our earnings, foreign currency fluctuations, as well as other risks detailed in our reports filed with the U.S. Securities and Exchange Commission, including Genpact's Annual Report on Form 10-K and Quarterly Reports on Form 10-Q. These filings are available at www.sec.gov . Genpact may from time to time make additional written and oral forward-looking statements, including statements contained in our filings with the Securities and Exchange Commission and our reports to shareholders. Although Genpact believes that these forward-looking statements are based on reasonable assumptions, you are cautioned not to put undue reliance on these forward-looking statements, which reflect management's current analysis of future events and should not be relied upon as representing management's expectations or beliefs as of any date subsequent to the time they are made. Genpact undertakes no obligation to update any forward-looking statements that may be made from time to time by or on behalf of Genpact. Our results for the quarter ended September 30, 2026 are also not necessarily indicative of our operating results for any future periods.

Recognition reinforces Genpact's position as a Leader in helping CFOs move to Agentic Operations designed to deliver measurable outcomes

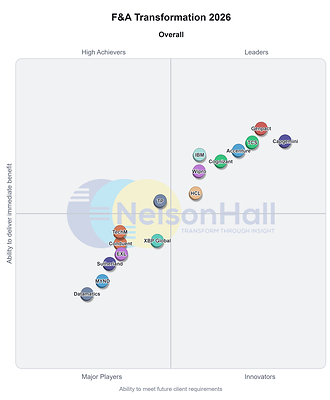
NEW YORK, Oct. 28, 2026 /PRNewswireopens in a new tab / -- Genpact (NYSE: G), the Agentic Operations company, has been named a Leader in NelsonHall's 2026 NEAT evaluation for Finance and Accounting Transformationopens in a new tab . Genpact was recognized as a Leader overall and across all evaluated segments: Procure-to-Pay (P2P), Record-to-Report (R2R), Order-to-Cash (O2C), Agentic AI Capabilities, and CFO Advisory Capabilities.

  • Loading...

Previous Item Next Item

Genpact, the Agentic Operations company, has been named a Leader in NelsonHall's 2026 NEAT evaluation for Finance and Accounting Transformation.

The recognition highlights Genpact's breadth in finance and accounting transformation, from core transaction processing through CFO advisory. Together, these capabilities help finance organizations modernize operations, strengthen controls, improve efficiency, and accelerate the shift from automation-led services to more autonomous, AI-enabled finance models.

"Genpact was identified as a Leader for rebuilding its F&A offerings around an agentic operating model, with investments in building an autonomous F&A that aims to deliver measurable business outcomes," said Vaibhav Wardhan, Principal Analyst, F&A & Supply Chain Transformation, NelsonHall. "The combination of domain-trained agents and deep contextual understanding of client operations positions Genpact well as the market shifts from automation-led services toward autonomous finance."

"This recognition reflects our focus on helping finance leaders move beyond incremental automation to AI-ready operations that deliver enterprise value," said Rajat Vig, Global Leader, Finance and Risk, Genpact. "Agentic Operations in finance means pairing domain-trained agents with the process context we've built over decades. That combination can help CFOs improve performance today while preparing their organizations for autonomous finance."

The report identifies four priorities underpinning Genpact's F&A transformation strategy and its push toward Agentic Operations on the CFO agenda:

  • Scaling CFO advisory services
  • Building agentic AI solutions
  • Driving data modernization and AI readiness
  • Leveraging technology partnerships with providers including HighRadius, BlackLine, and Anaplan

About the NelsonHall NEAT Evaluation

NelsonHall's Vendor Evaluation & Assessment Tool (NEAT) for F&A Transformation analyzes the performance of vendors offering finance and accounting transformation services. The NEAT tool allows strategic sourcing managers to assess providers across a range of criteria and business situations and identify the best-performing vendors overall and in specific capability areas, including P2P, R2R, O2C, agentic AI, and CFO advisory services. Vendors are evaluated on both their ability to deliver immediate benefit and their ability to meet future client requirements, and are positioned as Leaders, High Achievers, Innovators, or Major Players.

About Genpact

Genpact (NYSE: G) is the Agentic Operations company, where applied AI meets context-rich process intelligence. We run and transform mission-critical operations for global enterprises. Genpact's Agentic Operations are grounded in decades of operating core business processes at scale across finance, supply chain, banking, insurance, and more. Our flywheel of advanced technology, trusted data foundations, and deep ecosystem partnerships moves enterprises rapidly from experimentation to scale. AI agents bring speed and precision, human experts bring judgment, and together they deliver outcomes clients can measure. Get to know us at genpact.comopens in a new tab  opens in a new tab and on LinkedInopens in a new tab , YouTubeopens in a new tab , Xopens in a new tab , and Facebookopens in a new tab .

MEDIA CONTACT:

Keith Gordon
Genpact Media Relations
917-204-9952
[email protected] in a new tab
Genpact Logo

SOURCE Genpact

The relentless pursuit of a world that works better for people

The relentless pursuit of a world that works better for people

opens in a new tab

opens in a new tab

opens in a new tab

opens in a new tab

Copyright © Genpact 2026. All rights reserved.

We use cookies to personalize content and ads to provide social media features and to analyze our traffic. We also share information about your use of our site with our social media, advertising and analytics partners. You may withdraw or manage your cookie consent at any time directly from the Cookie Preference Center. For more information on how Genpact uses and shares information about your use of our website, please see our Cookie Policy.Click to View Our Cookie Policy.opens in a new tab

Change Cookie Preference Accept All Cookies

Company Logo

Privacy Preference Center

When you visit any website, it may store or retrieve information on your browser, mostly in the form of cookies. This information might be about you, your preferences or your device and is mostly used to make the site work as you expect it to. The information does not usually directly identify you, but it can give you a more personalized web experience. Because we respect your right to privacy, you can choose not to allow some types of cookies. Click on the different category headings to find out more and change our default settings. However, blocking some types of cookies may impact your experience of the site and the services we are able to offer.
More informationopens in a new tab

Allow All

Manage Consent Preferences

Strictly Necessary Cookies

Always Active

These cookies are necessary for the website to function and cannot be switched off in our systems. They are usually only set in response to actions made by you which amount to a request for services, such as setting your privacy preferences, logging in or filling in forms.    You can set your browser to block or alert you about these cookies, but some parts of the site will not then work. These cookies do not store any personally identifiable information.

Cookies Details‎

Performance Cookies

Performance Cookies

These cookies allow us to count visits and traffic sources so we can measure and improve the performance of our site. They help us to know which pages are the most and least popular and see how visitors move around the site.    All information these cookies collect is aggregated and therefore anonymous. If you do not allow these cookies we will not know when you have visited our site, and will not be able to monitor its performance.

Cookies Details‎

Functional Cookies

Functional Cookies

These cookies enable the website to provide enhanced functionality and personalisation. They may be set by us or by third party providers whose services we have added to our pages.    If you do not allow these cookies then some or all of these services may not function properly.

Cookies Details‎

Targeting Cookies

Targeting Cookies

These cookies may be set through our site by our advertising partners. They may be used by those companies to build a profile of your interests and show you relevant adverts on other sites.    They do not store directly personal information, but are based on uniquely identifying your browser and internet device. If you do not allow these cookies, you will experience less targeted advertising.

Cookies Details‎

Social Media Cookies

Social Media Cookies

These cookies are set by a range of social media services that we have added to the site to enable you to share our content with your friends and networks. They are capable of tracking your browser across other sites and building up a profile of your interests. This may impact the content and messages you see on other websites you visit.    If you do not allow these cookies you may not be able to use or see these sharing tools.

Cookies Details‎

Back Button

Cookie List

Search Icon

Filter Icon

Clear

checkbox label label

Apply Cancel

Consent Leg.Interest

checkbox label label

checkbox label label

checkbox label label

Confirm My Choices

Powered by Onetrustopens in a new tab

Your Privacy [`dialog closed`]

(opens in a new window)
Prompts

Genpact Limited (ticker G), listed in United States.

ETFs Holding Genpact Limited

ETF Weight in ETF Shares Market value As of
CLCV 1.84% 8,935 $ 314.244K Jul 31, 2026
IDYN 1.56% 35,207 $ 1.728M Nov 16, 2026
RNIN 1.54% 75,739 $ 3.23M Nov 18, 2026
WBIF 1.34% 11,436 $ 314.49K Jun 30, 2026
EMES 1.30% 3,241 $ 141.34K Nov 13, 2026
MGMT 1.27% 83,003 $ 2.283M Jun 30, 2026
SDVD 0.96% 202,367 $ 8.823M Nov 11, 2026
AFMC 0.66% 39,487 $ 1.748M Nov 16, 2026
DSMC 0.61% 28,677 $ 788.618K Jun 30, 2026
FFSM 0.58% 245,070 $ 8.619M Jul 31, 2026
SIXL 0.48% 23,214 $ 1.001M Nov 12, 2026
BTAL 0.36% 36,938 $ 1.016M Jun 30, 2026
LSVD 0.35% 64,820 $ 2.28M Jul 31, 2026
IALT 0.33% 539,023 $ 26.459M Nov 16, 2026
DFAT 0.31% 2,227,942 $ 96.091M Nov 12, 2026
JEMA 0.30% 112,376 $ 4.792M Nov 17, 2026
CVAR 0.30% 3,607 $ 126.858K Jul 31, 2026
ENHI 0.27% 1,176 $ 57.726K Nov 16, 2026
HWSM 0.25% 252 $ 6,930.00 Jun 30, 2026
JIVE 0.23% 256,132 $ 10.921M Nov 17, 2026
VFVA 0.23% 57,455 $ 2.182M Aug 31, 2026
VFQY 0.20% 27,063 $ 1.028M Aug 31, 2026
DFAS 0.15% 1,181,528 $ 50.959M Nov 12, 2026
SMDX 0.14% 4,084 $ 180.84K Nov 17, 2026
VFMF 0.14% 35,761 $ 1.358M Aug 31, 2026
DFSV 0.12% 770,924 $ 33.25M Nov 12, 2026
CORO 0.12% 406,108 $ 19.936M Nov 16, 2026
FEMV 0.11% 214 $ 5,885.00 Jun 30, 2026
GMOV 0.11% 3,043 $ 115.573K Aug 31, 2026
REMC 0.10% 127 $ 3,492.50 Jun 30, 2026
LCTD 0.09% 5,634 $ 276.555K Nov 16, 2026
JMEE 0.09% 59,334 $ 2.53M Nov 17, 2026
JSTC 0.07% 4,622 $ 204.662K Nov 17, 2026
GVLU 0.07% 4,273 $ 189.208K Nov 17, 2026
DFSU 0.04% 24,601 $ 1.061M Nov 12, 2026
DXUV 0.04% 63,036 $ 2.719M Nov 12, 2026
DFUV 0.04% 145,280 $ 6.266M Nov 12, 2026
SFGV 0.04% 11,409 $ 490K Nov 18, 2026
DFAC 0.03% 684,234 $ 29.511M Nov 12, 2026
AVUS 0.03% 90,380 $ 4.002M Nov 16, 2026
DCOR 0.03% 300,032 $ 12.94M Nov 12, 2026
AVSC 0.02% 16,996 $ 752.583K Nov 16, 2026
AVSU 0.02% 1,959 $ 86.745K Nov 16, 2026
DFAU 0.01% 40,835 $ 1.761M Nov 12, 2026
AVMC 0.01% 1,591 $ 70.449K Nov 16, 2026
DFUS 0.01% 47,818 $ 2.062M Nov 12, 2026
VSLU 0.01% 1,817 $ 49.968K Jun 30, 2026
EBI 0.00% 802 $ 30.46K Aug 31, 2026
AVLC 0.00% 1,257 $ 55.66K Nov 16, 2026
AVMV 0.00% 810 $ 35.867K Nov 16, 2026