August 27, 2026
SHANGHAI, Aug. 27, 2026 (GLOBE NEWSWIRE) -- FinVolution Group (“FinVolution” or the “Company”) (NYSE: FINV), a leading fintech platform across China and overseas markets, today announced its unaudited financial results for the second quarter ended June 30, 2026.
| | For the Three Months Ended/As of | YoY Change |
| | June 30, 2025 | June 30, 2026 |
| Total Transaction Volume **(RMB in billions)**1 | 54.0 | 44.8 | -17.0% |
| - Chinese Mainland2 | 50.8 | 41.0 | -19.3% |
| - Overseas Markets3 | 3.2 | 3.8 | 18.8% |
| | | | |
| Total Outstanding Loan Balance (RMB in billions) | 77.5 | 67.9 | -12.4% |
| - Chinese Mainland4 | 75.4 | 65.4 | -13.3% |
| - Overseas Markets5 | 2.1 | 2.5 | 19.0% |
| | | | |
Second Quarter 2026 Highlights
Chinese Mainland Market
-
Cumulative registered users reached 192.8 million as of June 30, 2026, an increase of 6.6% compared with June 30, 2025.
-
Cumulative borrowers reached 30.1 million as of June 30, 2026, an increase of 7.9% compared with June 30, 2025.
-
Number of unique borrowers6 for the second quarter of 2026 was 1.8 million, a decrease of 18.2% compared with the same period of 2025.
-
Transaction volume2 was RMB41.0 billion for the second quarter of 2026, a decrease of 19.3% compared with the same period of 2025.
-
Transaction volume facilitated for repeat individual borrowers7 for the second quarter of 2026 was RMB34.8 billion, a decrease of 20.5% compared with the same period of 2025.
-
Outstanding loan balance4 was RMB65.4 billion as of June 30, 2026, a decrease of 13.3% compared with June 30, 2025.
-
Average loan size was RMB10,742 for the second quarter of 2026, compared with RMB10,056 for the same period of 2025.
-
Average loan tenure was 8.5 months for the second quarter of 2026, compared with 8.3 months for the same period of 2025.
-
90 day+ delinquency ratio8 was 2.10% as of June 30, 2026.
-
Net revenue9 was RMB2,396.7 million (US$353.2 million) for the second quarter of 2026, compared with RMB2,781.3 million for the same period of 2025.
-
U.S. GAAP operating profit10 was RMB624.8 million (US$92.1 million) for the second quarter of 2026, compared with RMB913.6 million for the same period of 2025.
-
Non-GAAP adjusted EBITDA11, which excludes depreciation and amortization and share-based compensation expenses from operating profit, was RMB641.9 million (US$94.6 million) for the second quarter of 2026, compared with RMB930.6 million for the same period of 2025.
Overseas Markets
-
Cumulative registered users reached 61.4 million as of June 30, 2026, an increase of 43.5% compared with June 30, 2025.
-
Cumulative borrowers reached 15.6 million as of June 30, 2026, an increase of 79.3% compared with June 30, 2025.
-
Number of unique borrowers12 for the second quarter of 2026 was 5.3 million, an increase of 130.4% compared with the same period of 2025.
-
Number of new borrowers13 for the second quarter of 2026 was 2.2 million, an increase of 100.0% compared with the same period of 2025.
-
Transaction volume3 reached RMB3.8 billion for the second quarter of 2026, an increase of 18.8% compared with the same period of 2025.
-
Outstanding loan balance5 reached RMB2.5 billion as of June 30, 2026, an increase of 19.0% compared with June 30, 2025.
-
Net revenue14 was RMB930.3 million (US$137.1 million) for the second quarter of 2026, an increase of 18.0% compared with the same period of 2025, representing 27.3% of total revenue for the second quarter of 2026.
-
U.S. GAAP operating profit10 was RMB53.6 million (US$7.9 million) for the second quarter of 2026, compared with RMB25.6 million for the same period of 2025.
-
Non-GAAP adjusted EBITDA11, which excludes depreciation and amortization and share-based compensation expenses from operating profit, was RMB55.3 million (US$8.1 million) for the second quarter of 2026, compared with RMB26.6 million for the same period of 2025.
Group Financial Highlights
-
Net revenue was RMB3,403.2 million (US$501.6 million) for the second quarter of 2026, compared with RMB3,578.0 million for the same period of 2025.
-
Net profit was RMB426.8 million (US$62.9 million) for the second quarter of 2026, compared with RMB751.3 million for the same period of 2025.
-
U.S. GAAP operating profit was RMB529.2 million (US$78.0 million) for the second quarter of 2026, compared with RMB815.5 million for the same period of 2025.
-
Non-GAAP adjusted operating profit15, which excludes share-based compensation expenses before tax, was RMB572.1 million (US$84.3 million) for the second quarter of 2026, compared with RMB854.8 million for the same period of 2025.
-
Diluted net profit per American depositary share (“ADS”) was RMB1.80 (US$0.26) and diluted net profit per share was RMB0.36 (US$0.05) for the second quarter of 2026, compared with RMB2.82 and RMB0.56 for the same period of 2025, respectively.
-
Non-GAAP diluted net profit per ADS was RMB1.97 (US$0.29) and non-GAAP diluted net profit per share was RMB0.39 (US$0.06) for the second quarter of 2026, compared with RMB2.97 and RMB0.59 for the same period of 2025, respectively. Each ADS of the Company represents five Class A ordinary shares of the Company.
1 Represents the total transaction volume facilitated in the Chinese Mainland and overseas markets on the Company’s platform during the period presented. 2 Represents our transaction volume facilitated in the Chinese Mainland during the period presented. During the second quarter, RMB14.4 billion was facilitated under the capital-light model, for which the Company does not bear principal risk. 3 Represents our transaction volume facilitated in Indonesia, the Philippines and Australia during the period presented. 4 Outstanding loan balance as of any date refers to the balance of outstanding loans in the Chinese Mainland market excluding loans delinquent for more than 180 days from such date. As of June 30, 2026, RMB33.4 billion was facilitated under the capital-light model, for which the Company does not bear principal risk. 5 Outstanding loan balance as of any date refers to the balance of outstanding loans in Indonesia, the Philippines and Australia excluding loans delinquent for more than 30 days from such date. 6 Represents the total number of borrowers in the Chinese Mainland who successfully borrowed on the Company’s platform during the period presented. 7 Represents the transaction volume facilitated for borrowers who had historically completed a transaction on the Company’s platform in the Chinese Mainland during the period presented. 8 “90 day+ delinquency ratio” refers to the outstanding principal balance of loans, excluding loans facilitated under the capital-light model, that were 90 to 179 calendar days past due as a percentage of the total outstanding principal balance of loans, excluding loans facilitated under the capital-light model on the Company’s platform as of a specific date. Loans that originated outside the Chinese Mainland are not included in the calculation. 9 Represents revenue from the Chinese Mainland. Prior period segment results from the Chinese Mainland have been recast to conform to the current period presentation. Please refer to the “Selected Segment Information” tables at the end of this release for a breakdown by segment for the periods presented. 10 Please refer to the “Selected Segment Information” tables at the end of this release for reconciliation between Operating Segment Profit/(Loss) and GAAP operating profit. 11 Please refer to the “Selected Segment Information” tables at the end of this release for reconciliation between GAAP operating profit and Non-GAAP adjusted EBITDA. 12 Represents the total number of borrowers in Indonesia, the Philippines and Australia who successfully borrowed on the Company’s platforms during the period presented. 13 Represents the total number of new borrowers in Indonesia, the Philippines and Australia whose transactions were facilitated on the Company’s platforms during the period presented. 14 Represents revenue from overseas markets outside the Chinese Mainland, namely Indonesia, the Philippines, and Australia. Prior period segment results from overseas markets have been recast to conform to the current period presentation. Please refer to “Selected Segment Information” for a breakdown by segment for the periods presented. 15 Please refer to “UNAUDITED Reconciliation of GAAP and Non-GAAP Results” for reconciliation between GAAP and Non-GAAP adjusted operating profit. 16 The Company has reclassified certain items within its consolidated balance sheets for the first quarter of 2026, including amounts between Loans receivable and Accounts receivable. These balance sheet reclassifications also resulted in corresponding changes in the presentation of certain items in the consolidated statements of cash flows under the indirect method. The impact of these reclassifications has been reflected in the consolidated statements of cash flows for the six months ended June 30, 2026.
Mr. Tiezheng Li, Vice Chairman and Chief Executive Officer of FinVolution, commented, "Our second quarter results reflect a growing recovery following the risk mitigation actions we took in the second half of last year, with transaction volume, net revenue, and net profit all up sequentially. Both our Chinese Mainland and Overseas segments delivered resilient performances against an evolving regulatory and macro backdrop across several of our markets, reinforcing the value of our two-engine model.
"Asset quality in the Chinese Mainland segment remained solid, supported by the healthier borrower mix we captured during this year's industry consolidation. Meanwhile, the Overseas segment continued to gain traction under our 'Local Excellence, Global Outlook+' strategy. Our unique borrower base more than doubled to 5.3 million, driving continued overall profitability across our international footprint, underscoring the growing earnings power of our diversified platform.
"As we enter the third quarter, we are navigating industry headwinds as institutional funding in China tightens at the moment coupled with an evolving risk environment. We intend to stay disciplined on origination rather than chase high-risk volume. Our dual-engine profitability, technology edge and healthy, low-leverage balance sheet give us the flexibility to manage this period while continuing to build long-term value for customers and shareholders," concluded Mr. Li.
Mr. Jiayuan Xu, Chief Financial Officer of FinVolution, continued, "Total net revenues were RMB3.4 billion for the second quarter, up 6% sequentially, and net profit was RMB426.8 million, up 1% sequentially. The Chinese Mainland segment contributed RMB2.4 billion in revenue, up 8% sequentially. Overseas segment revenue was RMB930.3 million, up 18% year over year. Overseas operating profit more than doubled to RMB53.6 million, demonstrating sustained profitability across our international footprint.
“Our balance sheet remains robust, with RMB6.4 billion in cash and short-term investments, while our leverage ratio stands at 2.1x, around historic lows. We repurchased US$27.4 million in shares during the quarter, bringing our first-half 2026 total to US$66.8 million. Despite anticipated industry headwinds in the third quarter, we are maintaining our full-year revenue outlook of RMB11.5 billion to RMB12.9 billion. We remain committed to disciplined execution and to delivering sustainable, long-term value for our shareholders," concluded Mr. Xu.
Second Quarter 2026 Financial Results
Net revenue for the second quarter of 2026 was RMB3,403.2 million (US$501.6 million), compared with RMB3,578.0 million for the same period of 2025. This decrease was primarily due to decreases in loan facilitation service fees, post-facilitation service fees and guarantee income, partially offset by increases in net interest income.
Loan facilitation service fees were RMB1,313.8 million (US$193.6 million) for the second quarter of 2026, compared with RMB1,515.3 million for the same period of 2025. The decrease was primarily due to decreases in transaction volume in the Chinese Mainland market, partially offset by the increase in transaction volume in overseas markets.
Post-facilitation service fees were RMB386.0 million (US$56.9 million) for the second quarter of 2026, compared with RMB425.6 million for the same period of 2025. This decrease was primarily due to the rolling impact of deferred transaction fees.
Guarantee income was RMB904.5 million (US$133.3 million) for the second quarter of 2026, compared with RMB1,046.6 million for the same period of 2025. This decrease was primarily due to the decrease in risk-bearing loans in the Chinese Mainland market, as well as the rolling impact of deferred guarantee income. The fair value of quality assurance commitment upon loan origination is released as guarantee income systematically over the term of the loans subject to quality assurance commitment.
Net interest income was RMB474.3 million (US$69.9 million) for the second quarter of 2026, compared with RMB272.1 million for the same period of 2025. This increase mainly resulted from the increase in the average outstanding loan balances of on-balance sheet loans in both the Chinese Mainland and overseas markets, partially offset by the decrease in interest yield in the Chinese Mainland market.
Other revenue was RMB324.6 million (US$47.8 million) for the second quarter of 2026, compared with RMB318.3 million for the same period of 2025. This increase was primarily due to the increase in the contributions from other revenue streams, including other value-added services.
Origination, servicing expenses and other costs of revenue were RMB732.9 million (US$108.0 million) for the second quarter of 2026, compared with RMB674.5 million for the same period of 2025. This increase was primarily driven by the increase in employee expenditures in both the Chinese Mainland and overseas markets, partially offset by the decrease in loan collection expenses in the Chinese Mainland market.
Sales and marketing expenses were RMB480.9 million (US$70.9 million) for the second quarter of 2026, compared with RMB606.4 million for the same period of 2025. This decrease was primarily due to improved efficiency and decreased investment in marketing activities in the Chinese Mainland market.
Research and development expenses were RMB118.9 million (US$17.5 million) for the second quarter of 2026, compared with RMB129.0 million for the same period of 2025. This decrease was primarily due to efficiency improvements in technology development.
General and administrative expenses were RMB106.3 million (US$15.7 million) for the second quarter of 2026, compared with RMB110.2 million for the same period of 2025. This decrease was primarily due to a decrease in professional services fees.
Provision for accounts receivable and contract assetswas RMB97.9 million (US$14.4 million) for the second quarter of 2026, compared with RMB106.3 million for the same period of 2025. The decrease was primarily due to decreased transaction volume of off-balance sheet loans in the Chinese Mainland.
Provision for loans****receivable was RMB164.4 million (US$24.2 million) for the second quarter of 2026, compared with RMB98.4 million for the same period of 2025. This increase was primarily due to the increase in the outstanding loan balance of on-balance sheet loans in the Chinese Mainland and overseas markets.
Credit losses for quality assurance commitment were RMB1,108.8 million (US$163.4 million) for the second quarter of 2026, compared with RMB987.1 million for the same period of 2025. The increase was primarily due to the increase in risk-bearing loans in the overseas markets.
Impairment of goodwill and intangible assetswas RMB63.8 million (US$9.4 million) for the second quarter of 2026, compared with RMB50.4 million for the same period of 2025. The impairment of intangible assets in 2026 was primarily due to an impairment of micro-lending licenses related to a certain micro-lending company acquired by the Group in 2017, following a performance review during the quarter.
Operating profit was RMB529.2 million (US$78.0 million) for the second quarter of 2026, compared with RMB815.5 million for the same period of 2025.
Non-GAAP adjusted operating profit, which excludes share-based compensation expenses before tax, was RMB572.1 million (US$84.3 million) for the second quarter of 2026, compared with RMB854.8 million for the same period of 2025.
Other income was RMB33.9 million (US$5.0 million) for the second quarter of 2026, compared with RMB115.9 million for the same period of 2025. The decrease was mainly due to an increase in foreign exchange losses and a decrease in government subsidies.
Income tax expensewas RMB116.4 million (US$17.1 million) for the second quarter of 2026, compared with RMB178.7 million for the same period of 2025. This decrease was mainly due to the decrease in pre-tax profit.
Net profit was RMB426.8 million (US$62.9 million) for the second quarter of 2026, compared with RMB751.3 million for the same period of 2025.
Net profit attributable to ordinary shareholders of the Company was RMB441.6 million (US$65.1 million) for the second quarter of 2026, compared with RMB747.0 million for the same period of 2025.
Diluted net profit per ADS was RMB1.80 (US$0.26) and diluted net profit per share was RMB0.36 (US$0.05) for the second quarter of 2026, compared with RMB2.82 and RMB0.56 for the same period of 2025, respectively.
Non-GAAP diluted net profit per ADS was RMB1.97 (US$0.29) and non-GAAP diluted net profit per share was RMB0.39 (US$0.06) for the second quarter of 2026, compared with RMB2.97 and RMB0.59 for the same period of 2025, respectively. Each ADS represents five Class A ordinary shares of the Company.
As of June 30, 2026, the Company had cash and cash equivalents of RMB3,259.4 million (US$480.4 million) and short-term investments, mainly in wealth management products and term deposits, of RMB3,162.0 million (US$466.0 million).
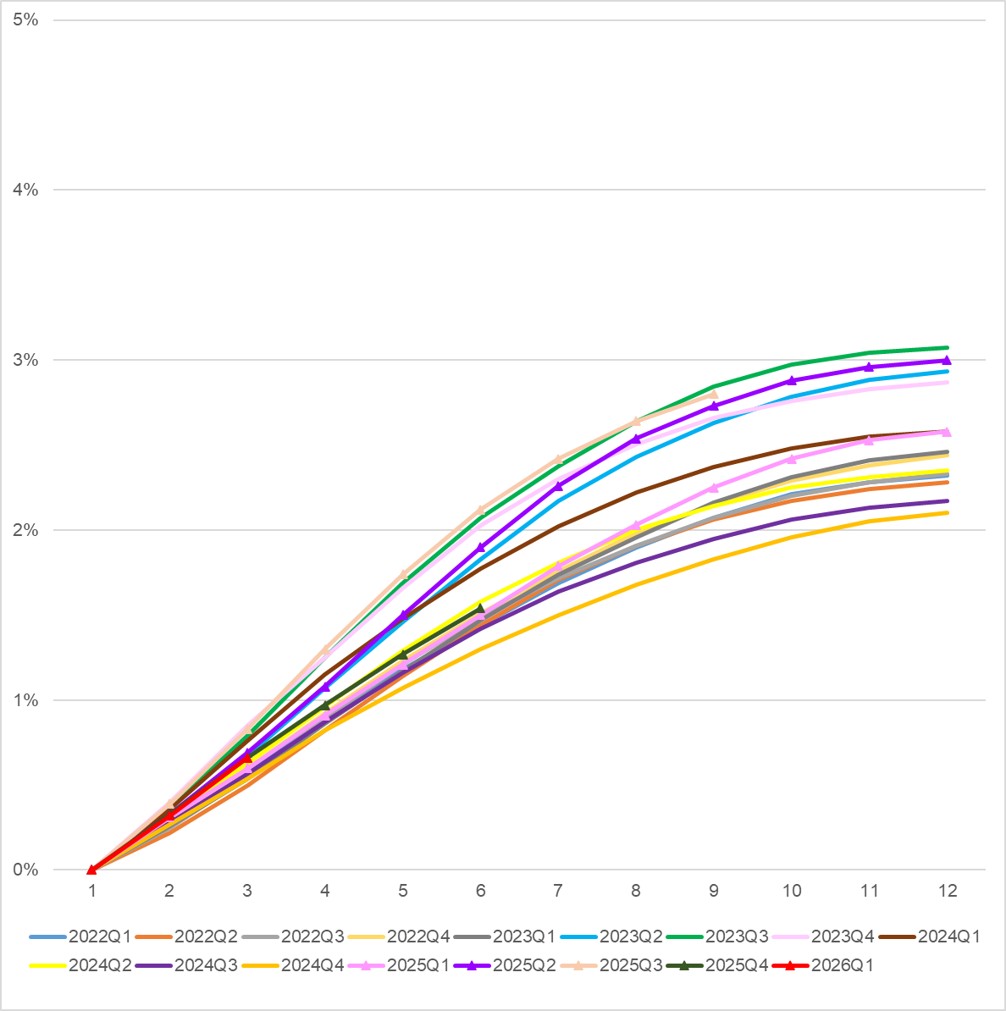
The following chart shows the historical cumulative 30-day plus past due delinquency rates by loan origination vintage for loan products facilitated through the Company’s platform in the Chinese Mainland as of June 30, 2026. Loans facilitated under the capital-light model, for which the Company does not bear principal risk, are excluded from the chart.
Shares Repurchase Update
For the second quarter of 2026, the Company deployed approximately US$27.4 million to repurchase its own Class A ordinary shares in the form of ADSs. As of June 30, 2026, in combination with the Company’s historical and existing share repurchase programs, the Company had cumulatively repurchased its own Class A ordinary shares in the form of ADSs with a total aggregate value of approximately US$544.1 million since 2018.
Business Outlook
Looking ahead to the third quarter, we anticipate a considerable contraction in transaction volume in China, reflecting industry headwinds as institutional funding to the industry tightens at the moment. Despite this near-term impact, underpinned by the strength of our two-engine model and disciplined execution, we reiterate the Company’s full-year 2026 total revenue guidance to be in the range of approximately RMB11.5 billion to RMB12.9 billion.
The above forecast is based on the current market conditions and reflects the Company’s current preliminary views and expectations on market and operational conditions and the regulatory and operating environment, as well as customers’ and institutional partners’ demands, all of which are subject to change.
Conference Call
The Company’s management will host an earnings conference call at 8:30 PM U.S. Eastern Time on August 27, 2026 (8:30 AM Beijing/Hong Kong Time on August 28, 2026).
Participants should complete online registration using the link provided below at least 15 minutes before the scheduled start time. Upon registration, participants will receive the conference call access information, including dial-in numbers, a personal PIN and an e-mail with detailed instructions to join the conference call.
Participant Online Registration: https://register-conf.media-server.com/register/BI0f0012327500446398832920fa161c5b
Additionally, a live and archived webcast of the conference call will be available on the Company's investor relations website at https://ir.finvgroup.com.
About FinVolution Group
FinVolution Group is a leading fintech platform with strong brand recognition across China and overseas markets, connecting borrowers of the young generation with financial institutions. Established in 2007, the Company is a pioneer in China's online consumer finance industry and has developed innovative technologies and accumulated in-depth experience in the core areas of credit risk assessment, fraud detection, big data and artificial intelligence. The Company's platform, empowered by proprietary cutting-edge technologies, features a highly automated loan transaction process, which enables a superior user experience. As of June 30, 2026, the Company had 254.2 million cumulative registered users across China and overseas markets.