July 27, 2026 PDF Version NORWALK, Conn., July 27, 2026 (GLOBE NEWSWIRE) -- FactSet (NYSE:FDS | NASDAQ:FDS), a leading global data and AI solutions provider to the financial markets, today announced that Di Hirji has been appointed Chief People &…
July 27, 2026
PDF Version
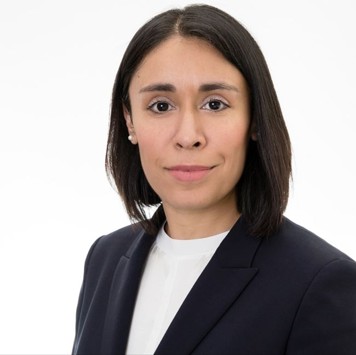
NORWALK, Conn., July 27, 2026 (GLOBE NEWSWIRE) -- FactSet (NYSE:FDS | NASDAQ:FDS), a leading global data and AI solutions provider to the financial markets, today announced that Di Hirji has been appointed Chief People & Workforce Transformation Officer, effective August 3, 2026. She will succeed Catrina Harding, who is leaving FactSet after three years and will remain in an advisory capacity through a transition period.
"We are delighted to welcome Di to FactSet," said Sanoke Viswanathan, Chief Executive Officer of FactSet. "As we accelerate our transformation to an AI-native company, how we design our organization, develop our people, and bring human and agentic capabilities together will be central to our success. Di is a proven people leader with deep transformation experience and is well positioned to help us build the workforce of FactSet's next chapter."
Di Hirji most recently served as Chief People Officer for S&P Global Market Intelligence and S&P Dow Jones Indices. Previously, she held senior HR leadership positions at Thomson Reuters and spent eight years in management consulting at Accenture, leading change and organization development programs for Fortune 500 and FTSE 100 clients. Hirji has worked across Europe, Asia, and the Americas over a career spanning more than 20 years.
"FactSet sits at the intersection of data, technology, and AI," said Di Hirji. "Becoming an AI-native company is as much a people story as a technology one — how we work, the skills we build, and how humans and AI come together will define what FactSet becomes. I look forward to building on the foundation Catrina, and the team have put in place, and to helping shape what comes next."
Viswanathan continued, "I want to thank Catrina for her leadership and partnership over the past three years. She has made meaningful contributions to FactSet as a leader and member of our executive team, and in strengthening our People function. We wish her every success in her future endeavors."
"Leading FactSet’s People organization has been one of the greatest privileges of my career,” said Catrina Harding. “I am proud of what we have built together and the foundation we have created for the future. I look forward to partnering with Di to ensure a seamless transition.”
About FactSet
FactSet (NYSE:FDS | NASDAQ:FDS) supercharges financial intelligence, offering enterprise data and information solutions that power our clients to maximize their potential. Our cutting-edge digital platform seamlessly integrates proprietary financial data, client datasets, third-party sources, and flexible technology to deliver tailored solutions across the buy-side, sell-side, wealth management, private equity, and corporate sectors. With over 47 years of expertise, offices in 19 countries, and extensive multi-asset class coverage, we leverage advanced data connectivity alongside AI and next-generation tools to streamline workflows, drive productivity, and enable smarter, faster decision-making. Serving more than 9,100 global clients and over 247,000 individual users, FactSet is a member of the S&P 500 dedicated to innovation and long-term client success. Learn more at www.factset.com and follow us on X and LinkedIn.
Forward-Looking Statements
This press release contains forward-looking statements based on management's current expectations, estimates, forecasts and projections about future events, trends, contingencies, and circumstances, industries in which FactSet operates and the beliefs and assumptions of management. All statements that address expectations, guidance, outlook or projections about the future, including statements about the Company's strategy, product development, revenues, future financial results, anticipated growth, market position, subscriptions, expected expenditures or investments, trends in FactSet’s business and financial results, are forward-looking statements. Forward-looking statements may be identified by words like "may," "might," "will," "should," "expects," "plans," "anticipates," "believes," "estimates," "intends," "projects," "indicates," "predicts," "potential," or "continue," the negative of those terms, and similar expressions. Forward-looking statements are not guarantees of future performance, outcomes, events, or actions and involve a number of known and unknown risks, uncertainties, and assumptions. Many factors, including those discussed more fully elsewhere in this release and in FactSet's filings with the Securities and Exchange Commission, particularly its latest annual report on Form 10-K, including Item 1A, Risk Factors, and quarterly reports on Form 10-Q, as well as others, could cause results, performance, achievements, or activities to differ materially from those expressed or implied by the forward-looking statements. Accordingly, the Company cautions readers not to place undue reliance on any forward-looking statements, which speak only as of the date they are made. FactSet assumes no duty to and does not undertake to update or revise any forward-looking statement to reflect events or circumstances arising after the date on which it is made, except as required by applicable law. Future results could differ materially from historical performance.
Investor Relations:
Kevin Toomey
+1.212.209.5259
[email protected]
Media Relations:
Alexandra Shevchenko
+44 075 1813 1115
[email protected]
A photo accompanying this announcement is available at https://www.globenewswire.com/NewsRoom/AttachmentNg/c55652b5-7a9a-4603-ac10-a4d6aa1ab9f8



Di Hirji's Headshot

The headshot of FactSet's newly appointed Chief People & Workforce Transformation Officer
Search Investors


















 View original content to download multimedia:


