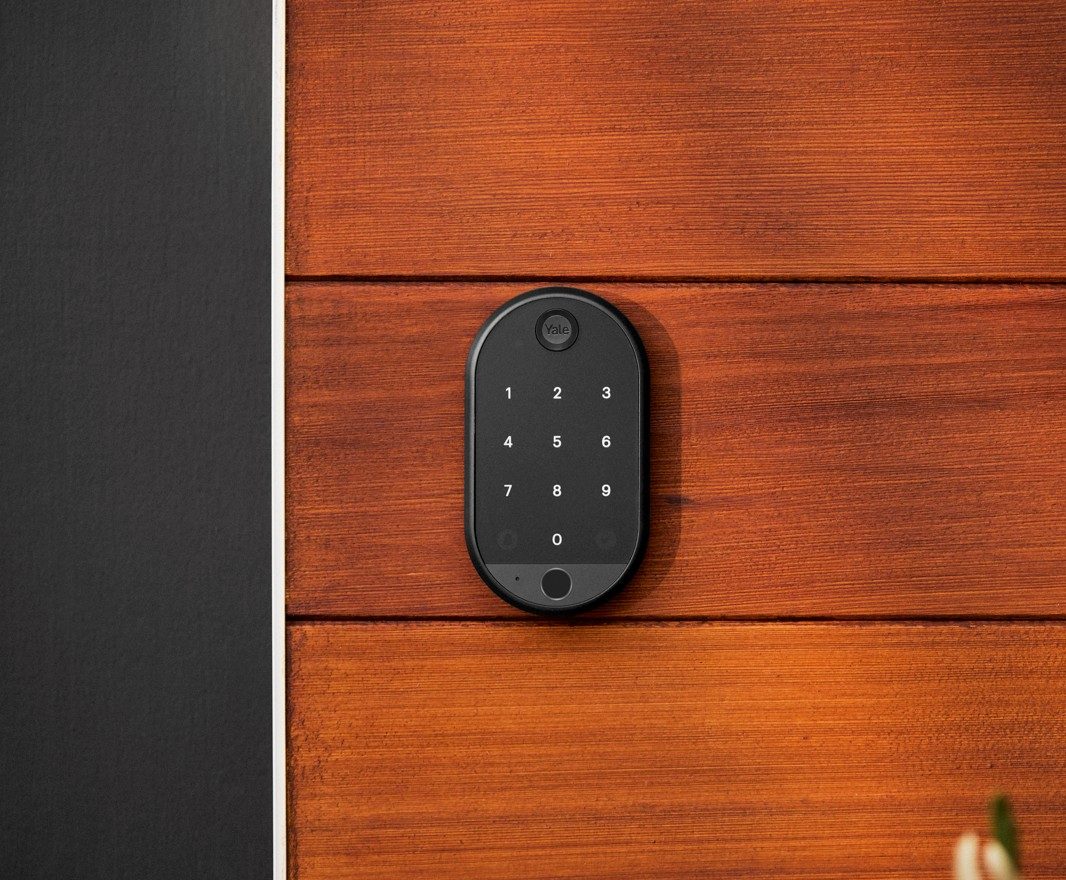
Fortune Brands Innovations, Inc. is a home, security, and digital products company operating primarily in North America and China. The company is organized into three business segments: Water Innovations, Outdoors & Security, and Digital. Its portfolio includes brands such as Moen, American Standard, TOTO, Rohl, Riobel, Perrin & Rowe, Victoria + Albert, Shaws, Aqualisa, Flo, SpringWell, Master Lock, Larson, Fiberon, Solar Innovations, Emtek, Schaub, Yale, and August. Products span faucets, toilets, showers, smart water management systems, composite decking, exterior doors, security locks, and smart home devices. The company sells through kitchen and bath dealers, wholesalers, industrial distributors, home centers, showrooms, and direct-to-consumer channels. Fortune Brands Innovations was established in 2011 as a spin-off from Fortune Brands, Inc., and completed the separation of its Cabinets business in December 2022.

Summarised from the company's own disclosures, fiscal year ended Feb 2026

Industry Building Products & Equipment Homepage fbin.com
Sector Industrials IR page fbin.com/investors
Tags
plumbing fixtures, smart water management, composite decking, security locks, smart home devices, outdoor living, residential construction, home improvement, Moen, American Standard, TOTO, Rohl, Riobel, Perrin & Rowe, Victoria + Albert, Shaws, Aqualisa, Flo, SpringWell, Master Lock, Larson, Fiberon, Solar Innovations, Emtek, Schaub, Yale, August
Press page —

Metrics

Valuation  
Market cap $ 4.508B
Market cap (USD) $ 4.508B
P/E 35.90
PEG —
P/BV 1.97
P/S 1.03
P/OCF 7.06
P/FCF 8.13
Dividend yield 1.9%
Turnover / mcap —
Returns  
ROE 12.4%
ROI 6.1%
ROIC 7.7%
Profit margin 6.7%
Growth  
Revenue growing No
Profits growing No
Revenue up 3y No
Revenue up 5y No
Earnings growth 3y (net profit CAGR) -24.2%
Quality  
Profitable Yes
Margin expanding No
Buying back stock Yes
Diluting (TTM) No
Debt/Equity 100.3%
Podcast bulls (TTM) Sign up
Podcast bears (TTM) Sign up
Podcast sentiment (TTM) Sign up
Podcast sentiment % (TTM) Sign up
News sentiment (TTM) 1
Quality score 0%
Insiders  
Buys, 1w Sign up
Buys, 1m Sign up
Buys, 1y Sign up
Sells, 1w Sign up
Sells, 1m Sign up
Sells, 1y Sign up

Sign up to see this company's insider trades

Figure FY 2025 FY 2024 FY 2023 FY 2022 FY 2021 FY 2020 FY 2019 FY 2018 FY 2017 FY 2016 FY 2015 FY 2014 FY 2013 FY 2012 FY 2011 FY 2010
Revenue 4.463B 4.609B 4.626B 4.723B 7.656B 6.09B 5.765B 5.485B 5.283B 4.985B 4.579B 4.014B 4.157B 3.591B 3.329B 3.234B
Net profit 298.8M 471.9M 404.5M 686.7M 772.4M 553.1M 431.9M 389.6M 472.6M 413.2M 315M 158.1M 229.7M 118.7M -35.6M 63.8M
Free cash flow 366.8M 474.5M 799.3M 320.2M 474.5M 675.2M 505.4M 453.9M 435.3M 501.2M 282.6M 126.2M 201.1M 207.8M 106.9M 80.6M

Figure FY 2025 FY 2024 FY 2023 FY 2022 FY 2021 FY 2020 FY 2019 FY 2018 FY 2017 FY 2016 FY 2015 FY 2014 FY 2013 FY 2012 FY 2011 FY 2010
Share price 50.02 68.33 76.14 57.11 106.9 85.72 65.34 37.99 68.44 53.46 55.5 45.27 45.7 29.22 16.95 —
Price performance 12m -0.27 -0.1 0.33 -0.47 0.25 0.31 0.72 -0.44 0.28 -0.04 0.23 -0.01 0.56 0.72 — —

Filed figures

Figure Dec 2016 Dec 2017 Dec 2018 Dec 2019 Dec 2020 Dec 2021 Dec 2022 Dec 2023 Dec 2024 Dec 2025
Balance sheet detail
Trade receivables (USD) 551M 555M 572M 625M 735M 886M 522M 534M 514M 513M
↳ YoY growth +9.6% +0.8% +3.0% +9.3% +17.6% +20.5% -41.1% +2.4% -3.7% -0.3%
↳ 5y CAGR +9.7% +7.8% +3.7% +6.4% +7.9% +10.0% -1.2% -1.3% -3.8% -6.9%
Borrowings, current (USD) 0.00 0.00 1.05B 799M — 800M 1.2B 0.00 999M 0.00
Borrowings, non-current (USD) 1.43B 1.51B 1.81B 1.78B 2.57B 2.31B 2.07B 2.67B 2.17B 2.54B
Lease liabilities (USD) — — — 140M 179M 202M 126M 180M 153M 274M
Cash and deposits (USD) 252M 323M 263M 388M 419M 472M 643M 366M 381M 264M
Intangible assets (USD) 1.11B 1.16B 1.25B 1.17B 1.42B 1.38B 1B 1.35B 1.3B 1.23B
Right-of-use assets (USD) — — — 166M 170M 192M 119M 174M 148M 260M
Net debt (borrowings + leases - cash) (USD) 1.18B 1.18B 2.6B 2.34B 2.33B 2.84B 2.76B 2.48B 2.94B 2.55B
Cash flow detail
Operating cash flow (USD) 651M 600M 604M 637M 826M 689M 566M 1.06B 668M 479M
Purchases of property, plant and equipment (USD) -149M -165M -150M -132M -151M -214M -246M -257M -193M -112M
Change in receivables (cash effect) (USD) -39.1M 1M 9.8M -50.7M -85.7M -152M 66.3M 25.7M 6.3M 5.6M
Change in inventories (cash effect) (USD) 52.4M -24.8M -55M -38.3M -91.8M -324M -199M 149M 16.6M -55.4M
Change in payables (cash effect) (USD) 57.6M 24M 21M 8.7M 143M 138M -161M 101M -29.3M 9.5M
Dividends paid (cash effect) (USD) -98.2M -110M -115M -123M -133M -143M -146M -117M -120M -121M
Share buybacks (cash effect) (USD) -425M -215M -695M -100M -188M -448M -580M -150M -240M -248M
Interest paid (cash effect) (USD) -43.7M -44.4M -63.4M -81M -76.2M -76.8M -103M -121M -127M -123M
Income taxes paid (cash effect) (USD) 600,000 -170M -114M -145M -176M -229M -278M -120M -152M -79M
Share-based compensation (USD) 32M 43M 36.1M 30.5M 47.6M 50.2M 50.2M 34.2M 39.3M 20.8M
Operating cash flow before change in receivables (USD) 690M 599M 594M 688M 911M 840M 500M 1.03B 662M 473M
Free cash flow (OCF - PPE - intangibles) (USD) 501M 435M 454M 505M 675M 475M 320M 799M 475M 367M
Income detail
Research and development expense (USD) 53.1M 50.7M 50.3M 48.2M — — — — — —
↳ 5y CAGR +8.6% +1.5% -2.0% +0.9%
Total comprehensive income (USD) 394M 505M 362M 434M 572M 803M 740M 430M 451M 321M
Comprehensive income to owners (USD) 394M 505M 362M 435M 571M 803M 740M — — —
Reported Feb 28, 2017 Feb 28, 2018 Feb 25, 2019 Feb 24, 2021 Feb 24, 2021 Feb 28, 2022 Feb 28, 2023 Feb 27, 2024 Feb 25, 2025 Feb 23, 2026

Sign up to see institutional holdings

Sign Up

Podcast Mentions

Sign up to see podcast mentions and sentiment

Sign Up

Company Also Announces Anticipated Retirements of

Longtime Directors David Mackay and Ann Hackett

DEERFIELD, Ill.--(BUSINESS WIRE)—Nov. 9, 2026--Fortune Brands Innovations, Inc. (NYSE: FBIN) (“Fortune Brands” or the “Company”), an industry-leading home, security and digital products company, today announced that the Board of Directors has elected Victor Grizzle as a Class I member of the Board, effective January 1, 2027, and for a term continuing until the Company’s 2027 annual meeting of shareholders.

Grizzle brings more than three decades of leadership experience across building products, industrial manufacturing and engineered products. He currently serves as Executive Chair of Armstrong World Industries, where he previously served for 10 years as President and Chief Executive Officer. During his time as CEO, he oversaw a significant transformation of the business focused on profitable growth, portfolio expansion and operational performance. Earlier in his career, he held senior leadership roles at Valmont Industries and GE. He is also an independent director of Franklin Electric Co.


Highlights:

•Q3 2026 sales were $1.1 billion, a decrease of 3.1 percent versus Q3 2025; sales excluding the impact of China decreased 2.4 percent

•Q3 2026 GAAP EPS was $0.42, inclusive of a ($0.47) asset impairment charge

•Q3 2026 EPS before charges / gains was $1.14, inclusive of a $0.28 net tax benefit and $0.14 of net tariff refunds1

•Took portfolio optimization actions related to Fiberon, the Company's China business and EMEA operating footprint

•Recently implemented leadership changes to strengthen execution and enable greater focus on individual business performance

•Updating full year 2026 guidance, reflecting actions to set up the Company for future success

DEERFIELD, Ill.--(BUSINESS WIRE)--November 3, 2026--Fortune Brands Innovations, Inc. (NYSE: FBIN) (“Fortune Brands” or the “Company”), an industry-leading home, security and digital products company, today announced third quarter 2026 results.

“Fortune Brands is in the early stages of a multi-year turnaround plan to get Back to Business. We are building from a strong foundation of brands that consumers and pros know and trust.

Dave Barry to lead Moen; Peter DuBois to join Fortune Brands Leadership Team as Chief Information Officer

DEERFIELD, Ill.--(BUSINESS WIRE)--Oct. 27, 2026--Fortune Brands Innovations, Inc. (NYSE: FBIN) (“Fortune Brands” or the “Company”), an industry-leading home, security and digital products company, today announced leadership and organizational changes designed to enable greater focus within its businesses, strengthen execution and enhance enterprise technology capabilities.

Enabling Greater Focus for Moen and House of Rohl

The Company is evolving the leadership structure for Moen and House of Rohl to enable greater focus on each business.

Dave Barry will assume leadership of the Moen business as EVP and President, Moen. Rachel Roberts, who previously led the Water segment, will become Chief Commercial Officer for Moen. House of Rohl will continue to be led by Matt Zimmer, General Manager, who has held the role since June 2026 and will now report directly to Chief Executive Officer Jesse Singh.

Prompts

Fortune Brands Innovations, Inc. (ticker FBIN), listed in United States.

Company History

Date Change Detail
Dec 16, 2022 Renamed FORTUNE BRANDS HOME & SECURITY, INC. → FORTUNE BRANDS INNOVATIONS, INC.
May 11, 2015 Acquired Acquired Norcraft Companies, Inc. (CIK 1582616). Its filings from before the deal are on its own company page, not shown here.

ETFs Holding Fortune Brands Innovations, Inc.

ETF Weight in ETF Shares Market value As of
FPAG 1.84% 181,290 $ 9.953M Jun 30, 2026
BLCV 1.57% 118,316 $ 5.647M Nov 16, 2026
KDVD 1.40% 2,146 $ 117.815K Jun 30, 2026
HWSM 1.08% 542 $ 29.756K Jun 30, 2026
DWSH short -1.05% -1,380 $ -64.694K Nov 17, 2026
SMLL 0.90% 2,573 $ 123.633K Nov 13, 2026
BTAL short -0.56% -28,842 $ -1.583M Jun 30, 2026
GVLU 0.42% 23,207 $ 1.108M Nov 17, 2026
MCDS 0.37% 622 $ 29.159K Nov 17, 2026
AFSM 0.31% 9,590 $ 457.731K Nov 16, 2026
LVDS 0.27% 6,755 $ 316.674K Nov 17, 2026
CDX short -0.26% -13,815.8297 $ -647.686K Nov 17, 2026
AVSC 0.26% 170,920 $ 8.158M Nov 16, 2026
DFAT 0.26% 1,705,657 $ 81.172M Nov 12, 2026
AFMC 0.24% 13,064 $ 623.545K Nov 16, 2026
GMOV 0.24% 5,767 $ 255.651K Aug 31, 2026
VFQY 0.24% 27,255 $ 1.208M Aug 31, 2026
VFVA 0.14% 31,041 $ 1.376M Aug 31, 2026
DFSV 0.12% 715,626 $ 34.057M Nov 12, 2026
DFAS 0.12% 816,846 $ 38.874M Nov 12, 2026
MSSM 0.11% 17,544 $ 777.726K Aug 31, 2026
NBCR 0.11% 20,360 $ 902.559K Aug 31, 2026
JMEE 0.07% 39,885 $ 1.87M Nov 17, 2026
DFUV 0.03% 100,924 $ 4.803M Nov 12, 2026
DXUV 0.03% 39,194 $ 1.865M Nov 12, 2026
DFAC 0.03% 464,847 $ 22.122M Nov 12, 2026
DFSU 0.02% 10,907 $ 519.064K Nov 12, 2026
DCOR 0.02% 143,198 $ 6.815M Nov 12, 2026
VSLU 0.01% 1,452 $ 79.715K Jun 30, 2026
DFAU 0.01% 28,904 $ 1.376M Nov 12, 2026
AVUS 0.01% 20,071 $ 957.989K Nov 16, 2026
AVSU 0.01% 960 $ 45.821K Nov 16, 2026
ENHU 0.01% 17 $ 811.41 Nov 16, 2026
INRO 0.01% 635 $ 30.309K Nov 16, 2026
SHRT 0.01% 33 $ 1,575.09 Nov 17, 2026
DFUS 0.01% 33,720 $ 1.605M Nov 12, 2026
MSLC 0.01% 4,860 $ 215.444K Aug 31, 2026
EBI 0.00% 219 $ 9,708.27 Aug 31, 2026
DFLV 0.00% 760 $ 36.168K Nov 12, 2026
IALT 0.00% 181 $ 8,639.13 Nov 16, 2026
LCTU 0.00% 6 $ 286.38 Nov 16, 2026