Fourth Quarter 2025 and FY2025 Third Quarter ResultsResults November March 16, 202604, 2025 Eve Holding, Inc. Fourth Quarter and FY2025 Results Year in Review Eve Air Mobility accomplished several milestones in 2025 – a defining year, as we…
Fourth
Quarter 2025
and FY2025
Third Quarter
ResultsResults
November
March
16, 202604, 2025
Eve Holding, Inc.
Fourth Quarter and FY2025 Results
Year in Review
Eve Air Mobility accomplished several milestones in 2025 – a defining year, as we continue to work to shape the
global Urban Air Mobility ecosystem.
With the selection of a new pusher motor supplier and the completion of several ground tests, Eve completed
the maiden flight of its engineering prototype in December, commencing what has now become a full-fledged
and intense flight campaign. Our prototype has flown a total of 28 times to date, accumulating more than 1
hour of flight time, with telemetry readings that are better than expected. Also, the campaign has been
progressing as planned, with initial hover and on-air maneuvers being performed. In total, we expect to fly
around 300 times with this prototype in 2026; at the current pace, we are well on our way to hitting this
milestone.
Simplicity is the DNA of our electric Vertical Take-Off and Landing (eVTOL) aircraft with a Lift+Cruise
configuration, eight dedicated propellers for vertical take-off and landing – that do not change position during
flight, and fixed wings for cruise flight. Our design also features a dual-electric-motor pusher for horizontal
propulsion redundancy, with performance and safety in mind. We believe fewer, simpler parts will help reduce
maintenance and operating costs, improve dispatchability for operators, and provide a clearer path to
certification.
We continue to be highly engaged with aviation authorities to advance in the certification processes of our
aircraft. In Brazil, the National Civil Aviation Agency will soon define the Means of Compliance – a detailed set of
rigorous tests that our aircraft must successfully perform to receive Type Certification. We expect to initiate our
certification campaign shortly thereafter. And, while our six conforming prototypes should be ready to initiate
the flight portion of the certification campaign in 2027, we accomplished a tremendous amount with ground tests
on rigs, simulations, wind-tunnel tests, and our Iron Bird – a deconstructed eVTOL that replicates the actual
aircraft and can be used to accumulate certification credits.
Eve’s strengths have resulted in the largest and most diversified backlog, totaling 2.7k LOIs (Letters of Intent).
We also began converting LOIs into firm orders and collecting pre-delivery payments, bringing the total to 100
aircraft under binding agreements. This, combined with the Services & Support Solutions (Eve TechCare®)
contracts, offers long-term revenue visibility and will help Eve smooth cash-flow consumption in the years to
come. Eve continues to advance Eve Vector®, our Urban Air Traffic Management software, to optimize and safely
scale Urban Air Mobility operations worldwide.
Importantly, last year we met all the milestones we had laid out to the market, including cash consumption of
$196 million (adjusted for working capital gains in 4Q25) – mostly in line with the low-end of 2025 guidance. In
total, Eve raised around $400 million in the last six months across a mix of debt and equity instruments,
demonstrating strong commitment from the investment community. With total liquidity at its highest level ever
– currently at $641 million, and a strong focus on cost discipline and efficiencies with Embraer, we are confident
that our financial position is sufficient to fund our Research & Development and operations through 2028.
There is no doubt that 2026 will be a challenging year. We will continue to operate with discipline in a tough
environment, and we still have a long and rigorous path ahead. Still, Eve continues to pave the way for what
lies ahead, and the way we closed 2025 says everything about who we are.
Last year’s accomplishments reinforced my belief that we have the right team, partners, mindset, and capabilities
to move through this phase with confidence, focus, and excellence. I am incredibly proud of what we achieved
together, and even more proud of how we achieved it. We did it with ownership, resilience, and a deep
commitment to safety and quality. I believe we are on the right track.
Let’s make 2026 another defining chapter in our journey!
1
Financial Highlights
Eve Air Mobility is an aerospace company dedicated to the development of an eVTOL (electric Vertical Takeoff
and Landing) aircraft and the Urban Air Mobility (UAM) ecosystem that includes aircraft development, Services
& Support solutions – TechCare and Vector, an Urban Air Traffic Management (Urban ATM) system. Eve is prerevenue; we do not expect meaningful revenue, if any, during the development phase of our aircraft, and we
expect financial results to be primarily driven by program development costs during this period.
Fourth Quarter 2025
Eve reported a net loss of $63.9 million in 4Q25 versus $40.7 million in 4Q24. The net loss in 4Q25 was primarily
driven by Research & Development (R&D) expenses, which cover costs and activities necessary to advance the
development of our UAM suite of products and services, including the Master Service Agreement (MSA) with
Embraer. R&D expenses were $59.4 million in 4Q25, vs. $33.7 million in 4Q24, with greater intensity in the
development of our eVTOL and greater engagement with third-party suppliers – via engineering services,
purchase of parts, and the early stages of the assembly of our conforming prototypes, and the final stages of
component design. Additionally, R&D efforts now demand increased engineering activity with Embraer,
incremental program development activities with suppliers, and testing infrastructure. The MSA primarily drives
our R&D costs with Embraer, which performs several developmental activities for Eve, as well as engineering
work with third-party suppliers.
Meanwhile, SG&A increased to $7.6 million, from $6.2 million in 4Q24, mostly due to (1) an increase in the
number of direct employees at Eve to approximately 200, from approximately 170 at the end of 2024, and (2)
a c.8% appreciation of the average Brazilian Real vs. the US dollar.
Total cash consumption in 4Q25 was $32.1 million, vs. $39.9 million in 4Q24, and was positively impacted by a
temporary deferral of a $21.3 million invoice with Embraer, as part of the MSA contract. If this invoice had been
paid last year, cash consumption would have been $53.4 million. Engineering services with Embraer and thirdparty suppliers account for most of the accounts payable, and Eve typically reimburses Embraer for
engineering/infrastructure costs 45 days after services are rendered. In contrast, third-party suppliers’ payments
are connected to specific program milestones.
Full Year 2025
Net loss in 2025 was $224.3 million, vs. $138.2 million the year before. R&D expenses reached $194.7 million
in 2025, up from $129.8 million in 2024, and SG&A expenses increased to $30.7 million, up from $26.5 million
in 2024. As with the quarterly numbers, the higher accumulated costs and expenses are primarily driven by
increased developmental activities necessary to advance our program.
Eve employed approximately 930 full-time collaborators – including personnel contracted through the MSA with
Embraer and its subsidiaries, as of 4Q25, versus c.900 at the end of 2024.
In 2025, cash consumption (operating activities + capital expenditures) was $175.2 million, and was also
positively impacted by the temporary working-capital gain observed in 4Q25. The invoices with Embraer were
paid in early 2026, so the normalized level of cash consumption was c.$196.5 million last year, slightly below
the $200 to $250 million range we had expected to invest in our program. Our cash consumption continues to
reflect our disciplined cost control and continued synergies with Embraer.
Eve’s Cash, Cash Equivalents, and Financial Investments totaled $392.5 million at the end of 2025, and total
liquidity – including undrawn credit lines with the BNDES (Brazil’s National Development Bank)- reached $541.4
million. We believe the funding is sufficient to support our operations and program investments through 2028.
The increase in our cash position during the year, despite the cash deployed in our program, reflects a new loan
raised during 4Q25 with an export credit agency and the August 2025 $230 million Registered Direct Equity
Offer.
Eve has drawn $118.2 million of the total funds made available by the BNDES thus far and, including unused
portions of a grant awarded to Eve last June, still has another $148.9 million available for future withdrawals.
We believe the credit lines offer attractive terms and conditions, and are aligned with Eve’s early-stage
development, including a long-term maturity and amortization grace period, which we expect will support Eve
as it continues to advance its eVTOL program. We expect to continue drawing from these facilities as our
development program advances, to optimize our cash position and capital.
2
Key Financial Indicators
USD millions
4Q25
4Q24
FY25
FY24
INCOME STATEMENT
Research & Development (R&D)
Selling, General & Administrative (SG&A)
Interest Income / Other Non-Operating Expenses, net
Net Earnings / (Loss)
(59.4)
(7.6)
3.0
(63.9)
(33.7)
(6.2)
(1.7)
(40.7)
(194.7)
(30.7)
2.1
(224.3)
(129.8)
(26.5)
18.7
(138.2)
CASH FLOW
Net Cash Used in Operating Activities
Net Additions to PP&E
Free Cash Flow*
Net Cash Provided by Financing Activities
(25.8)
(6.3)
(32.1)
12.8
(38.7)
(1.2)
(39.9)
65.2
(160.4)
(14.7)
(175.2)
263.1
(136.0)
(5.2)
(141.2)
203.0
15.3
27.1
126.7
303.4
392.5
179.8
541.4
0.6
14.3
55.3
241.1
303.4
132.0
428.6
BALANCE SHEET
Property, Plant & Equipment (PP&E)
Other Assets
Total Payables
Cash, Cash Equivalents, Financial Investments (Beg. of period)
Cash, Cash Equivalents, Financial Investments (End of period)
Total Debt
Total liquidity including BNDES Standby Facility and grant **
Notes
- Free Cash Flow is a non-GAAP measure and includes Net Cash Used in Operating Activities, Net Additions to PP&E
** Total Liquidity is a non-GAAP measure and includes Cash, Cash Equivalents, Financial Investments, Related Party Loan Receivable and undrawn BNDES standby facility
Upcoming Milestones
During 2025, Eve focused on advancing our eVTOL development program which culminated with the
commencement of the flight campaign of our engineering prototype that will be used to validate the performance
characteristics of our commercial aircraft. The full-scale prototype will be used to validate the performance
characteristics of the many tests we have performed over the years – either by utilizing individual rigs or in or
Computational Fluid Dynamics to estimate lift, aerodynamic drag, sound emission, energy consumption, etc. or
in different rigs or wind tunnels.
With funding secured through 2028, Eve will continue to accelerate program development with ambitious targets
for 2026 and 2027:
•
Engineering Prototype Flight Campaign
Our engineering prototype flew for the first time on December 19, 2025, kick-starting its flight campaign. As a
reminder, the engineering prototype will not be used for certification purposes, but rather to gain knowledge and
flight experience in an aircraft that shares the same configuration and similar systems of the final vehicle and
takes off and lands vertically, with transition to and from cruise in between. Also, it features most of the suppliers
of the final aircraft but not doesn’t feature all final systems, redundancies, and safety levels that will be present
in our commercial aircraft – the Eve-100, and as such, it is remote-controlled through a remoted pilot station
(RPS) truck.
Eve’s testing approach builds upon decades of Embraer experience. It is designed to leverage ground equipment
as much as possible, supported by dedicated rigs, high-fidelity simulations, and wind tunnel tests. On-air testing
is the very last phase in the campaign and is left to test what cannot be tested with ground equipment. This
reduces program risks, shrinks timelines, and total developmental costs. Moreover, our protocol means that the
components, configuration, and other specifications of our prototype are all mature and close to the final iteration
of the aircraft. In the end, this indirectly helps expedite our certification and entry into service efforts.
With the first flight of our engineering prototype, we plan an intensive campaign, with hundreds of flights planned
throughout 2026. Eve has trained 4 pilots for the engineering prototype and is qualifying another 2 to further
intensify testing. The prototype flight campaign will be divided into four distinct phases, each building on the
experience and learnings gained from the previous phases, and growing in complexity. We expect to complete
the entire campaign by the end of the year.
3
The flight campaign will be divided into four distinct stages:
- Hover, Low-speed Flights
The first stage is hover and initial maneuvers that were used to validate characteristics of the vertical flight. In
hover, the aircraft performed vertical take-off and landing procedures; although it gradually climbed to higher
altitudes and remained airborne longer, it remained at a fixed position in space and gradually evolved to on-air
maneuvers with aid of the lifter propulsion system.
In this phase, the aircraft operated within a controlled envelope of maximum altitude of 50ft, gradually reaching
this ceiling, a total area of 27.000ft, a maximum controlled speed of 10 knots, and a maximum climb speed of
250ft/minute.
Once the flight-rehearsal engineering team had gained the necessary knowledge and built enough confidence in
the aircraft's performance after the hover stage, it began to extend its flight envelope. Test pilots started to
perform several maneuvers – side-to-side movements, rotations on its axis, and longitudinal displacement – thus
departing from the previous fixed-position protocol.
For aerial maneuvers, the operating envelope was expanded to 240,000 square feet, maximum altitude of 100
ft, maximum speed of 15 knots and vertical speed of 375 feet / minute.
In total, Eve’s prototype has completed 28 flights, with an accumulated flight time of 1 hour and 6 minutes.
Importantly – weather permitting, flight tests are now taking place twice daily, accelerating the lessons learned
from our aircraft.
The engineering team is now calibrating the vehicle for more complex hover flights at higher speeds and altitudes.
The Load Calibration Ground Tests are an essential part of our testing process to clear the aircraft for more
complex upcoming flights.
4
PROTOTYPE FLIGHT CAMPAIGN
Total Flights:
28
Total Flight Time:
1 hour 06 minutes
28 1:12
26
24
0:57
22
17
16
15
19
18
20
0:43
13
8
1
Christmas / New Year's break
2
3
4
5
10
9
11
0:28
6
0:14
0:00
19-Dec-25
29-Dec-25
Total flights, left axis
08-Jan-26
18-Jan-26
28-Jan-26
Total time (hour:minutes), right axis
07-Feb-26
17-Feb-26
Denotes two flights per day
- Transition Flights
The partial transition initiates the stage in which the aircraft is displaced horizontally. Initially, at low speeds –
below 30 knots, the prototype will start to move forward with the lifters still engaged to maintain vertical support.
It is in this phase that the aircraft will start to accrue miles flying forward in anticipation of the following stage.
Pilots will gradually expand the flight envelope to cover longer distances.
We expect to perform 30/40 flights to complete this phase, which will include gradually faster flights, altitudes
up to 200 feet, and an area of 2.2 million share feet and vertical speeds up to 500 feet/minute.
- Cruise Flights
Under full transition, the prototype will perform the entire intended mission of the eVTOL. The aircraft will take
off horizontally – powered by its eight lifters, and once airborne, the pilots will engage the pusher to generate
forward momentum. At around 60-80 knots – depending on air temperature, humidity, and density, the air
flowing through the wings will provide all the necessary lift for the aircraft, and the lifters will be powered down.
The aircraft will continue to increase flight distance, time, and speed, among other metrics.
The landing procedure is the same as the take-off, but with the sequence of events reversed. The pusher will be
turned off, and the aircraft will begin to slow. The lifters will engage when the transition speed is reached, and
the pilot will maneuver the aircraft towards its landing site.
In this stage, the prototype will expand all performance metrics previously tested, with higher and faster flights
in a much greater area in Embraer’s Gavião Peixoto testing facility.
- Planned failures
The campaign's last stage is to introduce planned failures – motor shut–downs, systems failures, etc. This will
allow our flight engineering team to validate and refine the safety procedures and protocols for pilots in case of
in–flight emergencies.
5
• Start of Certification Campaign
Brazil’s Civil Aviation Authority (ANAC) published the Basis of Certification for Eve’s eVTOL in the country in
November 2024. This is a major milestone for the eVTOL industry and will allow Eve to progress towards ANAC
Type Certification (TC) and seek validation with the FAA (Federal Aviation Administration).
ANAC’s Basis of Certification establishes the first set of airworthiness criteria for eVTOLs in Brazil and follows
Eve’s application for TC in 2022. It is a standard process for developing a new certification basis and an important
milestone in the project. Following the definition of the airworthiness criteria, Eve is now focused on defining the
Means of Compliance - specific tests, analyses, and simulations that must be successfully performed for TC to be
granted. These tests are performed to prove the aircraft design, and that construction meets the safety standards
laid out in the Basis of Certification.
The definition of the Means of Compliance will allow Eve to initiate the certification campaign for Eve-100.
Importantly, because the certification protocol allows the use of ground rigs, high-fidelity simulations, our Iron
Bird, and other ground equipment for certification credits, our certification campaign will precede the initial flights
of the certification-compliant prototypes.
When these prototypes start flying – and accumulating certification credits, Eve will already be advanced in the
entire campaign. This should expedite the certification campaign and reduce risks and costs across the entire
process.
In October 2024, the FAA issued the Special Federal Aviation Regulation (SFAR) that details the final rules for
Advanced Air Mobility (AAM) and covers eVTOL. In general, the new FAA SFAR has been well received by the
U.S. Urban Air Mobility market, as it simplifies the pilot training process and allows single control eVTOLs, among
other advances.
Once TC is granted in Brazil, Eve plans to seek validation by other authorities, on as as-needed basis. The
company formalized validation with the FAA in 2023, enabling Eve to actively work with the FAA during the
certification process with ANAC, pursuing the concurrent issuance of each authority’s TC.
Eve inherited many of Embraer's development processes, including specialized rigs to thoroughly test individual
components before incorporating the optimal configuration into the final architecture, rather than assembling a
whole aircraft from the outset. This approach expedites design, testing, and certification processes, reducing
overall developmental costs. One such example is our Iron Bird; a proven development method used in previous
Embraer programs.
This is a structure built specifically to accommodate the aircraft's actual hardware (motors, battery, inverters,
actuators, avionics, electrical, and hydraulic systems, etc.) during the testing phase, serving as a skeleton of an
eVTOL.
This Iron Bird is connected to a flight simulator and controlled by a pilot. The entire system reacts physically to
pilot inputs read by the flight control system or joystick. The motors (lifters and pushers) spin at the appropriate
revolutions per minute to produce the necessary power for the intended maneuvers. The actuators are engaged
to control the flight surfaces and direct the aircraft in the desired direction. Avionics measures the flight's
performance and metrics. All the while, the battery powers the entire system, and Embraer's proprietary 5thgeneration fly-by-wire controls the pilot commands within the safety parameters of the performance envelope of
the eVTOL.
Importantly, although the Iron Bird is a "de-constructed" eVTOL, it is built with the exact specifications of the
final aircraft – the electric and electronic cables and wires have the same length, width, and insulation, the motors
are the same, as are other components. It uses the same battery as the final aircraft and the same thermal
management system. The Iron Bird yields valuable information on the behavior and durability of all components,
serving as an essential tool for assessing the system's actual physical performance and evaluating how well the
various components and subsystems work together. It also yields benefits for our TechCare suite of aftermarket
services, as it can predict the wear and tear of components and the structural integrity of the airframe, enabling
preventive maintenance.
6
• Assembly of Certification Prototypes
In addition to the flight tests of the full-scale engineering prototype, Eve plans to deploy six prototypes for the
certification campaign. While each prototype will have a specific intended goal and distinct role in the campaign,
they all serve a common goal – to prove the safety and reliability of Eve’s eVTOL design for commercial
operations. We have received some components of the first certification-compliant prototype, and we plan to
initiate the assembly of the first certification prototype later this year, with initial operations in 2027.
We are defining the Critical Design Review (CDR), during which we will issue the final detailed drawings to
suppliers, so they can start manufacturing each component. As mentioned previously, because of our
differentiated design approach – whereby we test extensively on the ground before taking flight, we believe this
final design to be mature and close to the final iteration of each component and the final aircraft.
Importantly, these aircraft will be piloted and have systems/sub-systems and redundancies similar to those in
the commercial aircraft. For instance, they will be fitted with passenger and pilot seats, with the batteries placed
between the passenger seats and the cargo area. This configuration will ensure that the prototypes have the
same dimensions and physical characteristics – including weight and center of gravity of the commercial aircraft,
to ensure high fidelity in the certification campaign vis-à-vis the expected performance of the commercial aircraft
at entry into service. These will be extensively tested and used to accumulate hours towards our certification
campaign.
• Total Cash Consumption Between $225 and $275 Million
With intensifying program development efforts, increased engagement with suppliers and initial assembly of our
certification prototypes, Eve expects to consume between $225 million and $275 million in 2026. This compares
to $196.5 million demanded by the program in 2025 (adjusted for working capital impact), $141.2 in 2024, and
$94.7 million in 2023.
The additional program activities require an increase in engineering hours, under our Master Service Agreement
with Embraer, as well as the acquisition of raw materials and parts/components for our certification-conforming
prototypes. Additionally, we will increase engagement with selected suppliers and receive equipment during the
year, which will trigger additional cash consumption in the coming months, as we initiate the flight tests of our
full-scale prototype. Lastly, cash consumption in 2026 will also reflect the initial stages of necessary investments
to prepare the Taubaté Facility for our needs.
While we continue to expect sequentially higher investments and expenses in the quarters ahead due to
intensifying engineering engagement and potential supplier payments, we are confident that our current liquidity
is sufficient to fund our operations, design, and certification efforts through 2028.
7
Latest Highlights
AirX Signs Firm Order Agreement with Eve Air Mobility for Two eVTOL
Aircraft
On February 3, 2026, Eve announced it had signed its second
binding order with Tokyo-based, AirX, a leading Japanese provider
of innovative air mobility services. The binding order includes the
purchase of up to 50 eVTOL aircraft. This agreement marks a
significant step toward advancing sustainable urban air mobility
solutions in Japan.
Under the terms of the agreement, AirX will integrate Eve's
cutting-edge eVTOL aircraft into its operations, supporting the
company's vision to offer efficient, zero-emission transportation
alternatives for urban and regional travel. The initial two aircraft
are expected to be delivered in 2029, with the potential for further
expansion as demand for advanced air mobility grows.
Eve Air Mobility's eVTOL aircraft are designed to provide safe,
reliable, and environmentally friendly transportation, leveraging
advanced technology to reduce noise and emissions while
enhancing passenger experience.
This agreement builds on Eve's growing global footprint and
underscores the increasing demand for sustainable air mobility
solutions worldwide.
Eve Air Mobility Secures $150 Million Financing to Accelerate eVTOL
Development
On January 20, 2026, Eve announced it had secured $150 million in debt financing from a syndicate of leading
financial institutions. The 5-year loan included Itau, Banco do Brasil, Citibank, and Mitsubishi UFJ Financial Group,
underscoring strong market confidence in Eve’s vision and long-term strategy.
The proceeds will support Eve’s research and development, including the integration of its eVTOL aircraft into a
comprehensive urban air mobility ecosystem. This funding accelerates technological progress and strengthens
partnerships with infrastructure providers and regulatory bodies. With these resources, the Company can advance
aircraft certification and commercialization while ensuring compliance with global aviation standards. This
transaction enhances Eve’s capacity to meet rising global demand for sustainable, low-emission transportation
and enables scalable operations in key urban markets.
With this transaction, Eve’s total funding now reaches $1.2 billion, reaffirming its status as one of the bestcapitalized companies in the emerging eVTOL market.
Eve Air Mobility Completes Successful First Flight of Full-Scale eVTOL
Prototype
On December 19, 2025, Eve completed the first flight of its uncrewed full-scale eVTOL
prototype at Embraer’s test facility in Gavião Peixoto, state of São Paulo.
The inaugural flight initiates Eve’s flight test phase and confirms the integration of key
systems, including the 5th-generation fly-by-wire concept and the fixed-pitch lifter
rotors. The company will perform multiple flights following today’s hover flight, gradually
expanding the envelope to transition into full wingborne flights throughout 2026.
Eve will manufacture six conforming prototypes to conduct the flight test campaign,
aiming for certification. The Company continues to engage with Brazil’s Civil Aviation
Agency (ANAC), Eve’s eVTOL primary certifying authority, to advance the certification
process. Looking ahead, Eve expects type certification, first deliveries, and entry into
service in 2027.
8
Next steps for the program include progressive envelope expansion and transitions to wingborne flight, as well
as continued engagement with ANAC, other regulators, and validating authorities, including FAA and EASA.
Eve leverages Embraer’s 56 years of aerospace expertise in designing, certifying, manufacturing, and delivering
state-of-the-art aircraft, as well as the company’s global aftermarket service footprint. Eve continues to focus on
safety, simplicity, and dispatchability to meet operator needs at scale.
Eve Celebrates Brazil’s Listing and Secures $40 Million Debt from BNDES
to eVTOL Program
On December 9, 2025, Eve took part in the opening bell ceremony at Brazil’s stock exchange (B3) in São Paulo
to celebrate its listing on the exchange, which occurred in August of this year.
Eve’s listing in Brazil, complementing its presence on the New York Stock Exchange since 2022, aligns with the
company’s strategy to diversify its shareholder base, expand access to investors across different markets, and
strengthen the capital structure required to support its program.
During the ceremony, Eve announced the approval of a $40 million financing package from Brazil’s National Bank
for Economic and Social Development (BNDES). The funds will support the integration phase and operation of
the electric motors for the company’s first certification aircraft, as well as preparations for the test campaign
required to obtain the type certificate from Brazil’s National Civil Aviation Agency (ANAC).
Structured under the BNDES Climate Fund (Green Industry modality) and the FINEM Innovation line (Incentivized
Line A), the new operation consists of two sub credits—~US$32 million from the Climate Fund and ~US$8 million
in BNDES resources raised in foreign currency—with a total term of up to 15 years.
The new credit line announced at B3, with participation from senior leadership from Eve, Embraer, and BNDES,
as well as customers and partners, reinforces the strong partnership between the organizations. Since 2022,
BNDES has provided more than $240 million in financing to Eve, consolidating the company’s financial foundation
to bring its eVTOL to certification and launch commercial operations.
9
Eve Air Mobility Selects BETA Technologies as Pusher Motor Supplier
On December 2, 2025, Eve announced it had selected BETA Technologies (“BETA”) (NYSE: BETA) to supply
electric pusher motors for its conforming prototypes and production aircraft.
With a current backlog of ~2,7k eVTOLs, Eve is strengthening its supply chain through this collaboration. The
agreement represents a potential 10-year opportunity for Beta of up to USD $1 billion and reinforces Eve’s
commitment to proven technologies and dedication to exceeding mission requirements.
The agreement follows an initial evaluation period in which Eve purchased, tested, and validated the performance
of BETA motors in its Engineering Prototype in anticipation of its first flight, which is expected to take place late
this year/early 2026.
BETA designs and manufactures its proprietary electric propulsion systems, offering power-to-weight ratios and
energy-conversion efficiencies. The simple designs feature segment redundancy and significantly fewer parts
than traditional aircraft engines, translating into high safety and low cost.
The selection of BETA Technologies underscores Eve’s commitment to partnering with leading aerospace
innovators as suppliers to power its conforming prototypes and production aircraft. BETA’s proven expertise in
electric propulsion systems and its commitment to robust, high-performance designs were key factors in this
strategic supplier addition.
Through this supplier agreement, BETA joins an elite group of legacy suppliers supporting Eve’s development,
including U.S.-based leaders such as BAE Systems for batteries, Garmin for avionics, Honeywell Aerospace for
external lighting, Intergalactic for thermal management, and Nidec Aerospace for lifter motors.
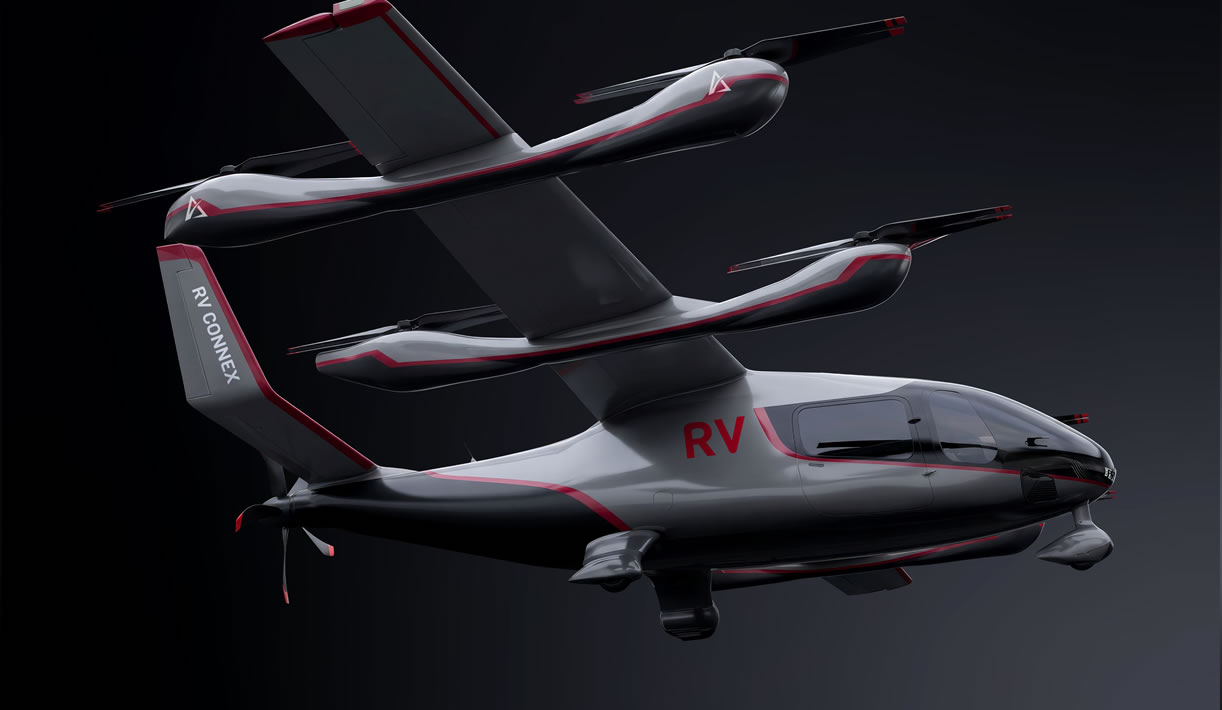
Eve Air Mobility and Revo Announce First Real-World Deployment of
Vector Software at 2025 São Paulo Grand Prix
On November 10, 2025, Eve announced the first real-world deployment of its urban air traffic management
software, Vector, in partnership with Revo, a Brazilian UAM company that operates helicopter flights via seat
reservations, during the 2025 São Paulo Grand Prix. The implementation represents a significant step in bringing
scalable, automated traffic management solutions to Advanced Air Mobility (AAM).
During the Grand Prix weekend, from November 7-9, the Vector Software was used by Revo’s team to manage
helicopter operations at the Interlagos racetrack. Designed with a modular and scalable architecture, the
software currently offers a Vertiport and Ground Operations Module, enabling operators to smoothly manage
high-volume vertiport and heliport activity. Fleet Operations Module, planned for launch in 2026, will support
the needs of helicopter and eVTOL operators as UAM networks expand.
Revo, an early adopter of the platform, has already collaborated with Eve through multiple training and
deployment sessions.
The São Paulo deployment followed training sessions between Eve’s TechCare and Vector Software teams, as
well as Revo’s operational staff, marking a critical step in Eve’s commercialization roadmap. While future Vector
Software operations are planned at additional sites, including residential and commercial hubs, the GP debut
demonstrated the software’s flexibility in managing complex, high-density operations.
The software’s value proposition lies in enabling safe, efficient, low-altitude traffic management through
automation and data-driven services. Early adoption accelerates its maturity, making Eve a stronger partner for
cities, operators, and regulators as they prepare for the next era of aviation.
10
In June 2025, Revo signed a framework
agreement with Eve, that includes the
purchase of up to 50 eVTOLs, and
aftermarket
services,
forming
the
foundation for a turn-key solution that
integrates and enables Revo’s future
operation. The integrated model also
enhances the end-passenger experience,
providing a safe and quiet journey while
delivering substantial time savings.
Through our partnership, Revo secures
access to Eve’s full suite of solutions,
strengthening its role as a pioneer in the
Brazilian UAM market and accelerating
progress toward sustainable, connected
urban flights.
Backlog, Order Pipeline
eVTOL Orders
Currently, Eve’s order pipeline totals approximately 2.7K units,
with a total non-binding backlog value of approximately $13.5
billion. This value is based on a list price methodology that is a
customary practice in the aviation industry and incorporates
internal and external factors to define a standard price. Eve will
not disclose specific deal prices and will use the list price as a
reference for future transaction values. Our initial order pipeline
is based on non-binding LOIs and is therefore subject to change,
consistent with customary aviation practices.
Eve’s current client base comprises 27 customers, with no client
representing more than 14% of the total order book, including
options. The order book is further diversified by the industries in
which these customers operate, with fixed-wing operators
representing 40%, helicopter operators 27%, lessors 17%, and
ride-sharing platforms 11%.
Total orders by region
as of March 05, 2025
South
America
18%
Asia
9%
Europe
7%
Oceania
6% Central America
2%
Undisclosed
2%
Middle East
North
America
55%
1%
Lastly, Eve has received LOIs from clients in 9 countries across
five continents. The Americas are home to close to two-thirds of
Eve’s backlog (North America is 47% and South America is
18%), while Europe represents 16% of the LOIs, and Asia 9%.
TechCare
Eve is replicating elements of Embraer’s proven business model, namely the design, manufacturing, and sale of
aircraft. In addition, Eve will provide Services & Support worldwide on an agnostic basis. With that, Eve is uniquely
positioned to serve its customers by leveraging Embraer’s global presence with local support and has secured
non-binding contracts for service solutions across the world with 14 customers. Combined, these customers have
placed Letters of Intent (LOI) for approximately 1.1k of our eVTOLs, or 41% of our order book.
These contracts include MRO, training, battery services, data integration, and spare parts solutions, as well as
component repair. These functions will be enhanced by a Memorandum of Understanding (MOU) signed with DHL
Supply Chain to optimize the supply chain to service centers. The MOU will also focus on batteries and the specific
requirements for transport, storage, and disposal.
These non-binding service contracts are expected to generate potential revenues of $1.6 billion during the first
few years of vehicle operation, and because of our agnostic approach to the maintenance business, Services &
Support revenues could precede the first delivery of our eVTOL. Lastly, in addition to eVTOL sales and Services
& Support solutions, Eve is also developing Vector and has signed LOIs from 21 customers globally.
11
Eve’s eVTOL concept and design
Rather than relying on traditional combustion engines, eVTOL aircraft are designed to use electric motors,
providing an alternative means of transportation in urban markets that does not produce carbon emissions. Eve’s
design uses a conventional fixed wing and empennage, rotors, and a pusher, giving it a practical and intuitive
lift-plus-cruise design, that favors safety, efficiency, reliability, and certifiability while being environmentally
friendly.
With an expected range of 60 miles (approximately 100 kilometers), Eve’s aircraft has the potential to not only
offer a sustainable and affordable commute but to also reduce sound levels compared to conventional helicopters.
Its human-centered design ensures the comfort of passengers, the pilot, and the community by minimizing
sound. The all-electric aircraft features dedicated rotors for vertical flight and a fixed wing for cruise, with no
components required to change position during flight. It will be piloted at launch but evolve towards uncrewed
operations in the future.
12
Financial Performance
Income Statement
(Unaudited, US dollars,’000s, except where noted)
2025
Operating expenses
Research and development expenses
Selling, general and administrative expenses
New warrants expenses
Total operating expenses
Operating loss
Gain/(loss) from derivative liabilities
Financial investment income
Related party loan interest income
Interest expense
Other gain/(loss), net
Loss before income taxes
Income tax expense
Net loss
$
$
Year Ended December 31,
2024
2023
194,695 $
30,692
225,387
(225,387)
(128)
16,399
(10,140)
(3,991)
(223,248)
1,007
(224,255) $
129,844 $
26,529
156,374
(156,374)
6,983
12,299
2,875
(3,661)
218
(137,661)
507
(138,168) $
105,581
23,104
1,863
130,549
(130,549)
(10,403)
11,672
4,385
(252)
(945)
(126,091)
1,568
(127,658)
Balance Sheet
(Unaudited, US dollars,’000s, except where noted)
December 31,
2025
2024
ASSETS
Current assets
Cash and cash equivalents
Restricted cash
Financial investments
Related party receivables
Related party loan receivable
Other current assets
Total current assets
Non-current assets
Related party receivables
Property, plant & equipment, net
Right-of-use assets, net
Deferred income taxes, net
Other non-current assets
Total non-current assets
Total assets
LIABILITIES AND EQUITY
Current liabilities
Accounts payable
Related party payables
Current portion of long-term debt
Derivative financial instruments
Other current payables
Total current liabilities
Non-current liabilities
Non-current related party payable
Long-term debt
Other non-current payables
Related party payables
Total non-current liabilities
Total liabilities
Commitments and contingencies (Note 18)
Equity
Common stock, $0.001 par value
Additional paid-in capital
Accumulated deficit
Total equity
Total liabilities and equity
$
$
$
$
103,233 $
8,380
280,845
54
18,362
410,874
56,366
247,012
472
8,957
312,807
19
15,322
310
3,916
4,434
24,002
434,875 $
611
1,096
2,637
1,091
5,436
318,242
3,828 $
70,265
3,374
4,588
42,713
124,769
1,136
35,802
6,983
15,422
59,343
176,412
1,890
8,046
186,348
311,117
132,011
2,966
134,977
194,320
348
830,500
(707,090)
123,758
434,875 $
298
606,460
(482,835)
123,922
318,242
13
Cash Flow Statement
(Unaudited, US dollars,’000s, except where noted)
2025
Cash flows from operating activities
Net loss
Adjustments to reconcile net loss to net cash used by operating activities
Depreciation, amortization, and loss on disposal
Non-cash lease expenses
Unrealized (gain)/loss on exchange rate changes
Share-based compensation
Warrant expenses
Change in fair value of derivative financial instruments
Deferred income taxes
Non-cash tax expense
Changes in operating assets and liabilities
Accrued interest on financial investments, net
Accrued interest on related party loan receivable, net
Other assets
Related party receivables
Accounts payable
Related party payables
Other payables
Net cash used by operating activities
Cash flows from investing activities
Redemptions of financial investments
Purchases of financial investments
Related party loan collected (disbursed)
Intangible assets, net
Expenditures for property, plant and equipment
Net cash (used) provided by investing activities
Cash flows from financing activities
Proceeds from issuance of common stock, net of fees to investors
Non-investor equity issuance costs
Proceeds from issuance of debt
Non-creditor debt issuance costs
Tax withholding on share-based compensation
Proceeds from exercised warrants
Net cash provided by financing activities
Effect of exchange rate changes on cash and cash equivalents
Increase (decrease) in cash, cash equivalents and restricted cash
Cash and cash equivalents at the beginning of the period
Cash and cash equivalents at the end of the period
Supplemental disclosure of cash information
Cash paid for
Interest
Income taxes
Supplemental disclosure of other non-cash investing and financing activities
Property, plant & equipment expenditures in accounts payable and other payables
Right-of-use assets obtained in exchange for operating lease liabilities
Issuance of common stock for vested restricted stock units
Reclassification of Public Warrants from liability to equity
$
Year Ended December 31,
2024
2023
(224,255) $
(138,168) $
(127,658)
930
504
1,893
4,317
128
(1,279)
252
520
(2,489)
3,699
(6,983)
(923)
184
84
(9)
3,292
2,343
10,403
(1,714)
436
(1,832)
(9,959)
399
(258)
42,624
26,355
(160,432)
(3,794)
2,042
(4,347)
(282)
(3,310)
15,705
2,111
(135,966)
564
(391)
623
(299)
2,460
7,510
7,664
(94,509)
297,000
(329,000)
(2,180)
(12,555)
(46,735)
137,000
(269,000)
81,000
(5,216)
(56,216)
219,500
(152,500)
(168)
66,832
$
226,336
(8,927)
46,334
(464)
(157)
263,121
(707)
55,247
56,366
111,613 $
94,288
(956)
110,762
(1,084)
9
203,019
(1,354)
9,484
46,882
56,366 $
25,453
(243)
(287)
3
24,926
487
(2,264)
49,146
46,882
$
$
9,013 $
1,265 $
2,839 $
3,569 $
77
1,762
$
$
$
$
2,981 $
24 $
941 $
2,527
137 $
1,108 $
878 $
106
376
1,366
Webcast Details
Management will discuss the results on a conference call on Tuesday, March 17, 2026, at 8:00 AM (Eastern
Time). The webcast will be publicly available in the Upcoming Events section of the company website:
www.eveairmobility.com
To listen by phone, please dial 1-844-676-6050 or 1-412-634-6902. A replay of the call will be available
until March 31, 2026, by dialing 1-844-512-2921 or 1-412-317-6671 and entering passcode 10206616.
Webcast access here
14
Upcoming Events
Eve senior management is scheduled to attend the following investor events:
Bradesco BBI 12th Brazil Investment Forum - São Paulo (April 7, 8)
Itaú BBA's 19th Annual LatAm CEO Conference – New York (May 12-14)
19th Annual Wolfe Research Global Transportation & Industrials Conference - New York (May 19-21)
Jefferies 4th Annual eVTOL / AAM Summit – Virtual (June 30)
Non-GAAP Financial Measures (Unaudited)
Management uses both generally accepted accounting principles (GAAP) and non-GAAP financial measures to
assess the financial condition of the Company. Management believes certain non-GAAP measures described below
provide investors with additional insight into the Company’s ongoing business performance and financial
condition. These non-GAAP measures should not be considered in isolation or as a substitute for the related GAAP
measures, and other companies may define such measures differently. Investors are encouraged to review the
Company's financial statements and publicly filed reports in their entirety and not to rely on any single financial
measure.
Free Cash Flow is a non-GAAP measure and is used to review and measure the Company's capital resources
against the substantial cash requirements for operations, which can be useful for an investor to assess the
Company's liquidity position or needs. Its most comparable GAAP measure is Net Cash used by operating
activities. Free Cash Flow is calculated as net cash used by operating activities reduced by expenditures for PP&E,
as provided in the “Key Financial Indicators” table on page 1.
Management also uses a non-GAAP measure called "total liquidity" to track the Company’s access to capital
resources. Total liquidity is defined and measured as the sum of cash and cash equivalents, financial investments,
related party loan receivable, and available debt. Cash equivalents include deposits in bank deposit certificates
issued by financial institutions in Brazil that are immediately available for redemption and fixed term deposits in
US Dollars with original maturities of 90 days or less. Financial investments include debt securities with maturities
greater than 90 days but less than 365 days. The remaining borrowing availability from the BNDES loans is fully
committed to the Company. The following table reconciles total liquidity used by management:
Total Liquidity
December 31, 2025
(Unaudited, US dollars, millions)
Cash and Cash Equivalents
Financial Investments
Available undrawn debt facilities and grant
Total Liquidity
$
Cash Flow
December 31, 2024
56.4
247.0
125.2
428.6
Twelve Months Ended
December 31, 2025
December 31, 2024
(Unaudited, US dollars, millions)
Net cash used by operating activities
Net cash provided (used) by investing activities
Net cash provided by fiancing activities
111.6
280.8
149.0
541.4 $
$
(160.4)
(46.7)
263.1 $
(136.0)
(56.2)
203.0
15
About Eve Holding, Inc.
Eve is dedicated to accelerating the Urban Air Mobility ecosystem. Benefitting from a start-up mindset, backed
by Embraer S.A.’s more than 50-year history of aerospace expertise, and with a singular focus, Eve is taking a
holistic approach to progressing the UAM ecosystem, with an advanced eVTOL project, comprehensive global
services and support network and a unique air traffic management solution. Since May 10, 2022, Eve has been
listed on the New York Stock Exchange, where its shares of common stock and public warrants trade under the
tickers “EVEX” and “EVEXW”. In December 2025, the Company was listed on the B3, Brazilian Stock Exchange,
under the ticker EVEB31. The information on, or accessible through, any website referenced herein is not
incorporated by reference into, and is not a part of, this release.
Forward Looking Statements
Certain statements contained in this release are forward-looking statements within the meaning of the Private Securities Litigation
Reform Act of 1995. These forward-looking statements may be identified by words such as “may,” “will,” “expect,” “intend,”
“anticipate,” “believe,” “estimate,” “plan,” “project,” “could,” “should,” “would,” “continue,” “seek,” “target,” “guidance,”
“outlook,” “if current trends continue,” “optimistic,” “forecast” and other similar words or expressions. All statements, other than
statements of historical facts, are forward-looking statements, including, but not limited to, statements about the company’s
plans, objectives, expectations, outlooks, projections, intentions, estimates, and other statements of future events or conditions,
including with respect to all companies or entities named within. These forward-looking statements are based on the company’s
current objectives, beliefs and expectations, and they are subject to significant risks and uncertainties that may cause actual
results and financial position and timing of certain events to differ materially from the information in the forward-looking
statements. These risks and uncertainties include, but are not limited to, those set forth herein as well as in Part I, Item 1A. Risk
Factors and Part II, Item 7. Management’s Discussion and Analysis of Financial Condition and Results of Operations of the
company’s most recent Annual Report on Form 10-K, Part I, Item 2. Management’s Discussion and Analysis of Financial Condition
and Results of Operations and Part II, Item 1A. Risk Factors of the company’s most recent Quarterly Report on Form 10-Q, and
other risks and uncertainties listed from time to time in the company’s other filings with the Securities and Exchange Commission.
Additionally, there may be other factors which the company is not currently aware of that may affect matters discussed in the
forward-looking statements and may also cause actual results to differ materially from those discussed. The company does not
assume any obligation to publicly update or supplement any forward-looking statement to reflect actual results, changes in
assumptions or changes in other factors affecting these forward-looking statements, other than as required by law. Any forwardlooking statements speak only as of the date hereof or as of the dates indicated in the statement.
Investor Relations
Lucio Aldworth
Caio Pinez
[email protected]
ir.eveairmobility.com
Media
[email protected]
www.eveairmobility.com
16





 View original content to download multimedia:

 View original content to download multimedia:

 View original content to download multimedia:

 View original content to download multimedia:

 View original content to download multimedia:

 View original content to download multimedia:


