Company narrows guidance range, affirms financial outlooks Posted:Nov 2, 2026 | Posted:Corporate Editorial Team | Category:News release | Tags:Corporate, Earnings, Investors NEW ORLEANS – Entergy Corporation (NYSE: ETR) reported third quarter 2026…
Company narrows guidance range, affirms financial outlooks
Posted:Nov 2, 2026 | Posted:Corporate Editorial Team | Category:News release | Tags:Corporate, Earnings, Investors
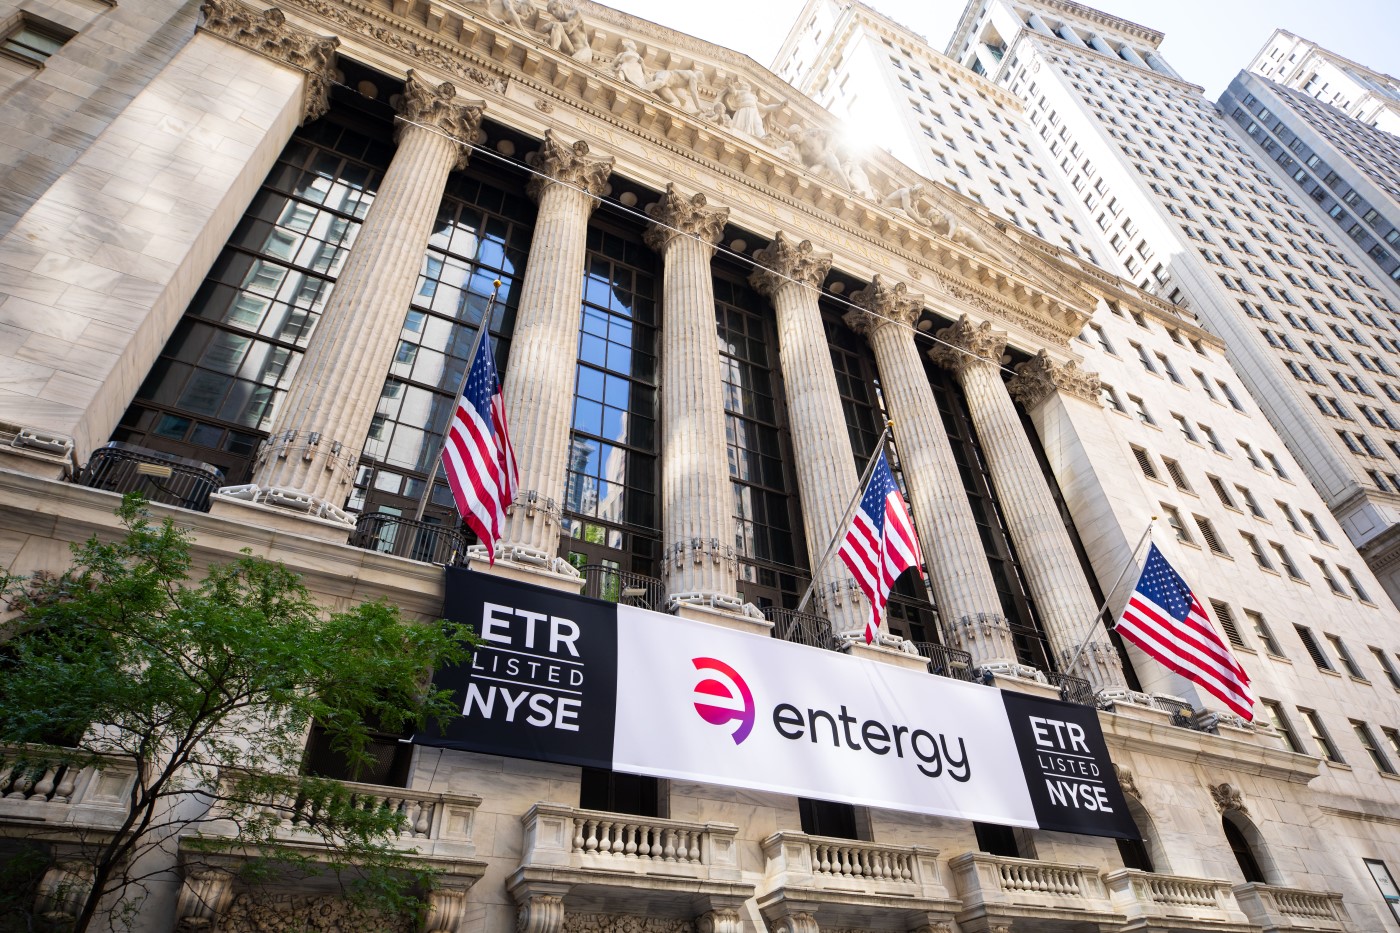
NEW ORLEANS – Entergy Corporation (NYSE: ETR) reported third quarter 2026 earnings per share of $1.98 on an as-reported and an adjusted (non-GAAP) basis.
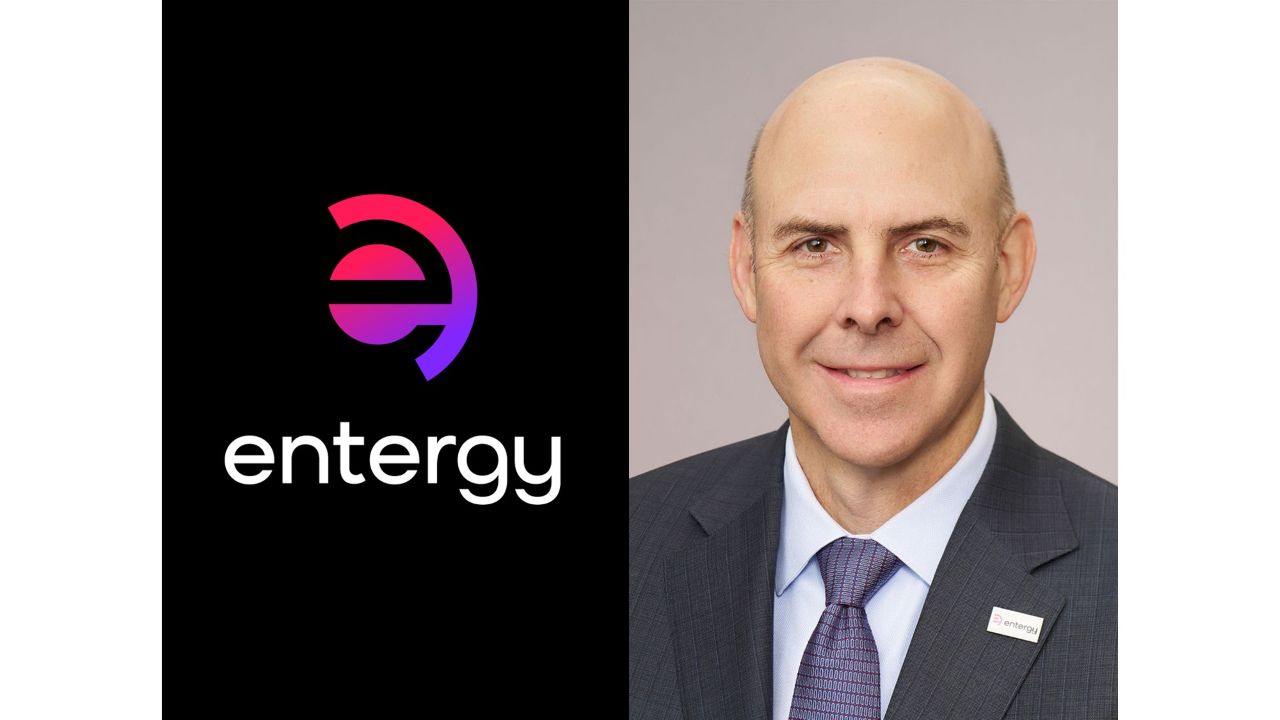
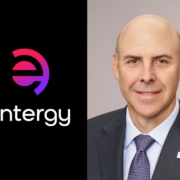
“We made very strong progress this quarter across customer, operational, regulatory, and financial aspects of our business,” said Drew Marsh, Entergy Chair and Chief Executive Officer. “We have clear line of sight to deliver on our near- and long-term objectives, and we are well positioned to execute on additional opportunities driven by customer needs.”
Business highlights included the following:
-
Entergy Arkansas announced an expansion of its service agreement with Google.
-
Orange County Advanced Power Station is operational and delivering power to Entergy Texas customers.
-
The LPSC approved Entergy Louisiana’s $1.2 billion Babel to Webre transmission project.
-
Entergy Louisiana reached a settlement with the LPSC Staff in its Evest filing.
-
Entergy Louisiana filed its application for additional Future Ready resilience plan investment.
-
The CCNO approved Entergy New Orleans’s four-year FRP extension.
-
Entergy Mississippi filed an application to securitize costs associated with Winter Storm Fern.
-
The U.S. Department of Energy awarded $14 million in grants to Entergy utility companies to strengthen grid reliability.
-
Entergy’s Board of Directors declared a quarterly dividend of 68 cents per share, a six percent increase.
-
Entergy received its 52nd EEI emergency response award for restoration efforts following Winter Storm Fern.
-
Site Selection magazine named Entergy a top utility in economic development for the 19th consecutive year.
| Consolidated earnings (GAAP and non-GAAP measures) Third quarter and year-to-date 2026 vs. 2025 (See Appendix A for reconciliation of GAAP to non-GAAP measures and details on adjustments) |
| |
| | Third quarter | Year-to-date |
| | 2026 | 2025 | Change | 2026 | 2025 | Change |
| (After-tax, $ in millions) | | | | | | |
| As-reported earnings | 940 | 694 | 247 | 1,808 | 1,522 | 285 |
| Less adjustments | – | – | – | (14) | – | (14) |
| Adjusted earnings (non-GAAP) | 940 | 694 | 247 | 1,821 | 1,522 | 299 |
| Estimated weather impact | 116 | 28 | 88 | 108 | 88 | 21 |
| | | | | | | |
| (After-tax, per share in $) | | | | | | |
| As-reported earnings | 1.98 | 1.53 | 0.45 | 3.86 | 3.40 | 0.46 |
| Less adjustments | – | – | – | (0.03) | – | (0.03) |
| Adjusted earnings (non-GAAP) | 1.98 | 1.53 | 0.45 | 3.89 | 3.40 | 0.49 |
| Estimated weather impact | 0.24 | 0.06 | 0.18 | 0.23 | 0.20 | 0.03 |
Calculations may differ due to rounding
Consolidated results
For third quarter 2026, the company reported earnings of $940 million, or $1.98 per share, on an as-reported and an adjusted basis. This compared to third quarter 2025 earnings of $694 million, or $1.53 per share, on an as-reported and an adjusted basis.
Summary discussions of results by business follow. Additional details, including information on operating cash flow by business, are provided in Appendix A. Appendix B provides a more detailed analysis of earnings per share variances by business.
Business results
Utility
For third quarter 2026, the Utility business reported earnings attributable to Entergy Corporation of $1,079 million, or $2.28 per share, on an as-reported and an adjusted basis. This compared to third quarter 2025 earnings of $810 million, or $1.79 per share, on an as-reported and an adjusted basis.
The primary drivers for the quarter’s earnings increase included:
-
higher retail sales volume, including the effects of weather;
-
the net effect of regulatory actions across several operating companies;
-
return on construction work in progress for certain utility plant investments; and
-
higher other income (deductions).
These drivers were partially offset by higher interest expense, other O&M, and depreciation and amortization.
On a per share basis, third quarter 2026 results reflected higher diluted average number of common shares outstanding primarily due to the settlement of equity forwards in 2025 and 2026.
Appendix C contains additional details on Utility operating and financial measures.
Parent & Other
For third quarter 2026, Parent & Other reported a loss attributable to Entergy Corporation of $(139 million), or (29) cents per share, on an as-reported and an adjusted basis. This compared to a third quarter 2025 loss of $(117 million), or (26) cents per share, on an as-reported and an adjusted basis.
The primary driver for the quarter-over-quarter change was higher interest expense.
On a per share basis, third quarter 2026 results reflected higher diluted average number of common shares outstanding (see details in Utility section).
Earnings per share guidance
Entergy narrowed its 2026 adjusted earnings per share guidance to a range of $4.35 to $4.45. See the earnings call presentation for additional details.
The company has provided 2026 earnings guidance with regard to the non-GAAP measure of adjusted earnings per share. This measure excludes from the corresponding GAAP financial measure the effect of adjustments as described in the “Non-GAAP financial measures” section. The company has not provided a reconciliation of such non-GAAP guidance to guidance presented on a GAAP basis because it cannot predict and quantify with a reasonable degree of confidence all of the adjustments that may occur during the period. Potential adjustments include, among other things, certain significant income tax items, certain items recorded as a result of regulatory settlements or decisions, and certain unusual costs or expenses.
Earnings teleconference
A teleconference will be held at 10:00 a.m. Central Time on Monday, Nov. 2, 2026, to discuss Entergy’s quarterly earnings announcement and the company’s financial performance. The teleconference may be accessed by visiting Entergy’s website at investors.entergy.com/investors/events-and-presentations or by dialing 888-440-4149, conference ID 9024832, no more than 15 minutes prior to the start of the call. The earnings call presentation is also being posted to Entergy’s website concurrent with this news release. A replay of the teleconference will be available on Entergy’s website at investors.entergy.com/investors/events-and-presentations and by telephone. The telephone replay will be available through Nov. 9, 2026, by dialing 800-770-2030, conference ID 9024832.
Entergy (NYSE: ETR) generates, transmits and distributes electricity to power life for more than 3 million customers through our operating companies in Arkansas, Louisiana, Mississippi and Texas. We’re focused on keeping costs for our customers as low as possible while providing reliable energy that our communities count on. We’re also investing in growth for the future with a more resilient, cleaner energy system that includes modern natural gas, nuclear and renewable energy generation. As a nationally recognized leader in sustainability and corporate citizenship, we deliver more than $100 million in economic benefits each year to the communities we serve through philanthropy, volunteerism and advocacy. Entergy is a Fortune 500 company headquartered in New Orleans, Louisiana, and has approximately 12,000 employees. Learn more at Entergy.com and connect with @Entergy on social media.
Entergy Corporation’s common stock is listed on the New York Stock Exchange and NYSE Texas under the symbol “ETR”.
Details regarding Entergy’s results of operations, regulatory proceedings, and other matters are available in this earnings release, a copy of which will be filed with the SEC, and the earnings call presentation. Both documents are available on Entergy’s Investor Relations website at investors.entergy.com/investors/events-and-presentations.
Entergy maintains a web page as part of its Investor Relations website entitled Regulatory and other information, which provides investors with key updates on certain regulatory proceedings and important milestones on the execution of its strategy. While some of this information may be considered material information, investors should not rely exclusively on this page for all relevant company information.
For definitions of certain operating measures, as well as GAAP and non-GAAP financial measures and abbreviations and acronyms used in the earnings release materials, see Appendix E.
Non-GAAP financial measures
This news release contains non-GAAP financial measures, which are generally numerical measures of a company’s performance, financial position, or cash flows that either exclude or include amounts that are not normally excluded or included in the most directly comparable measure calculated and presented in accordance with GAAP. Entergy has provided quantitative reconciliations within this news release of the non-GAAP financial measures to the most directly comparable GAAP financial measures.
Entergy reports earnings using the non-GAAP measure of adjusted earnings, which excludes the effect of certain “adjustments”. Adjustments are unusual or non-recurring items or events or other items or events that management believes do not reflect the ongoing business of Entergy, such as significant income tax items, certain items recorded as a result of regulatory settlements or decisions, and certain unusual costs or expenses. In addition to reporting GAAP earnings on a per share basis, Entergy reports its adjusted earnings on a per share basis. These per share measures represent the applicable earnings amount divided by the diluted average number of common shares outstanding for the period.
Management uses the non-GAAP financial measures of adjusted earnings and adjusted earnings per share for, among other things, financial planning and analysis; reporting financial results to the board of directors, employees, owners, and analysts; and internal evaluation of financial performance. Entergy believes that these non-GAAP financial measures provide useful information to investors in evaluating the ongoing results of Entergy’s business, comparing period to period results, and comparing Entergy’s financial performance to the financial performance of other companies in the utility sector.
Other non-GAAP measures, including adjusted ROE, adjusted ROE excluding affiliate preferred, FFO to adjusted debt, gross liquidity, net liquidity, adjusted Parent debt to total adjusted debt, adjusted debt to adjusted capitalization, and adjusted net debt to adjusted net capitalization are measures Entergy uses internally for management and board of directors discussions and to gauge the overall strength of its business. Entergy believes the above data provides useful information to investors in evaluating Entergy’s ongoing financial results and flexibility and assists investors in comparing Entergy’s credit and liquidity to the credit and liquidity of others in the utility sector. These metrics are defined in Appendix E.
These non-GAAP financial measures reflect an additional way of viewing aspects of Entergy’s operations that, when viewed with Entergy’s GAAP results and the accompanying reconciliations to corresponding GAAP financial measures, provide a more complete understanding of factors and trends affecting Entergy’s business. These non-GAAP financial measures should not be used to the exclusion of GAAP financial measures. Investors are strongly encouraged to review Entergy’s consolidated financial statements and publicly-filed reports in their entirety and not to rely on any single financial measure. Although certain of these measures are intended to assist investors in comparing Entergy’s performance to other companies in the utility sector, non-GAAP financial measures are not standardized; therefore, it might not be possible to compare these financial measures with other companies’ non-GAAP financial measures having the same or similar names.
Cautionary note regarding forward-looking statements
This news release contains certain “forward-looking statements” within the meaning of federal securities laws that are subject to risks and uncertainties. Such statements include, among other things, statements regarding Entergy’s adjusted earnings per share guidance and outlooks; the company’s capital plan; retail and industrial sales growth outlooks; other financial and operational outlooks; and other statements of Entergy’s plans, beliefs, or expectations within this news release. Readers are cautioned not to place undue reliance on these forward-looking statements, which apply only as of the date of this news release. Entergy undertakes no obligation to publicly update or revise any forward-looking statements, whether as a result of new information, future events, or otherwise.
Forward-looking statements are subject to a number of risks, uncertainties, and other factors that could cause actual results to differ materially from those expressed or implied in such forward-looking statements, including (a) those factors discussed elsewhere in this news release and in Entergy’s most recent Annual Report on Form 10-K and any subsequent public filings with the Securities and Exchange Commission; (b) uncertainties associated with (1) rate proceedings, formula rate plans, and other cost recovery mechanisms, including the risk that costs may not be recoverable to the extent or on the timeline anticipated and (2) implementation of the ratemaking effects of changes in law; (c) uncertainties associated with (1) realizing the benefits of its resilience plan, including impacts of the frequency and intensity of future storms and storm paths, as well as the pace of project completion and (2) efforts to remediate the effects of major storms and recover related restoration costs; (d) risks associated with operating nuclear facilities, including plant relicensing, operating, and regulatory costs and risks; (e) changes in decommissioning trust values or earnings or in the timing or cost of decommissioning Entergy’s nuclear plant sites; (f) legislative and regulatory actions and risks and uncertainties associated with claims or litigation by or against Entergy and its subsidiaries; (g) risks and uncertainties associated with executing on business strategies, including (1) strategic transactions that Entergy or its subsidiaries may undertake and the risks that any such transaction may not be completed as and when expected or the anticipated benefits may not be realized, and (2) Entergy’s ability to meet the rapidly growing demand for electricity, including from large-scale data centers and other large customers, and to manage the impacts of such growth on customers and its business, or the risk that contracted or expected load growth does not materialize or is not sustained; (h) risks and uncertainties associated with the resolution of pending or future applications, regulatory proceedings, litigation or governmental official actions relating to generation, transmission, or other facilities and the effect of related public and political opposition, including, in each case, those relating to any facilities designed to serve large-scale data centers; (i) direct and indirect impacts to Entergy or its customers from pandemics, terrorist attacks, geopolitical conflicts, cybersecurity threats, data security breaches, or other attempts to disrupt Entergy’s business or operations, and/or other catastrophic events; and (j) effects on Entergy or its customers of (1) changes in federal, state, or local laws and regulations and other governmental actions or policies, such as changes in monetary, fiscal, trade, tax, environmental, or energy (including, among other things, data center energy use, efficiency standards, and sources of power) policies, as well as changes in utility regulations, including those relating to new projects designed to serve the increased load growth of large-scale data centers and other large customers; (2) changes in commodity markets, capital markets, or economic conditions; and (3) technological change, including the costs, pace of development, and commercialization of new and emerging technologies.
View complete earnings release (PDF)
Investor inquiries:
Liz Hunter
504-576-3294
[email protected]
Media inquiries:
Neal Kirby
504-576-4238
[email protected]
Entergy increases quarterly dividend payment to shareholders
 Thank you, New Orleans
Scroll to top

 Talking turkey: Nine simple energy-saving tips for Thanksgiving


 Five tips for buying a portable space heater

 Smart plugs: Advanced features to look for

 Cooking up energy savings this holiday season










 Entergy increases quarterly dividend payment to shareholders