Nov 02, 2026
– Net Income Per Fully Diluted Share of $0.02 –
– Core FFO Per Fully Diluted Share of $0.20 –
– Leased Over 189,000 Square Feet –
– Completed Disposition of 1359 Broadway for $217.5M –
– Repurchased $85.8 million of Common Stock –
– Increases 2026 Core FFO Range –
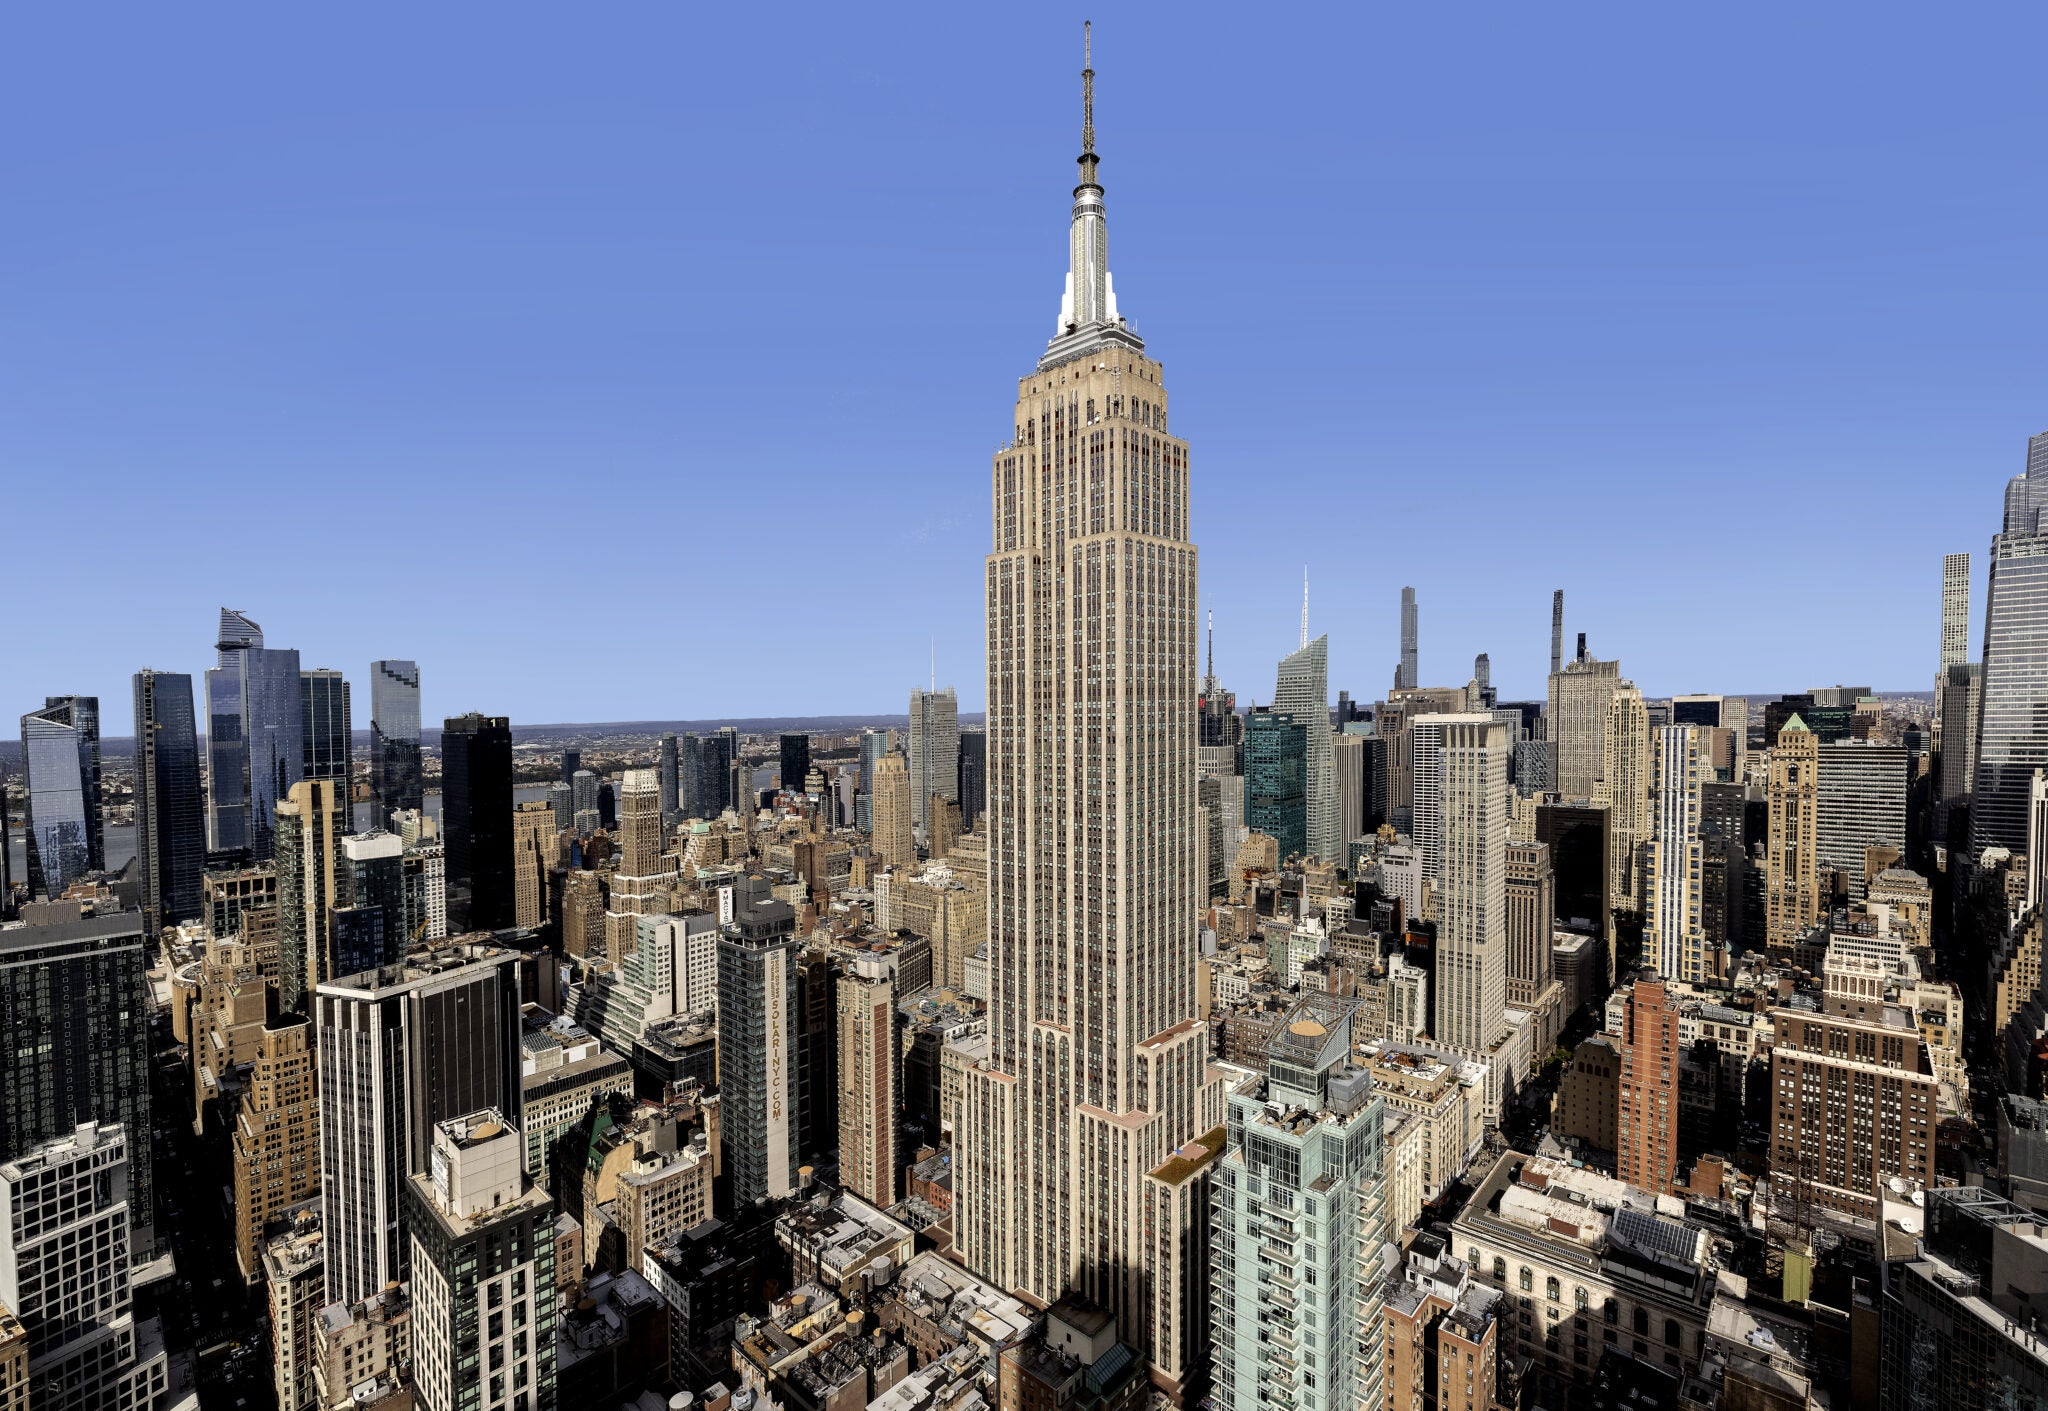
NEW YORK--(BUSINESS WIRE)-- Empire State Realty Trust, Inc. (NYSE: ESRT) owns and operates a New York City portfolio of well-leased, top of tier, office, retail, and multifamily assets. ESRT’s Empire State Building features an Observation Deck. The Company is a recognized leader in sustainability. Today the Company reported its operational and financial results for the third quarter of 2026. All per share amounts are on a fully diluted basis, where applicable.
Third Quarter and Recent Highlights
- Net Income of $0.02 per share.
- Core Funds From Operations (“Core FFO”) of $0.20 per share.
- Same-Store Property Cash Net Operating Income (“NOI”), excluding lease termination fees, increased 0.5% year-over-year. The increase was primarily attributed to increases in tenant reimbursement income and insurance recoveries. This was partially offset by operating expense growth and the approximate $2 million year-over-year revenue decline from the previously disclosed FDIC expiration, which was pre-leased. Adjusted for FDIC and $1.2 million of third quarter 2026 non-recurring items, year-over-year Same-Store Property Cash NOI increased by 1.9%.
- The total commercial portfolio 1,2 was 95.6% leased and 92.3% occupied as of September 30, 2026.
- Signed 189,477 rentable square feet of commercial leases, inclusive of 170,608 rentable square feet of office leases.
- In the office portfolio, blended leasing spreads were +9.9%, the 21 st consecutive quarter of positive leasing spreads.
- Empire State Building Observation Deck generated NOI of $15.6 million. There is no change to the framework introduced in the second quarter of $55 million of NOI for 2026. Visitation continued to be weak.
- Subsequent to quarter-end, completed the disposition of 1359 Broadway for $217.5 million. Starting in late July, the Company began to redeploy the proceeds towards share repurchases and will also use proceeds to paydown debt. Further, the previously executed acquisition of the land underlying 111 West 33 rd Street and 1400 Broadway in the second quarter was used as a partial 1031 replacement asset for the disposition of 1359 Broadway.
- Since its second quarter earnings call through November 2, 2026, the Company acquired $85.8 million of its shares.
- Achieved the highest GRESB Management Score for All Companies in the Americas for the second consecutive year.
Property Operations
As of September 30, 2026, the Company’s commercial portfolio was occupied and leased as shown below1.
| September 30, 20262,3,4 | June 30, 20263,4 | September 30, 20253 | ||
| Percent occupied: | ||||
| Total commercial portfolio | 92.3% | 89.4% | 90.0% | |
| Office | 91.9% | 89.1% | 89.7% | |
| Retail | 96.6% | 92.8% | 92.8% | |
| Percent leased (includes signed leases not commenced): | ||||
| Total commercial portfolio | 95.6% | 94.9% | 92.6% | |
| Office | 95.5% | 94.8% | 92.4% | |
| Retail | 96.8% | 95.9% | 94.7% | |
| Total multifamily portfolio | 97.1% | 97.7% | 98.6% | |
| 1 Excludes approximately 15,000 square feet of retail space under redevelopment related to the June 2025 acquisition of 86-90 North 6th Street, approximately 396,000 square feet of space, comprised of 368,000 square feet of office space and 28,000 square feet of retail space, related to the December 2025 acquisition of 130 Mercer Street, that was not yet stabilized at the end of the quarter, and approximately 22,000 square feet of retail space related to the March 2026 acquisition of 41-55 North 6th Street, which is newly constructed and currently vacant.2 Excludes 457,000 square feet of office space and 29,000 square feet of retail space related to 1359 Broadway, which was sold subsequent to quarter-end.3 All occupancy and leased percentages exclude broadcasting and storage space.4 Occupancy and leased percentages for September 30, 2026 exclude Metro Center, which was sold during the fourth quarter 2025, 250 West 57th Street, which was sold during the second quarter 2026, and 1359 Broadway, which was sold subsequent to quarter-end. Occupancy and leased percentages for June 30, 2026 exclude Metro Center and 250 West 57th Street. |
Leasing
The tables that follow summarize leasing activity for the third quarter of 2026. The Company signed 27 leases which totaled 189,477 square feet with an average lease duration of 8.1 years. Average lease duration was 9.5 years for new leases executed in the third quarter.
Total Portfolio
| Total Portfolio | Leases executed | Squarefootage executed | Average cash rent psf – leases executed | % of new cash rent over / under previously escalated rents | ||
| Office | 21 | 170,608 | $ | 73.12 | 9.9 | % |
| Retail | 6 | 18,869 | $ | 221.79 | (13.9 | )% |
| Total Overall | 27 | 189,477 | $ | 87.93 | 2.8 | % |
Office Portfolio
| Office Portfolio | Leases executed | Squarefootage executed | Average cash rent psf – leases executed | % of new cash rent over / under previously escalated rents | ||
| New Office | 15 | 125,239 | $ | 73.37 | 16.2 | % |
| Renewal Office | 6 | 45,369 | $ | 72.43 | (4.5 | )% |
| Total Office | 21 | 170,608 | $ | 73.12 | 9.9 | % |
Leasing Activity Highlights
- 10.8-year 28,914 square foot new office lease with Octaura Holdings at 111 West 33 rd Street.
- 12.4-year 15,157 square foot expansion office lease with Corgan Associates at The Empire State Building.
- 11.0-year 13,459 square foot new office lease with Zenyth Advisors at The Empire State Building.
Capital Allocation
Subsequent to quarter-end, completed the disposition of 1359 Broadway for $217.5 million. Starting in late July, the Company began to redeploy the proceeds towards share repurchases and will also use proceeds to paydown debt. Further, the previously executed acquisition of the land underlying 111 West 33rd Street and 1400 Broadway in the second quarter was used as a partial 1031 replacement asset for the disposition of 1359 Broadway.
Since its second quarter earnings call through November 2, 2026, the Company acquired $85.8 million of its shares at a weighted average price of $4.56 per share. This brings aggregate share repurchases to approximately $387.7 million since March 2020.
Balance Sheet
The Company had $0.6 billion of total liquidity as of September 30, 2026, which was comprised of $85 million of cash, plus $520 million available under its revolving credit facility. At September 30, 2026, the Company had total debt outstanding of approximately $2.2 billion at a weighted average interest rate of 4.78%. At September 30, 2026, the Company’s ratio of net debt to adjusted EBITDA was 6.7x.
As previously announced, in the third quarter, the Company closed on a $245 million unsecured delayed draw term loan that matures in 2032. Term loan proceeds are expected to be drawn in January 2027 and used to repay existing debt. The Company has no unaddressed debt maturity until March 2029.
Dividend
On September 30, 2026, the Company paid a quarterly dividend of $0.035 per share or unit, as applicable, for the third quarter of 2026 to holders of the Company’s Class A common stock (NYSE: ESRT) and Class B common stock and to holders of the Series ES, Series 250 and Series 60 partnership units (NYSE Arca: ESBA, FISK and OGCP, respectively) and Series PR partnership units of Empire State Realty OP, L.P., the Company’s operating partnership (the “Operating Partnership”).
On September 30, 2026, the Company paid a quarterly preferred dividend of $0.15 and $0.175 per unit for the third quarter of 2026 to holders of the Operating Partnership’s Series 2014 and 2019 private perpetual preferred units, respectively.
2026 Core FFO
The table below presents a range of potential Core FFO per share outcomes based on key building blocks for the property business and the Observation Deck. These outcomes exclude the impact of any significant future lease termination fee income or unannounced acquisition, disposition or other capital markets activity. There is no change to the framework introduced in the second quarter of $55 Million of NOI for the Empire State Building’s Observation Deck.
| Key Items | 2026 Core FFO | Comments | |
| Earnings | Nov. 2026 | July 2026 | |
| Core FFO Per Fully Diluted Share | $0.77 to $0.80 | $0.75 to $0.79 | • Includes capital markets transactions, inclusive of share repurchases to date and sale of 1359 Broadway |
| Property Guidance Assumptions | |||
| Commercial Occupancy at year-end | 90% to 92% | 90% to 92% | • Incorporates temporary downtime for pre-leased space |
| SS Property Cash NOI (excluding lease termination fees) | +1.75% to +2.25% | -1.5% to +2.0% | • Incorporates higher than expected year-to-date results, driven primarily by non-recurring items; Assumes a ~4.0% to 6.0% y/y increase in operating expenses and real estate taxes largely offset by tenant reimbursement income |
| Observation Deck | |||
| Observation Deck NOI Utilized | $55M | $55M | • No change to framework introduced in 2Q |
| Low | High | |
| Net Income (Loss) Attributable to Common Stockholders and the Operating Partnership | $0.30 | $0.33 |
| Add: | ||
| Real Estate Depreciation & Amortization | 0.70 | 0.70 |
| Less: | ||
| Private Perpetual Distributions | 0.02 | 0.02 |
| Gain on Disposal of Real Estate, net | 0.88 | 0.88 |
| FFO Attributable to Common Stockholders and the Operating Partnership | $0.10 | $0.13 |
| Add: | ||
| Severance Expense | 0.02 | 0.02 |
| Amortization of Below Market Ground Lease | 0.02 | 0.02 |
| Goodwill Impairment Charge | 0.63 | 0.63 |
| Core FFO Attributable to Common Stockholders and the Operating Partnership | $0.77 | $0.80 |
The estimates set forth above may be subject to fluctuations as a result of several factors, including continued impacts of changes in the use of office space and remote work on our business and our market, performance of the Observation Deck (including tourism levels, currency and geopolitical impacts, weather and competition), our ability to complete planned capital improvements in line with budget, costs of integration of completed acquisitions, costs associated with future acquisitions or other transactions, straight-line rent adjustments and the amortization of above and below-market leases. There can be no assurance that the Company’s actual results will not differ materially from the estimates set forth above.
Investor Presentation Update
The Company has posted on the “Investors” section of ESRT’s website the latest investor presentation, which contains additional information on its businesses, financial condition and results of operations.
Webcast and Conference Call Details
Empire State Realty Trust, Inc. will host a webcast and conference call, open to the general public, on Tuesday, November 3, 2026 at 12:00 pm Eastern time.
The webcast will be available in the “Investors” section of ESRT’s website . To listen to the live broadcast, go to the site at least five minutes prior to the scheduled start time in order to register, download and install any necessary audio software. The conference call can also be accessed by dialing 1-877-407-3982 for domestic callers or 1-201-493-6780 for international callers.
Starting shortly after the call until November 17, 2026, a replay of the webcast will be available on the Company’s website, and a dial-in replay will be available by dialing 1-844-512-2921 for domestic callers or 1-412-317-6671 for international callers. The passcode for this dial-in replay is 13762456.
The Supplemental Report and Investor Presentation are additional components of the quarterly earnings announcement and are now available on the “Investors” section of ESRT’s website .
The Company uses, and intends to continue to use, the “Investors” page of its website, which can be found at www.esrtreit.com , as a means to disclose material nonpublic information and to comply with its disclosure obligations under Regulation FD, including, without limitation, through the posting of investor presentations that may include material nonpublic information. Accordingly, investors should monitor the “Investors” page, in addition to following our press releases, SEC filings, public conference calls, presentations and webcasts. The information contained on, or that may be accessed through, our website is not incorporated by reference into, and is not a part of, this document.
About Empire State Realty Trust
Empire State Realty Trust, Inc. (NYSE: ESRT) owns and operates a New York City portfolio of well-leased, top of tier, office, retail, and multifamily assets. ESRT’s Empire State Building features an Observation Deck. The Company is a recognized leader in sustainability. As of November 2, 2026, ESRT’s portfolio is comprised of approximately 7.7 million rentable square feet of commercial space and three residential properties. More information about Empire State Realty Trust can be found at esrtreit.com and by following ESRT on Facebook , Instagram , TikTok , X , and LinkedIn .
Forward-Looking Statements
This press release includes forward-looking statements within the meaning of Section 27A of the Securities Act of 1933, as amended (the “Securities Act"), and Section 21E of the Securities Exchange Act of 1934, as amended (the “Exchange Act”). We intend these forward-looking statements to be covered by the safe harbor provisions of the Private Securities Litigation Reform Act of 1995. Forward-looking statements are not historical facts and can generally be identified by words such as “anticipate,” “believe,” “expect,” “intend,” “plan,” “project,” “estimate,” “may,” “will,” “should,” “would,” and similar expressions.
Forward-looking statements are based on our current expectations and assumptions and are subject to risks and uncertainties that could cause actual results to differ materially from those expressed or implied. These risks and uncertainties include, among others: economic and market conditions (including the impact of catastrophic events, pandemics, extreme weather, terrorism, armed hostilities, cybersecurity threats and other technology disruptions); increased costs due to tariffs or other economic factors; changes in the New York City office, retail, multifamily and tourism markets (including changes in the use of office space and remote work); leasing activity, tenant defaults, early terminations and renewals, occupancy levels and rental rates; performance of the Observatory (including tourism levels, currency and geopolitical impacts, weather and competition); interest rate volatility and capital markets conditions, including our ability to refinance, restructure or extend indebtedness; real estate valuation declines and potential impairment charges; our ability to execute capital projects and complete acquisitions on acceptable terms; risks relating to governmental regulation, environmental and climate-related requirements (including Local Law 97), and our ability to achieve sustainability goals and metrics; risks relating to our ground lease; our ability to maintain our qualification as a REIT; potential taxable gain arising from transactions structured to qualify under Section 1031; legal proceedings; and risks relating to our disclosure controls and internal control over financial reporting. For a discussion of these and other factors, see the section entitled “Risk Factors” of our annual report on Form 10-K for the year ended December 31, 2025 and any additional factors that may be contained in any filing we make with the U.S. Securities and Exchange Commission.
Any forward-looking statement speaks only as of the date of this press release. We undertake no obligation to update or revise any forward-looking statement to reflect subsequent events or circumstances, except as required by law.
| Empire State Realty Trust, Inc. | |||||||
| Consolidated Statements of Operations | |||||||
| (unaudited and amounts in thousands, except per share data) | |||||||
| Three Months Ended September 30, | |||||||
| 2026 | 2025 | ||||||
| Revenues | |||||||
| Rental revenue | $ | 161,966 | $ | 158,410 | |||
| Observatory revenue | 26,808 | 36,037 | |||||
| Lease termination fees | — | — | |||||
| Third-party management and other fees | 277 | 404 | |||||
| Other revenue and fees | 4,002 | 2,879 | |||||
| Total revenues | 193,053 | 197,730 | |||||
| Operating expenses | |||||||
| Property operating expenses | 46,497 | 46,957 | |||||
| Ground rent expenses | 447 | 2,331 | |||||
| General and administrative expenses | 17,174 | 18,743 | |||||
| Observatory expenses | 11,204 | 9,510 | |||||
| Real estate taxes | 35,259 | 33,241 | |||||
| Depreciation and amortization | 46,661 | 47,615 | |||||
| Total operating expenses | 157,242 | 158,397 | |||||
| Total operating income | 35,811 | 39,333 | |||||
| Other income (expense): | |||||||
| Interest income | 967 | 1,146 | |||||
| Interest expense | (27,883 | ) | (25,189 | ) | |||
| Loss on disposition of property | (1,125 | ) | — | ||||
| Income before income taxes | 7,770 | 15,290 | |||||
| Income tax expense | (1,875 | ) | (1,645 | ) | |||
| Net income | 5,895 | 13,645 | |||||
| Non-controlling interest in the Operating Partnership | (1,763 | ) | (4,610 | ) | |||
| Preferred unit distributions | (1,050 | ) | (1,050 | ) | |||
| Net income attributable to common stockholders | $ | 3,082 | $ | 7,985 | |||
| Total weighted average shares | |||||||
| Basic | 171,157 | 169,250 | |||||
| Diluted | 270,115 | 270,357 | |||||
| Earnings per share attributable to common stockholders | |||||||
| Basic | $ | 0.02 | $ | 0.05 | |||
| Diluted | $ | 0.02 | $ | 0.05 | |||
| Empire State Realty Trust, Inc. | |||||||
| Consolidated Statements of Operations | |||||||
| (unaudited and amounts in thousands, except per share data) | |||||||
| Nine Months Ended September 30, | |||||||
| 2026 | 2025 | ||||||
| Revenues | |||||||
| Rental revenue | $ | 493,237 | $ | 466,492 | |||
| Observatory revenue | 69,543 | 93,097 | |||||
| Lease termination fees | 1,356 | 464 | |||||
| Third-party management and other fees | 822 | 1,243 | |||||
| Other revenue and fees | 15,319 | 7,750 | |||||
| Total revenues | 580,277 | 569,046 | |||||
| Operating expenses | |||||||
| Property operating expenses | 142,015 | 136,897 | |||||
| Ground rent expenses | 4,284 | 6,994 | |||||
| General and administrative expenses | 60,390 | 54,368 | |||||
| Observatory expenses | 30,867 | 27,450 | |||||
| Real estate taxes | 102,784 | 98,898 | |||||
| Goodwill impairment charge | 166,113 | — | |||||
| Depreciation and amortization | 147,269 | 144,196 | |||||
| Total operating expenses | 653,722 | 468,803 | |||||
| Total operating income (loss) | (73,445 | ) | 100,243 | ||||
| Other income (expense): | |||||||
| Interest income | 3,155 | 6,799 | |||||
| Interest expense | (83,825 | ) | (77,253 | ) | |||
| Interest expense associated with property in receivership | — | (647 | ) | ||||
| Gain on disposition of property | 123,497 | 13,170 | |||||
| Income (Loss) before income taxes | (30,618 | ) | 42,312 | ||||
| Income tax expense | (46 | ) | (1,504 | ) | |||
| Net income (loss) | (30,664 | ) | 40,808 | ||||
| Non-controlling interest in the Operating Partnership | 12,309 | (13,933 | ) | ||||
| Preferred unit distributions | (3,151 | ) | (3,151 | ) | |||
| Net income (loss) attributable to common stockholders | $ | (21,506 | ) | $ | 23,724 | ||
| Total weighted average shares | |||||||
| Basic | 171,073 | 168,103 | |||||
| Diluted | 268,936 | 269,945 | |||||
| Earnings (Loss) per share attributable to common stockholders | |||||||
| Basic | $ | (0.13 | ) | $ | 0.14 | ||
| Diluted | $ | (0.13 | ) | $ | 0.14 | ||
| Empire State Realty Trust, Inc. | |||||||
| Reconciliation of Net Income to Funds From Operations (“FFO”), | |||||||
| Modified Funds From Operations (“Modified FFO”) and Core Funds From Operations (“Core FFO”) | |||||||
| (unaudited and amounts in thousands, except per share data) | |||||||
| Three Months Ended September 30, | |||||||
| 2026 | 2025 | ||||||
| Net income | $ | 5,895 | $ | 13,645 | |||
| Preferred unit distributions | (1,050 | ) | (1,050 | ) | |||
| Real estate depreciation and amortization | 45,700 | 46,741 | |||||
| Loss on disposition of property | 1,125 | — | |||||
| FFO attributable to common stockholders and Operating Partnership units | 51,670 | 59,336 | |||||
| Amortization of below-market ground leases | 426 | 1,957 | |||||
| Modified FFO attributable to common stockholders and Operating Partnership units | 52,096 | 61,293 | |||||
| Severance expenses5 | 637 | — | |||||
| Core FFO attributable to common stockholders and Operating Partnership units | $ | 52,733 | $ | 61,293 | |||
| Total weighted average shares and Operating Partnership units | |||||||
| Basic | 269,064 | 266,963 | |||||
| Diluted | 270,115 | 270,357 | |||||
| FFO per share | |||||||
| Basic | $ | 0.19 | $ | 0.22 | |||
| Diluted | $ | 0.19 | $ | 0.22 | |||
| Modified FFO per share | |||||||
| Basic | $ | 0.19 | $ | 0.23 | |||
| Diluted | $ | 0.19 | $ | 0.23 | |||
| Core FFO per share | |||||||
| Basic | $ | 0.20 | $ | 0.23 | |||
| Diluted | $ | 0.20 | $ | 0.23 | |||
| 5 Included as a component of general and administrative expenses in the accompanying consolidated statements of operations. | |||||||
| Empire State Realty Trust, Inc. | |||||||
| Reconciliation of Net Income (Loss) to Funds From Operations (“FFO”), | |||||||
| Modified Funds From Operations (“Modified FFO”) and Core Funds From Operations (“Core FFO”) | |||||||
| (unaudited and amounts in thousands, except per share data) | |||||||
| Nine Months Ended September 30, | |||||||
| 2026 | 2025 | ||||||
| Net income (loss) | $ | (30,664 | ) | $ | 40,808 | ||
| Preferred unit distributions | (3,151 | ) | (3,151 | ) | |||
| Real estate depreciation and amortization | 144,455 | 141,533 | |||||
| Gain on disposition of property | (123,497 | ) | (13,170 | ) | |||
| FFO attributable to common stockholders and Operating Partnership units | (12,857 | ) | 166,020 | ||||
| Amortization of below-market ground leases | 3,633 | 5,873 | |||||
| Modified FFO attributable to common stockholders and Operating Partnership units | (9,224 | ) | 171,893 | ||||
| Interest expense associated with property in receivership | — | 647 | |||||
| Severance expenses6 | 6,173 | — | |||||
| Goodwill impairment charge | 166,113 | — | |||||
| Core FFO attributable to common stockholders and Operating Partnership units | $ | 163,062 | $ | 172,540 | |||
| Total weighted average shares and Operating Partnership units | |||||||
| Basic | 268,936 | 266,978 | |||||
| Diluted | 268,936 | 269,945 | |||||
| FFO per share | |||||||
| Basic | $ | (0.05 | ) | $ | 0.62 | ||
| Diluted | $ | (0.05 | ) | $ | 0.62 | ||
| Modified FFO per share | |||||||
| Basic | $ | (0.03 | ) | $ | 0.64 | ||
| Diluted | $ | (0.03 | ) | $ | 0.64 | ||
| Core FFO per share | |||||||
| Basic | $ | 0.61 | $ | 0.65 | |||
| Diluted | $ | 0.61 | $ | 0.64 | |||
| 6 Included as a component of general and administrative expenses in the accompanying consolidated statements of operations. | |||||||
| Empire State Realty Trust, Inc. | |||||||
| Reconciliation of Net Income to Cash NOI and Same Store Cash NOI | |||||||
| (unaudited and amounts in thousands) | |||||||
| Three Months Ended September 30, | |||||||
| 2026 | 2025 | ||||||
| Net income | $ | 5,895 | $ | 13,645 | |||
| Add: | |||||||
| General and administrative expenses | 17,174 | 18,743 | |||||
| Depreciation and amortization | 46,661 | 47,615 | |||||
| Interest expense | 27,883 | 25,189 | |||||
| Income tax expense | 1,875 | 1,645 | |||||
| Loss on disposition of property | 1,125 | — | |||||
| Less: | |||||||
| Third-party management and other fees | (277 | ) | (404 | ) | |||
| Interest income | (967 | ) | (1,146 | ) | |||
| Net operating income | 99,369 | 105,287 | |||||
| Straight-line rent | (7,287 | ) | (4,688 | ) | |||
| Above/below-market rent revenue amortization | (394 | ) | (821 | ) | |||
| Amortization of below-market ground leases | 426 | 1,957 | |||||
| Total cash NOI - including Observatory and lease termination fees | 92,114 | 101,735 | |||||
| Less: Observatory NOI | (15,604 | ) | (26,527 | ) | |||
| Less: cash NOI from non-Same Store properties | (9,843 | ) | (8,882 | ) | |||
| Total Same Store property cash NOI - including lease termination fees | 66,667 | 66,326 | |||||
| Less: Lease termination fees | — | — | |||||
| Total Same Store property cash NOI - excluding Observatory and lease termination fees | $ | 66,667 | $ | 66,326 | |||
| Observatory NOI | |||||
| (unaudited and amounts in thousands) | |||||
| Three Months Ended September 30, | |||||
| 2026 | 2025 | ||||
| Observatory revenue | $ | 26,808 | $ | 36,037 | |
| Observatory expenses | 11,204 | 9,510 | |||
| Observatory NOI, excluding intercompany rent7 | $ | 15,604 | $ | 26,527 | |
| 7 The Observatory pays a market-based rent comprised of fixed and percentage rent to the Empire State Building. Intercompany rent is eliminated upon consolidation. For the three months ended September 30, 2026 and September 30, 2025, the intercompany rent expense was $12,458 and $20,185, respectively. | |||||
| Empire State Realty Trust, Inc. | |||||||
| Reconciliation of Net Income (Loss) to Cash NOI and Same Store Cash NOI | |||||||
| (unaudited and amounts in thousands) | |||||||
| Nine Months Ended September 30, | |||||||
| 2026 | 2025 | ||||||
| Net income (loss) | $ | (30,664 | ) | $ | 40,808 | ||
| Add: | |||||||
| General and administrative expenses | 60,390 | 54,368 | |||||
| Depreciation and amortization | 147,269 | 144,196 | |||||
| Interest expense | 83,825 | 77,253 | |||||
| Interest expense associated with property in receivership | — | 647 | |||||
| Goodwill impairment charge | 166,113 | — | |||||
| Income tax expense | 46 | 1,504 | |||||
| Less: | |||||||
| Gain on disposition of property | (123,497 | ) | (13,170 | ) | |||
| Third-party management and other fees | (822 | ) | (1,243 | ) | |||
| Interest income | (3,155 | ) | (6,799 | ) | |||
| Net operating income | 299,505 | 297,564 | |||||
| Straight-line rent | (26,836 | ) | (13,719 | ) | |||
| Above/below-market rent revenue amortization | (1,448 | ) | (2,459 | ) | |||
| Amortization of below-market ground leases | 3,633 | 5,873 | |||||
| Total cash NOI - including Observatory and lease termination fees | 274,854 | 287,259 | |||||
| Less: Observatory NOI | (38,676 | ) | (65,647 | ) | |||
| Less: cash NOI from non-Same Store properties | (37,082 | ) | (28,543 | ) | |||
| Total Same Store property cash NOI - including lease termination fees | 199,096 | 193,069 | |||||
| Less: Lease termination fees | (1,356 | ) | (464 | ) | |||
| Total Same Store property cash NOI - excluding Observatory and lease termination fees | $ | 197,740 | $ | 192,605 | |||
| Observatory NOI | |||||
| (unaudited and amounts in thousands) | |||||
| Nine Months Ended September 30, | |||||
| 2026 | 2025 | ||||
| Observatory revenue | $ | 69,543 | $ | 93,097 | |
| Observatory expenses | 30,867 | 27,450 | |||
| Observatory NOI, excluding intercompany rent8 | $ | 38,676 | $ | 65,647 | |
| 8 The Observatory pays a market-based rent comprised of fixed and percentage rent to the Empire State Building. Intercompany rent is eliminated upon consolidation. For the nine months ended September 30, 2026 and September 30, 2025, the intercompany rent expense was $40,050 and $56,011, respectively. | |||||
| Empire State Realty Trust, Inc. | |||||||
| Consolidated Balance Sheets | |||||||
| (unaudited and amounts in thousands) | |||||||
| September 30, 2026 | December 31, 2025 | ||||||
| Assets | |||||||
| Real estate properties, at cost | $ | 4,379,157 | $ | 4,205,907 | |||
| Less: accumulated depreciation | (1,317,560 | ) | (1,366,829 | ) | |||
| Real estate properties, net | 3,061,597 | 2,839,078 | |||||
| Assets held for sale 9 | 83,095 | — | |||||
| Cash and cash equivalents | 85,257 | 132,657 | |||||
| Restricted cash | 34,449 | 33,854 | |||||
| Tenant and other receivables | 25,685 | 22,063 | |||||
| Deferred rent receivables | 249,227 | 255,270 | |||||
| Prepaid expenses and other assets | 82,363 | 93,355 | |||||
| Deferred costs, net | 249,252 | 267,682 | |||||
| Right-of-use assets, including below-market ground leases, net | 41,647 | 333,523 | |||||
| Goodwill | 325,366 | 491,479 | |||||
| Total assets | $ | 4,237,938 | $ | 4,468,961 | |||
| Liabilities and equity | |||||||
| Mortgage notes payable, net | $ | 442,399 | $ | 619,269 | |||
| Senior unsecured notes, net | 1,345,391 | 1,270,668 | |||||
| Unsecured term loan facility, net | 337,307 | 336,794 | |||||
| Unsecured revolving credit facility | 100,000 | 145,000 | |||||
| Accounts payable and accrued expenses | 107,376 | 120,150 | |||||
| Acquired below market leases, net | 34,892 | 39,767 | |||||
| Ground lease liabilities | 1,052 | 27,944 | |||||
| Deferred revenue and other liabilities | 55,970 | 59,901 | |||||
| Tenants’ security deposits | 28,017 | 27,276 | |||||
| Liabilities related to assets held for sale9 | 5,633 | — | |||||
| Total liabilities | 2,458,037 | 2,646,769 | |||||
| Total equity | 1,779,901 | 1,822,192 | |||||
| Total liabilities and equity | $ | 4,237,938 | $ | 4,468,961 | |||
| 9 Assets held for sale consist of 1359 Broadway, which was sold subsequent to quarter-end. |
Investors and Media
Empire State Realty Trust Investor Relations
(212) 850-2678
[email protected]
Source: Empire State Realty Trust, Inc.
Corporate Governance Learn More
Corporate Sustainability Learn More
Investor Contact
111 West 33rd Street
New York, NY 10120
United States
Tel (212) 850-2700
Fax (212) 850-2751
Email Alerts
To opt-in for investor email alerts, please enter your email address in the field below and select at least one alert option. After submitting your request, you will receive an activation email to the requested email address. You must click the activation link in order to complete your subscription. You can sign up for additional alert options at any time.
At Empire State Realty Trust Inc., we promise to treat your data with respect and will not share your information with any third party. You can unsubscribe to any of the investor alerts you are subscribed to by visiting the ‘unsubscribe’ section below. If you experience any issues with this process, please contact us for further assistance.
By providing your email address below, you are providing consent to Empire State Realty Trust Inc. to send you the requested Investor Email Alert updates.
* Required
Enter Email * Mailing Lists *
| Press Releases |
| Events |
| Presentations |
| SEC Filings |
| End of Day Stock Quote |
Submit Sign Up
Email Alert Sign Up Confirmation
(opens in new window) (opens in new window) (opens in new window) (opens in new window) (opens in new window)
 World’s Most Famous Building


© 2026 Empire State Realty Trust - ESRT. All Rights Reserved.
©EMPIRE STATE BUILDING name and images.