28 October 2026 05:48 (UTC) Mongstad refinery near Bergen. Photo: Ole Jørgen Bratland Equinor delivered an adjusted operating income* of USD 12.35 billion in the third quarter of 2026. Equinor reported a net operating income of USD 11.95 billion…
28 October 2026 05:48 (UTC)

Mongstad refinery near Bergen. Photo: Ole Jørgen Bratland
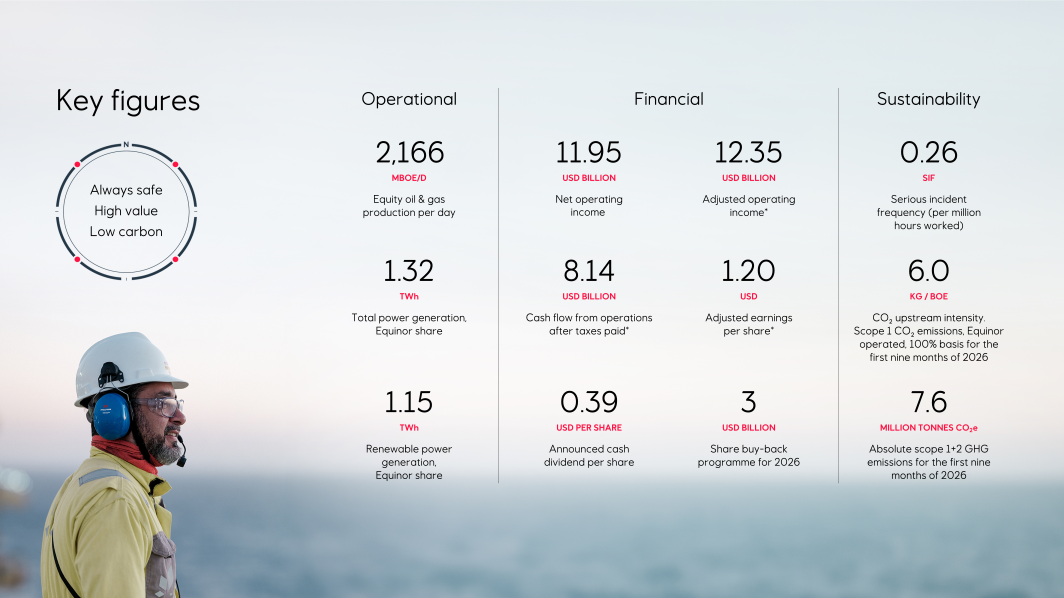
Equinor delivered an adjusted operating income* of USD 12.35 billion in the third quarter of 2026. Equinor reported a net operating income of USD 11.95 billion and a net income of USD 2.54 billion. Adjusted net income* was USD 2.86 billion, leading to adjusted earnings per share* of USD 1.20.
Delivering on the strategy
- Acquired gas-fired power plant in the US
- Progressing Bay du Nord with new partner in October
- Accessed attractive exploration acreage in Namibia, and established a strategic exploration collaboration on the NCS
Strong production, cash flow and financial results
- Production growth of 2%
- Increased 2026 production guiding to ~4%
- Strong Marketing, Midstream and Processing results with record contribution from the Mongstad refinery
- Cash flow from operations after taxes paid* of USD 8.1 billion
Capital distribution
- Third quarter cash dividend of USD 0.39 per share
- Fourth tranche of the share buy-back of up to USD 1,125 million
- Share buy-back of up to USD 3 billion for 2026
Anders Opedal, President and CEO of Equinor ASA:

Anders Opedal, president and CEO.
Photo: Ole Jørgen Bratland
“High production in the third quarter enabled us to capture additional value from higher prices. Based on safe and efficient operations we are increasing our 2026 guiding for oil and gas production growth from 3 to around 4 per cent.”
“In a period of continued geopolitical tension, we remain committed to safe and reliable operations, supplying the products our customers need. At the Mongstad refinery, our operational performance was strong and we achieved record results.”
“We continue to deliver on our strategy by creating new opportunities for long-term value. In the quarter, we have accessed new exploration acreage and acquired a stake in a gas-fired power plant in the US. We have also progressed the Bay du Nord project in Canada with a new partner.”
Delivering more energy
Equinor delivered high production in the third quarter with a total equity production of 2,166 mboe per day. This is a 2% increase compared to the same quarter last year.
Production on the NCS remained high, and was stable compared to the third quarter in 2025. New fields, such as Halten East and Verdande, and contribution from new wells offset natural decline and unplanned losses from Johan Castberg and Troll.
Production increased by 21% for the international oil and gas reporting segment compared to the same quarter last year. Main drivers were the addition of production from Adura in the UK and Bacalhau in Brazil, as well as lower turnaround activity. This was partially offset by portfolio divestments and natural decline.
The US production was lower than in the same quarter last year. Onshore production remained high, while planned downtime and natural decline offshore impacted overall production levels.
The renewable power generation increased by 26% due to contributions from Dogger Bank and a new onshore asset in Brazil. The total power generation was 1.32 TWh. Lower gas-to-power generation from Triton resulted in a decrease in total power generation in the third quarter.
Growing cash flow with strong financial results
Equinor delivered an adjusted operating income* of USD 12.35 billion and adjusted net income* was USD 2.86 billion in the third quarter. The results are primarily impacted by higher liquid prices and European gas prices. In addition, international liftings were lower than the company’s share of production, resulting in lower sales volumes.
The reported net operating income of USD 11.95 billion is up from USD 5.27 billion in the same quarter last year. The results were supported by higher commodity prices and strong refining margins.
Equinor realised a European gas price of USD 20.0 per mmbtu and a liquids price of USD 92.3 per bbl in the third quarter.
The Marketing, Midstream and Processing results were strong, primarily driven by high refining margins and strong refining performance, as well as LNG trading.
Adjusted operating and administrative expenses* remained broadly stable compared to the same quarter last year. Higher transportation costs and other variable costs were offset by a lower impact of changes in decommissioning estimates for a US offshore asset.
Elevated commodity prices and high production generated cash flows provided by operating activities, before taxes paid and working capital items, of USD 14.68 billion.
In the quarter, Equinor paid the two first NCS tax instalments for 2026 totalling USD 6.2 billion.
Cash flow from operations after taxes paid* ended at USD 8.14 billion.
Organic capital expenditure* was USD 3.28 billion and total capital expenditures were USD 3.82 billion.
The net debt to capital employed adjusted ratio* was 3.8% at the end of the third quarter, compared to 10.4% last quarter.
Executing on strategy
On the NCS, Equinor, Aker BP and Vår Energi established a new strategic exploration partnership to unlock greater value through closer collaboration. In the quarter, Equinor also signed energy supply agreements with companies in Poland, the Netherlands and Germany.
Equinor acquired bp’s interest in Bay du Nord in Canada in the quarter. In October, the company sold a 30% interest to Shell. The project maturation continues towards an investment decision.
Equinor entered Namibia through an exploration licence interest and was involved in new discoveries in Angola.
To further build its integrated power business, Equinor acquired an interest in the gas-fired power plant Lackawanna in the US.
Equinor had exploration activity on 13 wells in the quarter. Six wells were completed of which three were commercial. In addition a commercial discovery was confirmed from one of the wells completed in the second quarter.
Capital distribution
The board of directors has decided a cash dividend of USD 0.39 per share for the third quarter of 2026. This is in line with the communication on 4 February 2026, when results for the fourth quarter of 2025 were announced.
At the Capital Markets Day on 16 June this year, Equinor announced an intention to increase the share buy-back programme for 2026 by USD 1.5 billion. This brings the total expected programme for 2026 to up to USD 3 billion. The board has decided to initiate a fourth and final tranche of the share buy-back programme for 2026 of up to USD 1,125 million. The tranche will commence on 29 October 2026 and end no later than 1 February 2027.
The third tranche of the share buy-back programme for 2026 was completed on 22 October with a total value of USD 1,125 million.
All share buy-back amounts include shares to be redeemed by the Norwegian State.
*For items marked with an asterisk throughout this report, see Use and reconciliation of non-GAAP financial measures in the Supplementary disclosures.
Further information from:
Investor relations
Bård Glad Pedersen, Senior vice president Investor relations, +47 918 01 791 (mobile)
Press
Sissel Rinde, Vice president Media relations, +47 412 60 584 (mobile)
Downloads and webcast
Latest news
Explore
Investors
Careers
Sustainability
About us
Contact us
Connect
Facebook
Instagram
LinkedIn
Youtube
Site
Privacy policy
Cookie policy
Accessibility statement
Terms and conditions
Site info
Copyright 2026 Equinor ASA
Equinor third quarter 2026 results - Equinor


