EPAM Systems is a global provider of digital engineering, cloud, and artificial intelligence-enabled transformation services. The company offers integrated strategy, experience, and technology consulting alongside software development and product engineering. Its service lines include engineering, cloud technology, data analytics, customer experience, marketing, and cybersecurity. EPAM serves clients across five main industry verticals, including financial services, life sciences, and healthcare, as well as emerging sectors. The firm operates through proprietary platforms such as EPAM AI/RUN and DIALX Lab, and utilizes its agency brand Empathy Lab for marketing solutions. EPAM Continuum provides integrated strategy and consulting services. The company serves global enterprises and start-ups. EPAM was founded in 1993 and has expanded its capabilities through strategic acquisitions, including Fathom Technologies and NEORIS.

Summarised from the company's own disclosures, fiscal year ended Feb 2026

Industry Information Technology Services Homepage epam.com
Sector Technology IR page investors.epam.com/overview/default.aspx
Tags
software engineering, cloud computing, artificial intelligence, cybersecurity, customer experience design, data analytics, digital transformation, business consulting, marketing technology, financial services, life sciences, healthcare, EPAM AI/RUN, DIALX Lab, Empathy Lab, EPAM Continuum, Fathom Technologies, NEORIS, AI.Run Transform, Agentic QA, DIAL 3.0, EliteA
Press page epam.com/about/investors/news

Metrics

Valuation  
Market cap $ 8.41B
Market cap (USD) $ 8.41B
P/E 20.69
PEG —
P/BV 2.34
P/S 1.49
P/OCF 15.78
P/FCF 17.88
Dividend yield —
Turnover / mcap —
Returns  
ROE 10.3%
ROI 10.2%
ROIC 10.5%
Profit margin 6.9%
Growth  
Revenue growing Yes
Profits growing No
Revenue up 3y No
Revenue up 5y No
Earnings growth 3y (net profit CAGR) -3.4%
Quality  
Profitable Yes
Margin expanding No
Buying back stock Yes
Diluting (TTM) No
Debt/Equity 0.70%
Podcast bulls (TTM) Sign up
Podcast bears (TTM) Sign up
Podcast sentiment (TTM) Sign up
Podcast sentiment % (TTM) Sign up
News sentiment (TTM) 39
Quality score 0%
Insiders  
Buys, 1w Sign up
Buys, 1m Sign up
Buys, 1y Sign up
Sells, 1w Sign up
Sells, 1m Sign up
Sells, 1y Sign up

Sign up to see this company's insider trades

Figure FY 2025 FY 2024 FY 2023 FY 2022 FY 2021 FY 2020 FY 2019 FY 2018 FY 2017 FY 2016 FY 2015 FY 2014 FY 2013 FY 2012 FY 2011
Revenue 5.457B 4.728B 4.691B 4.825B 3.758B 2.659B 2.294B 1.843B 1.45B 1.16B 914.128M 730.027M 555.117M 433.799M 334.528M
Net profit 377.678M 454.533M 417.083M 419.416M 481.652M 327.16M 261.057M 240.256M 72.76M 99.266M 84.456M 69.641M 61.994M 54.484M 44.353M
Free cash flow 612.691M 527.022M 534.219M 382.475M 460.826M 475.614M 188.145M 254.644M 165.558M 135.5M 63.121M 92.958M 44.865M 35.123M 38.972M

Figure FY 2025 FY 2024 FY 2023 FY 2022 FY 2021 FY 2020 FY 2019 FY 2018 FY 2017 FY 2016 FY 2015 FY 2014 FY 2013 FY 2012 FY 2011
Share price 204.88 233.82 297.34 327.74 668.45 358.35 212.16 116.01 107.43 64.31 78.62 47.75 34.94 19.18 —
Price performance 12m -0.12 -0.21 -0.09 -0.51 0.87 0.69 0.83 0.08 0.67 -0.18 0.65 0.37 0.82 — —

Filed figures

Figure Dec 2016 Dec 2017 Dec 2018 Dec 2019 Dec 2020 Dec 2021 Dec 2022 Dec 2023 Dec 2024 Dec 2025
Balance sheet detail
Trade receivables (USD) 200M 266M 298M — — — — — — —
↳ YoY growth +14.5% +32.8% +12.1%
↳ 5y CAGR +27.4% +27.5% +25.5%
Borrowings, current (USD) — — — — 0.00 16M 2.86M — — —
Borrowings, non-current (USD) 25M 25M 25M 25.1M 25M 30.2M 27.7M 26.1M 25.2M 25M
Lease liabilities (USD) — — 0.00 238M 241M 193M 163M 146M 138M 119M
Cash and deposits (USD) 362M 583M 771M 937M 1.32B 1.45B 1.68B 2.04B 1.29B 1.3B
Intangible assets (USD) 51.3M 44.5M 57.1M 56.3M 52M 101M 77.7M 71.1M 436M 407M
Right-of-use assets (USD) — — 0.00 239M 229M 185M 149M 135M 128M 115M
Net debt (borrowings + leases - cash) (USD) -337M -558M -746M -673M -1.06B -1.21B -1.49B -1.86B -1.12B -1.15B
Cash flow detail
Operating cash flow (USD) 165M 195M 292M 287M 544M 572M 464M 563M 559M 655M
Purchases of property, plant and equipment (USD) -29.3M -29.8M -37.6M -99.3M -68.8M -112M -81.6M -28.4M -32.1M -42.2M
Change in receivables (cash effect) (USD) -30.6M -58.7M -31M -87.2M 4.24M — — — — —
Change in payables (cash effect) (USD) 741,000 1.22M -772,000 -1.69M 2.43M -2.4M -2.93M 154,000 -29.1M -12.7M
Share buybacks (cash effect) (USD) — — — — — 0.00 0.00 -165M -398M -662M
Interest paid (cash effect) (USD) -566,000 -548,000 -777,000 -832,000 -425,000 -413,000 -1.66M -4.7M -3.74M -1.4M
Income taxes paid (cash effect) (USD) -37.5M -26.7M -40.4M -65.3M -54.5M -87.3M -113M -177M -196M -184M
Share-based compensation (USD) 49.2M 52.4M 59.2M 72M 75.2M 112M 99.9M 148M 167M 177M
Operating cash flow before change in receivables (USD) 195M 254M 323M 375M 540M — — — — —
Free cash flow (OCF - PPE - intangibles) (USD) 136M 166M 255M 188M 476M 461M 382M 534M 527M 613M
Income detail
Total comprehensive income (USD) 96.7M 92.8M 216M 271M 333M 453M 378M 473M 377M 513M
Comprehensive income to owners (USD) 96.7M 92.8M 216M 271M 333M 453M 378M 473M 377M 513M
Provision for credit losses (USD) 1.54M 51,000 848,000 1.62M 2.25M 2.49M 12.4M 4.05M -4.4M 1.81M
Credit cost ratio (credit losses / average receivables) (%) 0.8% 0.0% 0.3% — — — — — — —
Reported Mar 1, 2017 Feb 27, 2018 May 9, 2019 Mar 2, 2020 Aug 6, 2021 Feb 22, 2024 Feb 22, 2024 Feb 22, 2024 Feb 28, 2025 Feb 26, 2026

Sign up to see institutional holdings

Sign Up

Podcast Mentions

Sign up to see podcast mentions and sentiment

Sign Up

Accelerated Share Repurchase

On November 9, 2026, EPAM Systems, Inc. (the “Company”) entered into a Fixed Dollar Accelerated Share Repurchase Transaction agreement (the “ASR Agreement”) with UBS AG, London Branch, represented by UBS Securities LLC (“UBS”) to repurchase an aggregate of $500 million of shares of the Company’s common stock (the “Common Stock”). The accelerated share repurchase transaction under the ASR Agreement (the “ASR Transaction”) is being consummated under the Company’s $1.8 billion share repurchase authorization approved by the Company’s Board of Directors (the “Board”) on September 30, 2026.

Under the terms of the ASR Agreement, the Company will make a payment of $500 million to UBS, and will receive from UBS (expected by November 10, 2026) an initial delivery of 2,550,695 shares of Common Stock, or $400 million worth based on the closing price of the Common Stock on November 9, 2026.

EPAM Reports Results for Third Quarter 2026 Bull 5 Bear 0 Results

View all news

EPAM Reports Results for Third Quarter 2026

Date

November 5, 2026

Download(opens in new window)

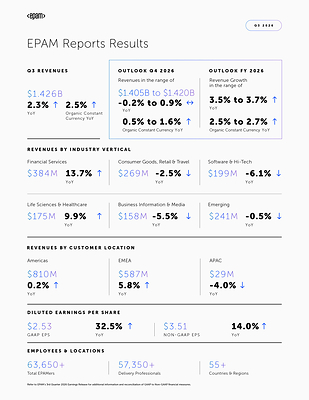
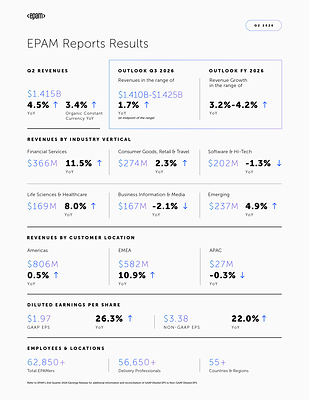
  • Third quarter revenues of $1.426 billion, up 2.3% year-over-year and 2.5% on an organic constant currency basis
  • Third quarter GAAP income from operations increased to 12.3% of revenues from 10.4%, and non-GAAP income from operations increased to 16.7% of revenues from 16.0%, on a year-over-year basis
  • Third quarter GAAP diluted EPS of $2.53, an increase of $0.62, or 32.5%, and non-GAAP diluted EPS of $3.51, an increase of $0.43, or 14.0%, on a year-over-year basis
  • Increased share repurchase authorization by $1.5 billion, bringing the total remaining authorization to $1.8 billion, and plans to enter a $500 million accelerated share repurchase next week
  • EPAM commits to return at least 50% of free cash flow to shareholders annually from 2027 through 2029
  • For the full year, EPAM now expects the year-over-year revenue growth rate to be in the range of 3.5% to 3.7% and now expects the year-over-year revenue growth rate on an organic constant currency basis to be in the range of 2.5% to 2.7%
  • For the full year, EPAM now expects its GAAP diluted EPS to be in the range of $8.41 to $8.49, and non-GAAP diluted EPS to be in the range of $13.23 to $13.31

NEWTOWN, Pa., Nov. 5, 2026 /PRNewswire/ -- EPAM Systems, Inc. (NYSE: EPAM), a leading digital and AI transformation company, today announced results for its third quarter ended September 30, 2026.

EPAM reports results for third quarter 2026

"We delivered a strong quarter, with better-than-expected results, continued margin expansion, AI-native momentum and traction in our transformation strategy," said Balazs Fejes, CEO & President, EPAM. "We continued to scale our strategic partnerships and forward-deployed engineering network, launched our new Frontier AI Services and increased capital return to shareholders."

Third Quarter 2026 Highlights

  • Revenues increased to $1.426 billion, a year-over-year increase of $32.1 million, or 2.3%. On an organic constant currency basis, revenues were up 2.5% compared to the third quarter of 2025;
  • GAAP income from operations was $175.9 million, an increase of $31.0 million, or 21.4%, compared to $144.9 million in the third quarter of 2025. As a percentage of revenues, GAAP income from operations increased to 12.3% from 10.4% in the third quarter of 2025;
  • Non-GAAP income from operations was $238.4 million, an increase of $15.6 million, or 7.0%, compared to $222.8 million in the third quarter of 2025. As a percentage of revenues, non-GAAP income from operations increased to 16.7% from 16.0% in the third quarter of 2025;
  • Diluted earnings per share ("EPS") on a GAAP basis was $2.53, an increase of $0.62, or 32.5%, compared to $1.91 in the third quarter of 2025; and
  • Non-GAAP diluted EPS was $3.51, an increase of $0.43, or 14.0%, compared to $3.08 in the third quarter of 2025.

Cash Flow and Other Metrics

  • Cash provided by operating activities was $288.8 million for the three months ended September 30, 2026, compared to cash provided by operating activities of $294.7 million for the three months ended September 30, 2025;
  • Cash provided by operating activities was $250.1 million for the first nine months of 2026, compared to cash provided by operating activities of $372.0 million for the first nine months of 2025;
  • Cash, cash equivalents and restricted cash totaled $969.9 million as of September 30, 2026, a decrease of $331.4 million, or 25.5%, from $1.301 billion as of December 31, 2025; and
  • Total headcount was approximately 63,650 as of September 30, 2026. Included in this number were approximately 57,350 delivery professionals, an increase of 1.2% from June 30, 2026.

Capital Allocation

  • EPAM has returned approximately $1.7 billion to shareholders since the initiation of the Company's repurchase programs in 2023.
  • The Company spent approximately $489 million on share repurchases during the first nine months of 2026 under its share repurchase program, which included approximately $80 million during the third quarter.
  • During the week of November 9, 2026, EPAM expects to enter into a $500 million accelerated share repurchase (Q4 ASR). The Company intends to fund the share repurchase under the Q4 ASR using cash on hand and borrowings under its existing credit facility.
  • The Company is committed to returning at least 50% of its free cash flows to shareholders annually from 2027 through 2029.
  • In support of this three-year capital return commitment and the Q4 ASR, the Board of Directors approved up to $1.5 billion1 in incremental repurchase authorization.
____________________
1 On September 30, 2026, the Board of Directors terminated and replaced the existing repurchase program (including its remaining $293 million authorization) with a new share repurchase program for up to $1.8 billion of the Company's outstanding common stock through December 31, 2029. The Company may repurchase shares of its common stock on a discretionary basis from time to time through open-market purchases, privately negotiated transactions or other means, including through the use of trading plans intended to qualify under Rule 10b5-1 under the Securities Exchange Act of 1934, as amended. The timing and total amount of stock repurchases will depend upon business, economic and market conditions, corporate and regulatory requirements, prevailing stock prices, and other considerations. The share repurchase program may be suspended or discontinued at any time, and does not obligate the Company to acquire any amount of common stock.

2026 Outlook - Full Year and Fourth Quarter

Full Year

EPAM expects the following for the full year:

  • The Company now expects the year-over-year revenue growth rate to be in the range of 3.5% to 3.7% for 2026 and now expects the year-over-year revenue growth rate on an organic constant currency basis to be in the range of 2.5% to 2.7%;
  • For the full year, EPAM now expects GAAP income from operations to be in the range of 10.7% to 10.9% of revenues and non-GAAP income from operations to be in the range of 15.9% to 16.1% of revenues;
  • The Company continues to expect its GAAP effective tax rate to be approximately 27% and its non-GAAP effective tax rate to be approximately 24%; and
  • EPAM now expects GAAP diluted EPS to be in the range of $8.41 to $8.49 and non-GAAP diluted EPS to be in the range of $13.23 to $13.31. The Company now expects weighted average diluted shares outstanding for the year to be 52.0 million.

Fourth Quarter

EPAM expects the following for the fourth quarter:

  • The Company expects revenues will be in the range of $1.405 billion to $1.420 billion for the fourth quarter, reflecting a year-over-year change of (0.2)% to 0.9%. The Company expects the year-over-year revenue growth rate on an organic constant currency basis to be 0.5% to 1.6%;
  • For the fourth quarter, EPAM expects GAAP income from operations to be in the range of 11.5% to 12.5% of revenues and non-GAAP income from operations to be in the range of 16.0% to 17.0% of revenues;
  • The Company expects its GAAP effective tax rate to be approximately 26% and its non-GAAP effective tax rate to be approximately 24%; and
  • EPAM expects GAAP diluted EPS will be in the range of $2.43 to $2.51 for the quarter, and non-GAAP diluted EPS will be in the range of $3.50 to $3.58 for the quarter. The Company expects weighted average diluted shares outstanding for the quarter to be 49.9 million.

Conference Call Information

EPAM will host a conference call to discuss the results on Thursday, November 5, 2026, at 8:00 a.m. ET. The conference call will be available live on the EPAM website at https://investors.epam.com . Please visit the website at least 15 minutes prior to the call to register for the event. For those who cannot access the live webcast, a replay will be available in the Investor Relations section of the website.

About EPAM Systems

EPAM (NYSE:EPAM) is a global leader in AI transformation engineering and integrated consulting, serving Forbes Global 2000 companies and ambitious startups. With over thirty years of expertise in custom software, product and platform engineering, EPAM empowers organizations to become AI-Native enterprises, driving measurable value from innovation and digital investments. Recognized by industry benchmarks and leading analysts as a leader in AI, EPAM delivers globally while engaging locally, making the future real for clients, partners, and employees.

We are proud to be recognized by Forbes, Glassdoor, Newsweek, Time Magazine, Great Place to Work and kununu as a Most Loved Workplace around the world.

Learn more at www.epam.com  and follow us on LinkedIn .

Non-GAAP Financial Measures

EPAM supplements results reported in accordance with United States generally accepted accounting principles, referred to as GAAP, with non-GAAP financial measures. Management believes these measures help illustrate underlying trends in EPAM's business and uses the measures to establish budgets and operational goals, communicate internally and externally, for managing EPAM's business and evaluating its performance. Management also believes these measures help investors compare EPAM's operating performance with its results in prior periods. EPAM anticipates that it will continue to report both GAAP and certain non-GAAP financial measures in its financial results, including non-GAAP results that exclude stock-based compensation expenses, acquisition-related costs including amortization of acquired intangible assets, impairment of assets, expenses associated with EPAM's humanitarian commitment to its professionals in Ukraine, employee separation costs incurred in connection with restructuring programs, certain other one-time charges and benefits, changes in fair value of contingent consideration, foreign exchange gains and losses, excess tax benefits and tax shortfalls related to stock-based compensation, and the related effect on income taxes of the pre-tax adjustments. Management also compares revenues on an "organic constant currency basis," which is a non-GAAP financial measure. This measure excludes the effect of acquisitions by removing revenues from an acquired company in the twelve months after completing an acquisition and foreign currency exchange rate fluctuations by translating current period revenues into U.S. dollars at the weighted average exchange rates of the prior period of comparison. Because EPAM's reported non-GAAP financial measures are not calculated in accordance with GAAP, these measures are not comparable to GAAP and may not be comparable to similarly described non-GAAP measures reported by other companies within EPAM's industry. Consequently, EPAM's non-GAAP financial measures should not be evaluated in isolation or supplant comparable GAAP measures, but rather, should be considered together with the information in EPAM's consolidated financial statements, which are prepared in accordance with GAAP.

Forward-Looking Statements

This press release includes estimates and statements which may constitute forward-looking statements made pursuant to the safe harbor provisions of the Private Securities Litigation Reform Act of 1995, the accuracy of which are necessarily subject to risks, uncertainties, and assumptions as to future events that may not prove to be accurate. Our estimates and forward-looking statements are mainly based on our current expectations and estimates of future events and trends, which affect or may affect our business and operations. These statements may include words such as "may," "will," "should," "believe," "expect," "anticipate," "intend," "plan," "estimate"or similar expressions. Those future events and trends may relate to, among other things, developments relating to the war in Ukraine and escalation of the war in the surrounding region, political and civil unrest or military action in the geographies where we conduct business and operate, difficult conditions in global capital markets, foreign exchange markets, global trade and the broader economy, the adoption and implementation of artificial intelligence technologies by EPAM and its clients, and the effect that these events may have on client demand and our revenues, operations, access to capital, and profitability. Other factors that could cause actual results to differ materially from those expressed or implied include general economic conditions, the risk factors discussed in the Company's most recent Annual Report on Form 10-K and the factors discussed in the Company's Quarterly Reports on Form 10-Q, particularly under the headings "Management's Discussion and Analysis of Financial Condition and Results of Operations" and "Risk Factors"and other filings with the Securities and Exchange Commission. Although we believe that these estimates and forward-looking statements are based upon reasonable assumptions, they are subject to several risks and uncertainties and are made based on information currently available to us. EPAM undertakes no obligation to update or revise any forward-looking statements, whether as a result of new information, future events, or otherwise, except as may be required under applicable securities law.

EPAM SYSTEMS, INC. AND SUBSIDIARIESCONDENSED CONSOLIDATED STATEMENTS OF INCOME(Unaudited)(In thousands, except per share data)
Three Months EndedSeptember 30, Nine Months EndedSeptember 30,
2026 2025 2026 2025
Revenues $  1,426,430 $  1,394,373 $ 4,241,258 $ 4,049,508
Operating expenses:
Cost of revenues (exclusive of depreciation andamortization) 980,493 983,169 2,977,744 2,899,189
Selling, general and administrative expenses 237,389 234,948 722,336 685,546
Depreciation and amortization expense 32,620 31,313 96,260 94,024
Income from operations 175,928 144,943 444,918 370,749
Interest and other income (loss), net (907) 2,302 (1,146) 11,635
Foreign exchange gain (loss) 1,315 (3,627) (6,237) (20,581)
Income before provision for income taxes 176,336 143,618 437,535 361,803
Provision for income taxes 46,025 36,802 121,724 93,479
Net income $    130,311 $    106,816 $  315,811 $  268,324
Net income per share:
Basic $         2.53 $         1.92 $       6.02 $       4.77
Diluted $         2.53 $         1.91 $       6.00 $       4.75
Shares used in calculation of net income per share:
Basic 51,428 55,557 52,464 56,214
Diluted 51,469 55,817 52,630 56,534
EPAM SYSTEMS, INC. AND SUBSIDIARIESCONDENSED CONSOLIDATED BALANCE SHEETS(Unaudited)(In thousands, except par value)
As ofSeptember 30,2026 As ofDecember 31,2025
Assets
Current assets
Cash and cash equivalents $     965,173 $   1,296,077
Trade receivables and contract assets, net of allowance of $3,565 and $6,350,respectively 1,213,416 1,108,201
Prepaid and other current assets 154,661 129,610
Total current assets 2,333,250 2,533,888
Property and equipment, net 203,116 202,387
Operating lease right-of-use assets, net 117,965 114,875
Intangible assets, net 352,892 406,586
Goodwill 1,201,921 1,210,564
Deferred tax assets 302,347 295,115
Other noncurrent assets 171,138 138,721
Total assets $  4,682,629 $  4,902,136
Liabilities
Current liabilities
Accounts payable $       36,840 $       55,329
Accrued compensation and benefits expenses 567,546 608,232
Accrued expenses and other current liabilities 188,604 250,688
Income taxes payable, current 12,854 25,520
Operating lease liabilities, current 38,195 37,173
Total current liabilities 844,039 976,942
Long-term debt 25,000 25,034
Operating lease liabilities, noncurrent 83,133 81,497
Deferred tax liabilities, noncurrent 73,348 76,969
Other noncurrent liabilities 62,334 63,886
Total liabilities 1,087,854 1,224,328
Commitments and contingencies
Equity
Stockholders' equity
Common stock, $0.001 par value; 160,000 shares authorized; 50,883 shares issuedand outstanding at September 30, 2026, and 54,274 shares issued and outstandingat December 31, 2025 51 54
Additional paid-in capital 1,528,262 1,390,423
Retained earnings 2,085,240 2,268,204
Accumulated other comprehensive income (loss) (19,360) 18,545
Total EPAM Systems, Inc. stockholders' equity 3,594,193 3,677,226
Noncontrolling interest in consolidated subsidiaries 582 582
Total equity 3,594,775 3,677,808
Total liabilities and equity $  4,682,629 $  4,902,136
EPAM SYSTEMS, INC. AND SUBSIDIARIESReconciliations of Non-GAAP Financial Measures to Comparable GAAP Financial Measures(Unaudited)(In thousands, except percentages and per share amounts)
Reconciliation of year-over-year revenue growth as reported on a GAAP basis to revenue growth on an organic constantcurrency basis is presented in the table below:
Three Months EndedSeptember 30, 2026 Nine Months EndedSeptember 30, 2026
Revenue growth as reported 2.3 % 4.7 %
Inorganic revenue — % — %
Foreign exchange rates 0.2 % (1.6) %
Revenue growth on an organic constant currency basis 2.5 % 3.1 %
Reconciliation of various income statement amounts from GAAP to non-GAAP for the three and nine months ended September 30, 2026 and 2025:
Three Months EndedSeptember 30, 2026 Nine Months EndedSeptember 30, 2026
GAAP Adjustments Non-GAAP GAAP Adjustments Non-GAAP
Cost of revenues (exclusive ofdepreciation and amortization)(1) $ 980,493 $  (21,583) $ 958,910 $2,977,744 $   (68,354) $2,909,390
Selling, general andadministrative expenses(2) $ 237,389 $  (23,463) $ 213,926 $  722,336 $ (105,777) $   616,559
Income from operations(3) $ 175,928 $   62,492 $ 238,420 $  444,918 $  226,904 $   671,822
Operating margin 12.3 % 4.4 % 16.7 % 10.5 % 5.3 % 15.8 %
Net income(4) $ 130,311 $   50,551 $ 180,862 $  315,811 $  197,086 $   512,897
Diluted earnings per share $       2.53 $       3.51 $        6.00 $         9.75
Three Months EndedSeptember 30, 2025 Nine Months EndedSeptember 30, 2025
GAAP Adjustments Non-GAAP GAAP Adjustments Non-GAAP
Cost of revenues (exclusive ofdepreciation and amortization)(1) $ 983,169 $  (21,732) $ 961,437 $2,899,189 $   (64,505) $2,834,684
Selling, general andadministrative expenses(2) $ 234,948 $  (37,924) $ 197,024 $   685,546 $ (112,496) $   573,050
Income from operations(3) $ 144,943 $   77,876 $ 222,819 $   370,749 $  230,713 $   601,462
Operating margin 10.4 % 5.6 % 16.0 % 9.2 % 5.7 % 14.9 %
Net income(4) $ 106,816 $   64,978 $ 171,794 $   268,324 $  198,276 $   466,600
Diluted earnings per share $       1.91 $       3.08 $         4.75 $         8.25
Items (1) through (4) above are detailed in the table below with the specific cross-reference noted in the appropriate item.
Three Months EndedSeptember 30, Nine Months EndedSeptember 30,
2026 2025 2026 2025
Stock-based compensation expenses $      21,054 $      21,149 $   66,740 $   63,233
Humanitarian support in Ukraine(a) 529 583 1,614 1,777
Poland R&D incentives(b) — — — (505)
Total adjustments to GAAP cost of revenues**(1)** 21,583 21,732 68,354 64,505
Stock-based compensation expenses 21,424 23,455 72,058 68,385
Cost Optimization charges(c) — 11,028 27,336 32,614
Humanitarian support in Ukraine(a) 2,024 3,375 6,394 10,389
Other acquisition-related expenses — 64 7 926
One-time charges (benefits) 15 2 (18) 182
Total adjustments to GAAP selling, general andadministrative expenses**(2)** 23,463 37,924 105,777 112,496
Amortization of acquired intangible assets 17,446 18,220 52,773 53,712
Total adjustments to GAAP income from operations**(3)** 62,492 77,876 226,904 230,713
Foreign exchange loss (gain) (1,315) 3,627 6,237 20,581
Change in fair value of contingent consideration included in   Interest and other income, net 1,169 1,556 3,589 (413)
Impairment of financial assets 1,410 — 1,766 —
Gain on financial instrument — (350) — (700)
Provision for income taxes:
Tax effect on non-GAAP adjustments (13,232) (17,254) (52,360) (55,455)
Tax shortfall related to stock-based compensation 472 188 12,064 751
Net discrete charge (benefit) from tax planning(d) (445) (665) (1,114) 2,799
Total adjustments to GAAP net income**(4)** $      50,551 $      64,978 $ 197,086 $ 198,276
(a) Humanitarian support in Ukraine includes expenses related to EPAM's $100 million humanitarian commitment in response to Russia's invasion of Ukraine to support EPAM professionals and their families in and displaced from Ukraine. These expenses are incremental to those expenses incurred prior to the crisis, clearly separable from normal operations, and not expected to recur once the crisis has subsided and operations return to normal.
(b) We have excluded from non-GAAP results the portion of the benefit from Poland R&D incentives related to qualifying activities performed in 2023 as it represents a nonrecurring one-time benefit.
(c) Cost Optimization charges include employee separation costs incurred in connection with the programs initiated in the second quarter of 2024 and second quarter of 2025. Consistent with the Company's historical non-GAAP policy, costs incurred in connection with formal restructuring initiatives have been excluded from non-GAAP results as these are attributable to targeted restructuring efforts and not expected to recur once the respective Cost Optimization program is completed.
(d) Net discrete charge (benefit) related to the implementation of tax planning to disregard certain foreign subsidiaries as separate entities for U.S. income tax purposes. Consistent with the Company's historical non-GAAP policy, the charge (benefit) related to the implementation of tax planning has been excluded from non-GAAP results as it is one-time and unusual in nature.
EPAM SYSTEMS, INC. AND SUBSIDIARIESReconciliations of Guidance Non-GAAP Financial Measures to Comparable GAAP Financial Measures(Unaudited)
The below guidance constitutes forward-looking statements within the meaning of the federal securities laws and is basedon a number of assumptions that are subject to change and many of which are outside the control of the Company. Actualresults may differ materially from the Company's expectations depending on factors discussed in the Company's filingswith the Securities and Exchange Commission.
Reconciliation of expected year-over-year revenue growth on a GAAP basis to expected revenue growth on an organicconstant currency basis is presented in the table below:
Fourth Quarter 2026 Full Year 2026
Revenue growth (0.2)% to 0.9% 3.5% to 3.7%
Foreign exchange rates impact 0.7 % (1.0) %
Inorganic revenue growth — % — %
Revenue growth on an organic constant currency basis 0.5% to 1.6% 2.5% to 2.7%
Reconciliation of expected GAAP to non-GAAP income from operations as a percentage of revenues is presented in thetable below:
Fourth Quarter 2026 Full Year 2026
GAAP income from operations as a percentage of revenues 11.5% to 12.5% 10.7% to 10.9%
Stock-based compensation expenses 3.1 % 3.3 %
Included in cost of revenues (exclusive of depreciation and amortization) 1.5 % 1.6 %
Included in selling, general and administrative expenses 1.6 % 1.7 %
Humanitarian support in Ukraine(a) 0.2 % 0.2 %
Cost Optimization charges(c) — % 0.5 %
Amortization of acquired intangible assets 1.2 % 1.2 %
Non-GAAP income from operations as a percentage of revenues**(e)** 16.0% to 17.0% 15.9% to 16.1%
(e)   EPAM has not included the impact of potential future one-time charges including asset impairments, unusual gains       and losses, expenses incurred in connection with future cost optimization actions, and other acquisition-related       expenses because the Company is unable to predict these amounts with reasonable certainty.
Reconciliation of expected GAAP to non-GAAP effective tax rate is presented in the table below:
Fourth Quarter 2026 Full Year 2026
GAAP effective tax rate (approximately) 26.0 % 27.0 %
Tax effect on non-GAAP adjustments (1.3) % (0.9) %
Tax shortfall related to stock-based compensation (0.7) % (2.2) %
Net discrete benefit from tax planning(d) — % 0.1 %
Non-GAAP effective tax rate (approximately) 24.0 % 24.0 %
Reconciliation of expected GAAP to non-GAAP diluted earnings per share is presented in the table below:
Fourth Quarter 2026 Full Year 2026
GAAP diluted earnings per share $2.43 to $2.51 $8.41 to $8.49
Stock-based compensation expenses 0.91 3.54
Included in cost of revenues (exclusive of depreciation and amortization) 0.44 1.70
Included in selling, general and administrative expenses 0.47 1.84
Humanitarian support in Ukraine(a) 0.08 0.22
Cost Optimization charges(c) — 0.53
One-time charges(e) — 0.03
Amortization of acquired intangible assets 0.34 1.34
Change in fair value of contingent consideration — 0.07
Foreign exchange loss 0.02 0.14
Provision for income taxes:
Tax effect on non-GAAP adjustments (0.30) (1.29)
Tax shortfall related to stock-based compensation 0.02 0.26
Net discrete benefit from tax planning(d) — (0.02)
Non-GAAP diluted earnings per share**(e)** $3.50 to $3.58 $13.23 to $13.31

EPAM logo

Cision View original content to download multimedia:https://www.prnewswire.com/news-releases/epam-reports-results-for-third-quarter-2026-302930064.html

SOURCE EPAM Systems, Inc.

View all news

Twitter Linked In Facebook Print [Mail](mailto: [email protected] "Mail") Link Copied

Back to top

OUR BRANDS

SOLUTIONSHUB

Explore our enterprise software products, open source solutions and accelerators on EPAM SolutionsHub .

PARTNERS

Learn more about our Alliances and Partnerships .

POLICIES

SOCIAL

LinkedIn Facebook Instagram Youtube

© 2026 EPAM Systems, Inc.
All Rights Reserved. EPAM
and the EPAM logo are
registered trademarks of
EPAM Systems, Inc.

opens in new window

SHARE

Manage and customize your email subscription preferences

  • copy link link copied

EPAM Unveils New Frontier AI Service, Bridging the Enterprise Intelligence Gap for GenAI and Autonomous Agents EPAM Unveils New Frontier AI Service, Bridging the Enterprise Intelligence Gap for GenAI and Autonomous Agents

Press Release

October 5, 2026

EPAM Unveils New Frontier AI Service, Bridging the Enterprise Intelligence Gap for GenAI and Autonomous Agents

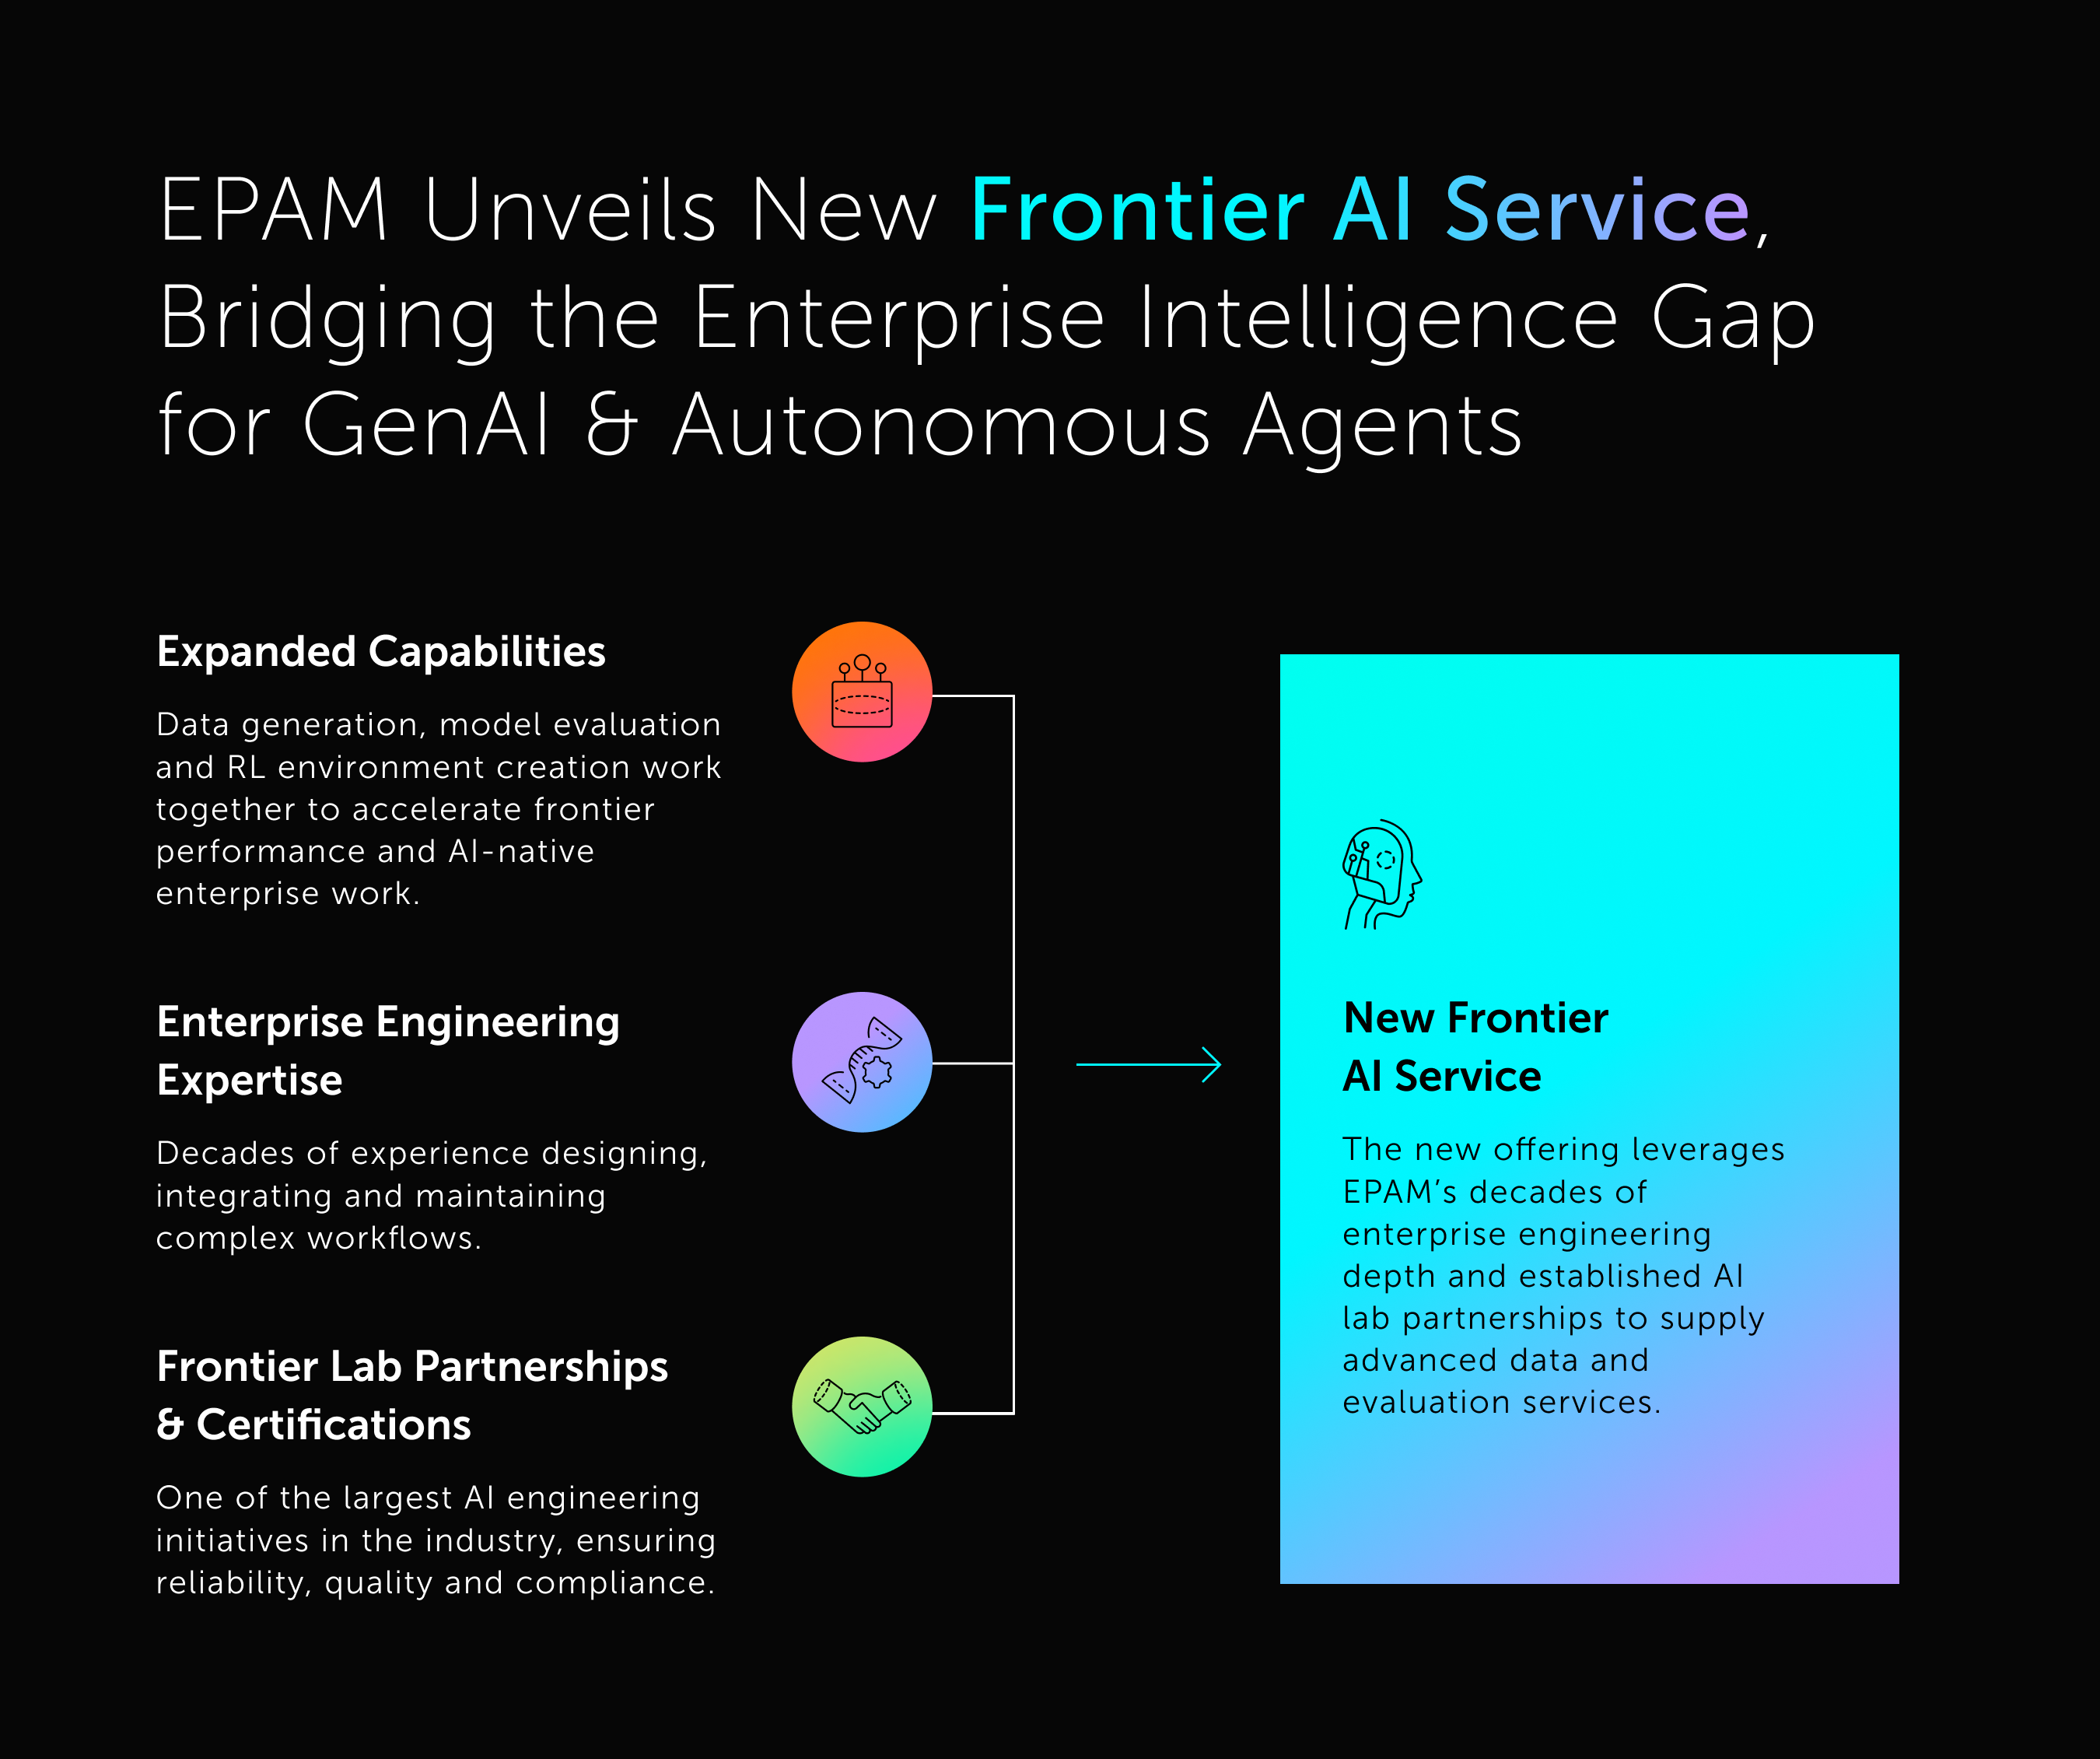
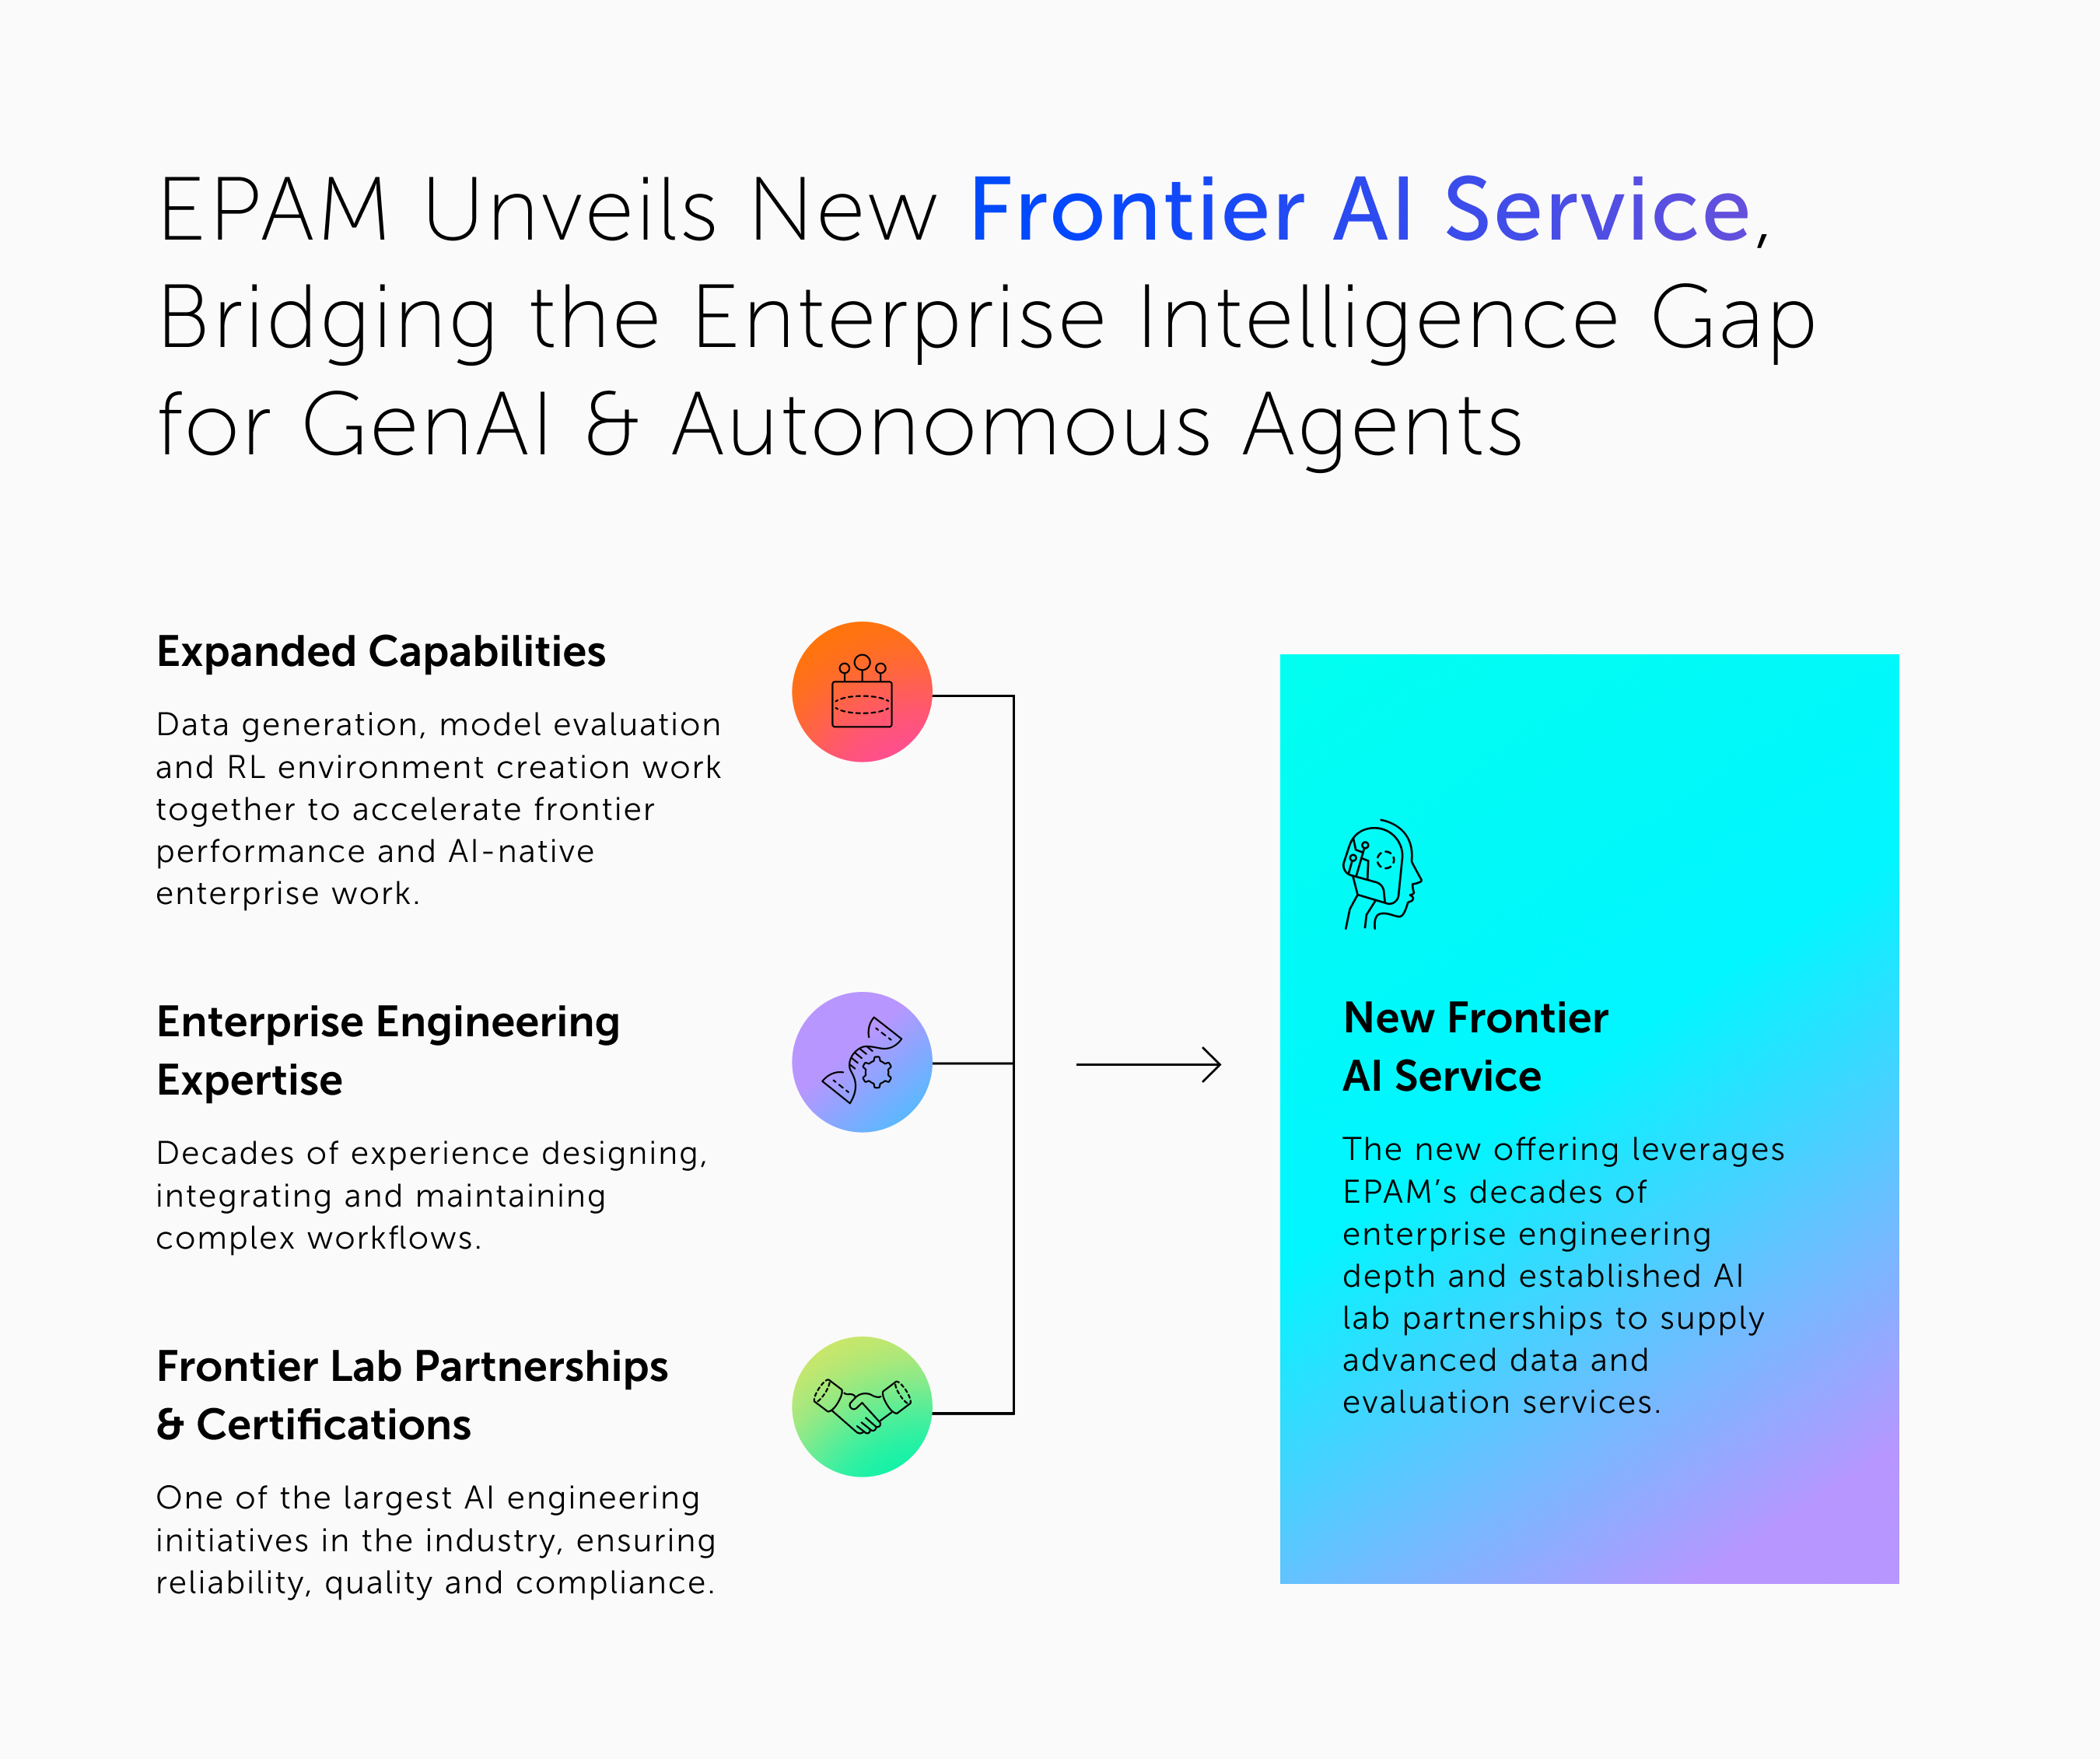
New offering leverages EPAM’s decades of enterprise engineering depth and established AI lab partnerships to supply advanced data and evaluation services

NEWTOWN, PA., USA, October 5, 2026 – EPAM Systems, Inc. (NYSE: EPAM) today announced the launch of a new strategic offering dedicated to powering the next generation of frontier AI models. Positioned as a foundational intelligence layer for the AI ecosystem, EPAM’s services address a critical industry bottleneck: enabling frontier AI models to execute complex, specialized enterprise workflows more reliably.

EPAM Unveils New Frontier AI Service, Bridging the Enterprise Intelligence Gap for GenAI & Autonomous Agents EPAM Unveils New Frontier AI Service, Bridging the Enterprise Intelligence Gap for GenAI & Autonomous Agents

Read our perspective on the future of model training and how EPAM is partnering with leading labs to solve the enterprise intelligence gap.

While early generative AI models were trained on broad, publicly available data to master general language and coding, the industry has entered a new era. As adoption accelerates, the focus has shifted toward complex enterprise workflows, multi-step agentic execution and specialized vertical reasoning that require vetted domain knowledge. By leveraging its deep, multi-decade experience in designing, integrating and maintaining complex enterprise workflows, EPAM will offer specialized competencies in high-fidelity data generation, rigorous model evaluation and the creation of custom reinforcement learning (RL) environments.

“As frontier AI shifts from general experimentation to complex enterprise workflows, the demand has fundamentally moved from raw compute to specialized domain intelligence,” said Elaina Shekhter, Chief Strategy & Transformation Officer at EPAM. “Our new offering bridges that critical gap by pairing our decades of deep engineering heritage with our established Frontier AI partnerships, uniquely positioning us to capture this massive, high-value market. We aren’t just participating in the GenAI wave, we’re actively building infrastructure that makes enterprise-grade autonomy possible.”

These capabilities are further anchored by EPAM’s established partnerships with the leading frontier AI labs, including Anthropic, OpenAI, Google and Microsoft. With one of the largest AI engineering initiatives in the industry, EPAM has trained and invested in nearly 10,000 Claude-certified architects, 3,000+ OpenAI-certified forward-deployed engineers (FDEs), and 5,000+ Gemini-certified specialists to-date. This certified proficiency across major model ecosystems, combined with firsthand insight into where models succeed and struggle in enterprise deployments, provides labs with the trusted, high-caliber collaboration required to accelerate model development and drive enterprises from pilot to measurable business outcomes.

A cornerstone of the service is the development of RL environments that support scenario simulation. These sophisticated, controlled virtual environments mirror complex enterprise systems and workflows, enabling developers to rigorously stress-test multi-turn interactions, reasoning and tool use before production while providing secure, closed-loop feedback for reinforcement learning and ongoing model improvement. According to research from Gartner® in its April 2026 report, titled Emerging Tech: AI Race: Simulation Supercharges Agent Evaluation and Self-Learning Loops for AI Agents, by 2028, 99% of agent platform providers will offer simulation environments, up from less than 25% in 2026.

Read our perspective on the future of model training and how EPAM is partnering with leading labs to solve the enterprise intelligence gap.

To learn more about EPAM’s latest AI capabilities and enterprise engineering services, visit: www.epam.com/frontier-ai

**Source:**Gartner Report, Emerging Tech: AI Race: Simulation Supercharges Agent Evaluation and Self-Learning Loops for AI Agents, By Radu Miclaus, Danielle Casey, etc., April 2026. Gartner is a trademark of Gartner, Inc. and/or its affiliates

About EPAM Systems, Inc.

EPAM (NYSE:EPAM) is a global leader in AI transformation engineering and integrated consulting, serving Forbes Global 2000 companies and ambitious startups. With over thirty years of expertise in custom software, product and platform engineering, EPAM empowers organizations to become AI-Native enterprises, driving measurable value from innovation and digital investments. Recognized by industry benchmarks and leading analysts as a leader in AI, EPAM delivers globally while engaging locally, making the future real for clients, partners, and employees.

We are proud to be recognized by Forbes, Glassdoor, Newsweek, Time Magazine, Great Place to Work and kununu as a Most Loved Workplace around the world.

Learn more at www.epam.com and follow us on LinkedIn.

Forward-Looking Statements

This press release includes estimates and statements which may constitute forward-looking statements made pursuant to the safe harbor provisions of the Private Securities Litigation Reform Act of 1995, the accuracy of which are necessarily subject to risks, uncertainties, and assumptions as to future events that may not prove to be accurate. Our estimates and forward-looking statements are mainly based on our current expectations and estimates of future events and trends, which affect or may affect our business and operations. These statements may include words such as "may," "will," "should," "believe," "expect," "anticipate," "intend," "plan," "estimate" or similar expressions. Those future events and trends may relate to, among other things, developments relating to the war in Ukraine and escalation of the war in the surrounding region, political and civil unrest or military action in the geographies where we conduct business and operate, difficult conditions in global capital markets, foreign exchange markets, global trade, and the broader economy, the adoption and implementation of artificial intelligence technologies by EPAM and its clients, and the effect that these events may have on client demand and our revenues, operations, access to capital, and profitability. Other factors that could cause actual results to differ materially from those expressed or implied include general economic conditions, the risk factors discussed in the Company's most recent Annual Report on Form 10-K and the factors discussed in the Company's Quarterly Reports on Form 10-Q, particularly under the headings "Management's Discussion and Analysis of Financial Condition and Results of Operations" and "Risk Factors" and other filings with the Securities and Exchange Commission. Although we believe that these estimates and forward-looking statements are based upon reasonable assumptions, they are subject to several risks and uncertainties and are made based on information currently available to us. EPAM undertakes no obligation to update or revise any forward-looking statements, whether as a result of new information, future events, or otherwise, except as may be required under applicable securities law.

Previous Next

  • Media Relations

Prompts

EPAM Systems, Inc. (ticker EPAM), listed in United States.

ETFs Holding EPAM Systems, Inc.

ETF Weight in ETF Shares Market value As of
ECML 3.16% 24,648 $ 3.8M Nov 18, 2026
RNIN 1.67% 22,790 $ 3.51M Nov 18, 2026
BSMC 1.58% 33,153 $ 2.631M Jun 30, 2026
NPFE 1.06% 65,219 $ 6.885M Jul 31, 2026
BUSA 0.85% 31,850 $ 2.527M Jun 30, 2026
AFSM 0.80% 7,213 $ 1.167M Nov 16, 2026
CGGO 0.66% 478,804 $ 77.47M Nov 16, 2026
AFMC 0.58% 9,465 $ 1.531M Nov 16, 2026
TAX 0.54% 1,163 $ 137.036K Aug 31, 2026
DSMC 0.52% 8,411 $ 667.413K Jun 30, 2026
JPSV 0.48% 883 $ 136.106K Nov 17, 2026
AFLG 0.43% 24,296 $ 3.931M Nov 16, 2026
ITAN 0.35% 2,789 $ 429.896K Nov 17, 2026
DFSV 0.34% 578,175 $ 94.722M Nov 12, 2026
REGS 0.31% 2,568 $ 203.771K Jun 30, 2026
DSTL 0.30% 80,506 $ 6.388M Jun 30, 2026
AVUV 0.30% 595,943 $ 96.424M Nov 16, 2026
GOP 0.30% 1,646 $ 266.323K Nov 17, 2026
DFAT 0.16% 313,706 $ 51.394M Nov 12, 2026
FTLS short -0.15% -23,415 $ 0.00 Nov 16, 2026
VFVA 0.14% 11,720 $ 1.381M Aug 31, 2026
GVLU 0.13% 2,135 $ 345.443K Nov 17, 2026
MKTN 0.11% 1,429 $ 113.391K Jun 30, 2026
IALT 0.09% 42,572 $ 6.888M Nov 16, 2026
SFGV 0.07% 5,534 $ 850K Nov 18, 2026
SEIS 0.07% 4,975 $ 394.766K Jun 30, 2026
VFMF 0.06% 5,230 $ 616.251K Aug 31, 2026
JMEE 0.06% 11,308 $ 1.743M Nov 17, 2026
DFAS 0.06% 114,555 $ 18.768M Nov 12, 2026
AVMC 0.03% 1,064 $ 172.155K Nov 16, 2026
AVMV 0.03% 1,590 $ 257.262K Nov 16, 2026
AVUS 0.02% 13,710 $ 2.218M Nov 16, 2026
SMDX 0.02% 154 $ 24.917K Nov 17, 2026
DFAC 0.02% 80,672 $ 13.216M Nov 12, 2026
FMDE 0.01% 11,765 $ 933.553K Jun 30, 2026
DXUV 0.01% 4,273 $ 700.046K Nov 12, 2026
DCOR 0.01% 28,871 $ 4.73M Nov 12, 2026
AVSU 0.01% 415 $ 67.147K Nov 16, 2026
FELV 0.01% 2,971 $ 235.749K Jun 30, 2026
DFUS 0.01% 6,851 $ 1.122M Nov 12, 2026
DFUV 0.00% 1,448 $ 237.226K Nov 12, 2026
DFAU 0.00% 808 $ 132.375K Nov 12, 2026
DFSU 0.00% 54 $ 8,846.82 Nov 12, 2026
EBI 0.00% 3 $ 353.49 Aug 31, 2026
AVLC 0.00% 355 $ 57.439K Nov 16, 2026