EMR
Fiscal year ends September Quarters are offset from the calendar — Q1 is Oct–Dec

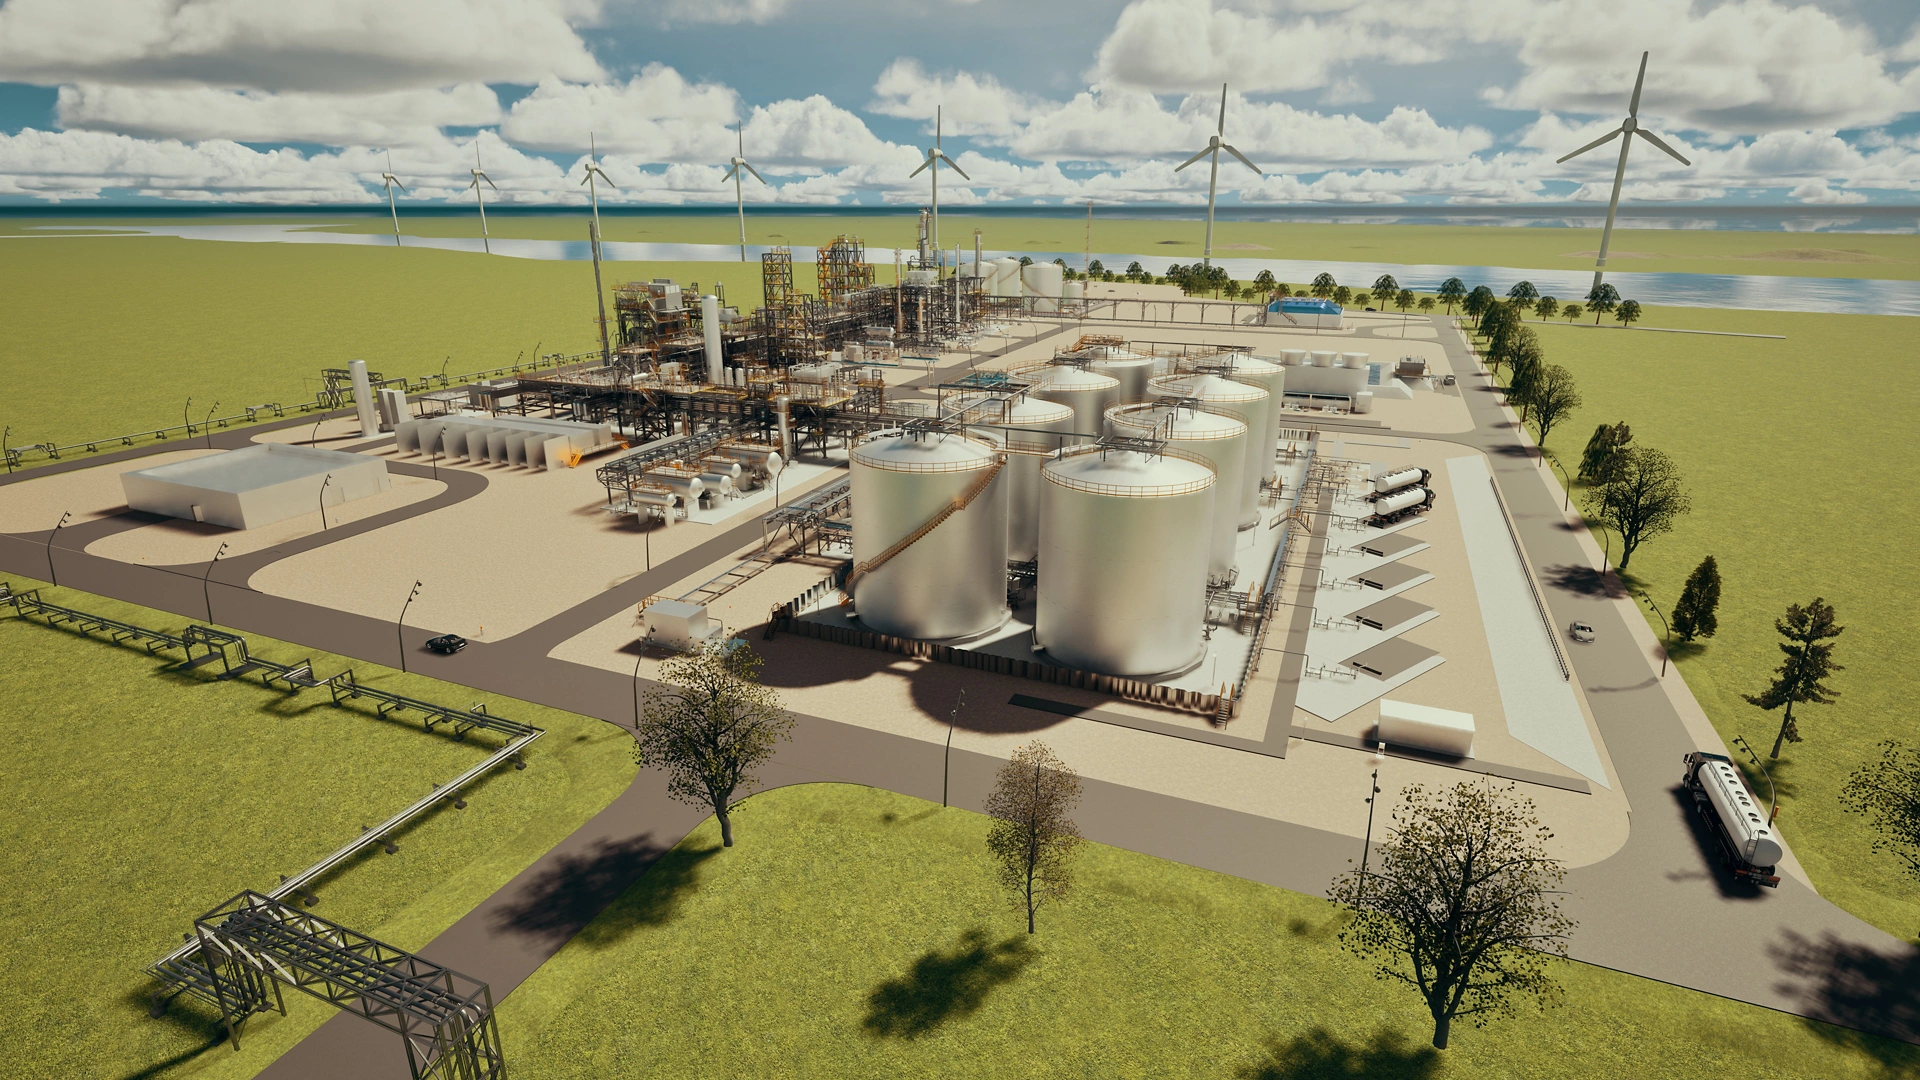
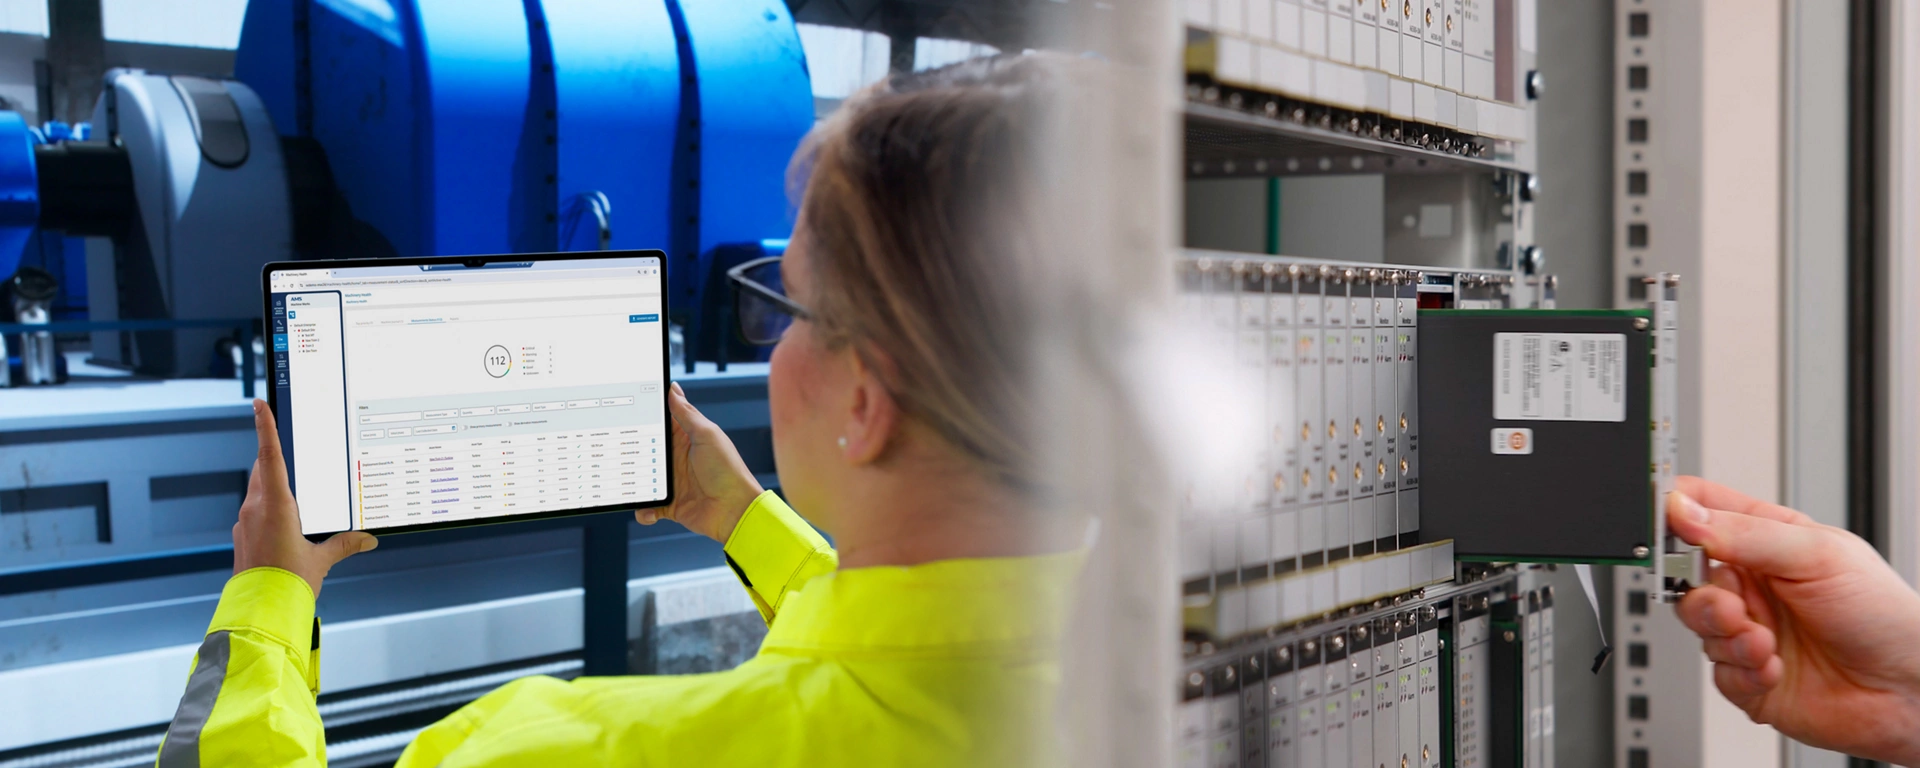
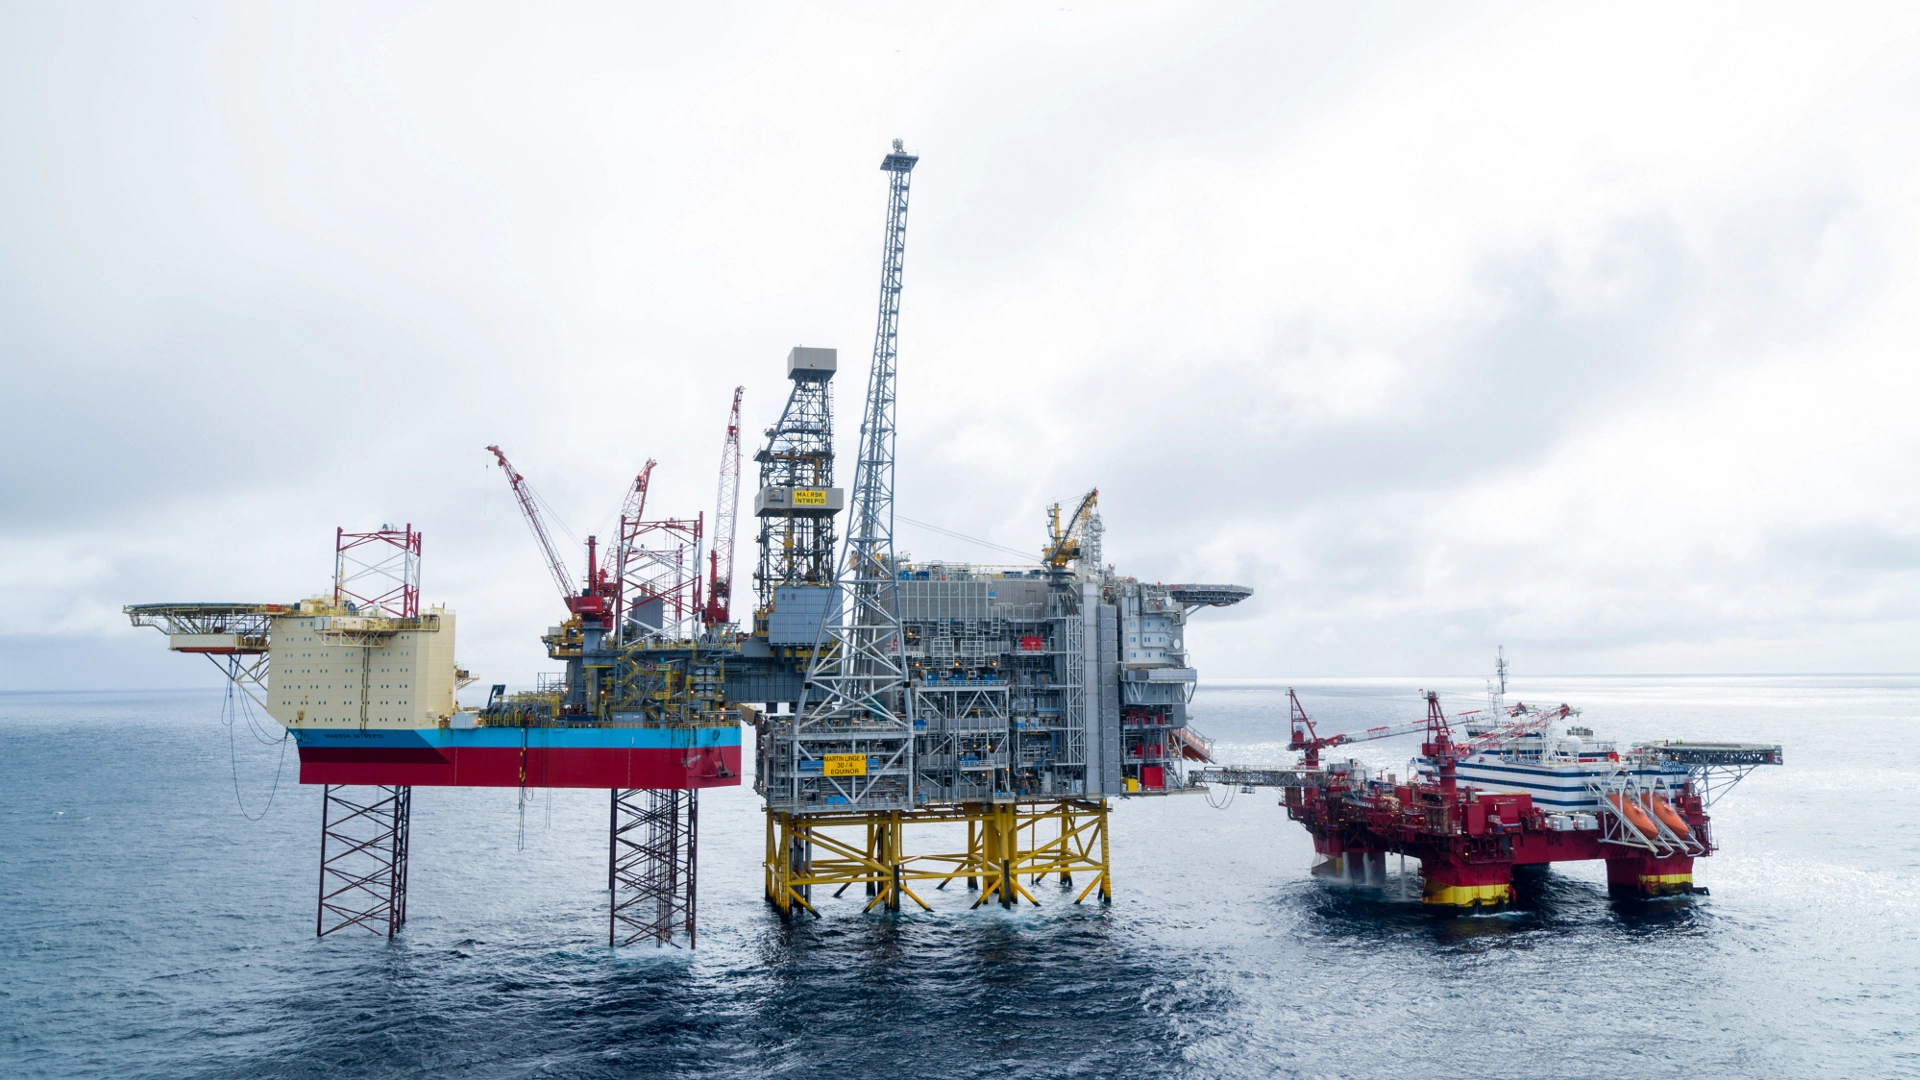
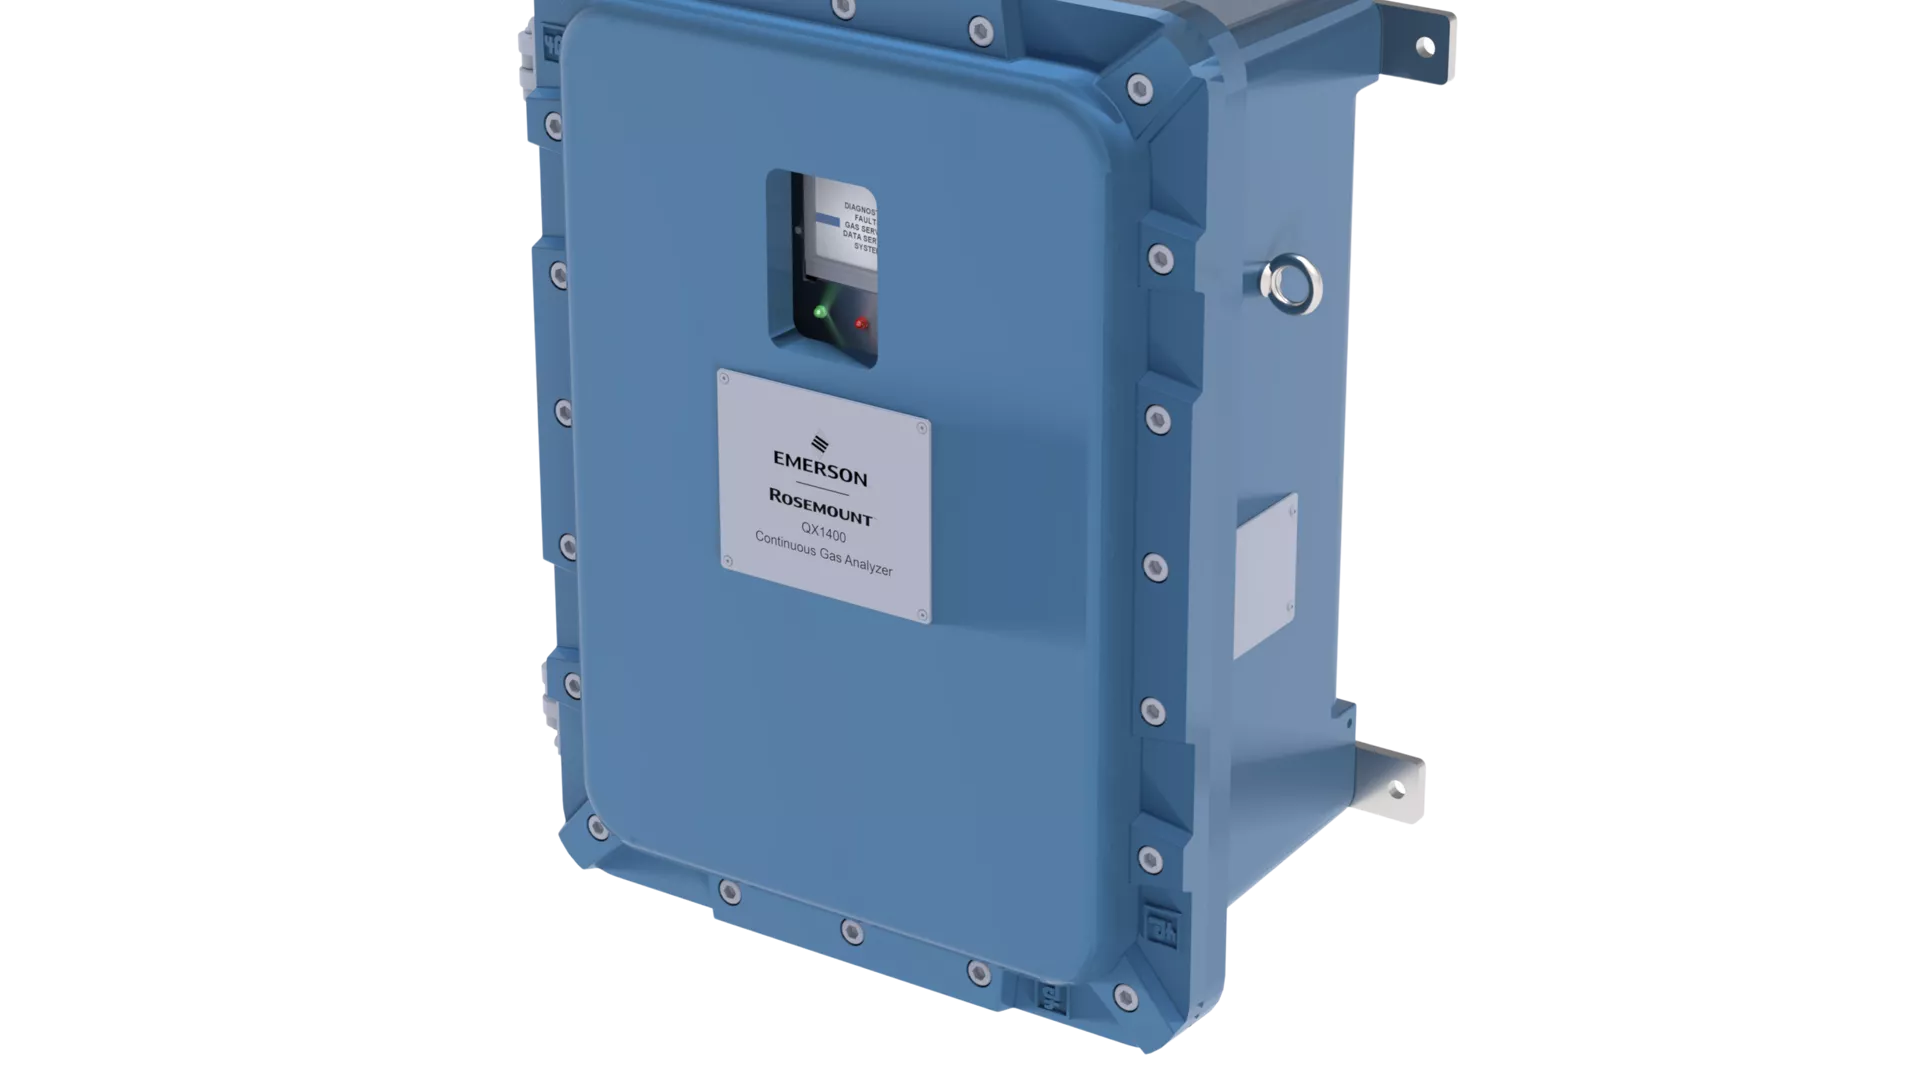
Emerson Electric Company is a global technology and software company providing automation solutions for process, hybrid, and discrete manufacturers. The company operates through six segments: Final Control, Measurement & Analytical, Discrete Automation, Safety & Productivity, Control Systems & Software, and Test & Measurement. Key products include control valves, intelligent instrumentation, solenoid valves, pipe-working tools, distributed control systems, and automated test and measurement systems. Emerson serves industries such as chemical, power, life sciences, metals, food & beverage, automotive, and semiconductor. The company acquired AspenTech in 2025 and National Instruments in 2023, while divesting its Climate Technologies business to Blackstone in 2023. Founded in 1890, Emerson serves customers in the Americas, Asia, Middle East & Africa, and Europe.

Summarised from the company's own disclosures, fiscal year ended Nov 2025

Industry Specialty Industrial Machinery Homepage emerson.com
Sector Industrials IR page ir.emerson.com
Tags
industrial automation, process control, measurement instrumentation, control valves, test and measurement, industrial software, discrete automation, safety tools, digital twins, asset optimization, AspenTech, National Instruments, Fisher, Crosby, Keystone, KTM, Vanessa, Anderson Greenwood, Bettis, Flexim, Micro Motion, Rosemount, ASCO, Aventics, Branson, PACSystems, SolaHD, TESCOM, TopWorx, Appleton, Afag, Movicon, Greenlee, Klauke, ProTeam, RIDGID, DeltaV, Ovation
Press page ir.emerson.com/news-events/press-releases

Metrics

Valuation  
Market cap $ 93.928B
Market cap (USD) $ 93.928B
P/E 35.19
PEG 4.55
P/BV 4.53
P/S 4.95
P/OCF 23.61
P/FCF 26.57
Dividend yield 0.01%
Turnover / mcap —
Returns  
ROE 13.1%
ROI 9.3%
ROIC 9.3%
Profit margin 14.2%
Growth  
Revenue growing Yes
Profits growing Yes
Revenue up 3y Yes
Revenue up 5y No
Earnings growth 3y (net profit CAGR) 7.7%
Quality  
Profitable Yes
Margin expanding Yes
Buying back stock Yes
Diluting (TTM) No
Debt/Equity 39.9%
Podcast bulls (TTM) Sign up
Podcast bears (TTM) Sign up
Podcast sentiment (TTM) Sign up
Podcast sentiment % (TTM) Sign up
News sentiment (TTM) 57
Quality score 31.6%
Insiders  
Buys, 1w Sign up
Buys, 1m Sign up
Buys, 1y Sign up
Sells, 1w Sign up
Sells, 1m Sign up
Sells, 1y Sign up

Sign up to see this company's insider trades

Figure FY 2026 FY 2025 FY 2024 FY 2023 FY 2022 FY 2021 FY 2020 FY 2019 FY 2018 FY 2017 FY 2016 FY 2015 FY 2014 FY 2013 FY 2012 FY 2011 FY 2010 FY 2009 FY 2008 FY 2007 FY 2006 FY 2005 FY 2004 FY 2003 FY 2002 FY 2001 FY 2000
Revenue 18.982B 18.016B 17.492B 15.165B 19.629B 18.236B 16.785B 18.372B 17.408B 15.264B 14.522B 22.304B 24.537B 24.669B 24.412B 24.222B 21.039B 20.915B 24.807B 22.572B 20.133B 17.305B 15.615B 13.958B 13.824B 15.48B 15.545B
Net profit 2.691B 2.293B 1.968B 13.219B 3.231B 2.303B 1.965B 2.306B 2.203B 1.518B 1.635B 2.71B 2.147B 2.004B 1.968B 2.48B 2.164B 1.724B 2.412B 2.136B 1.845B 1.422B 1.257B 1.089B 122M 1.032B 1.422B
Free cash flow 3.535B 2.667B 2.913B 274M 2.391B 2.994B 2.545B 2.412B 2.275B 1.436B 2.434B 1.844B 2.925B 2.971B 2.388B 2.586B 2.768B 2.555B 2.579B 2.335B 1.911B 1.669B 1.816B 1.394B 1.434B 1.154B 1.148B

Figure FY 2026 FY 2025 FY 2024 FY 2023 FY 2022 FY 2021 FY 2020 FY 2019 FY 2018 FY 2017 FY 2016 FY 2015 FY 2014 FY 2013 FY 2012 FY 2011 FY 2010 FY 2009 FY 2008 FY 2007 FY 2006 FY 2005 FY 2004 FY 2003 FY 2002 FY 2001 FY 2000
Share price 155.1 131.18 109.37 96.57 73.22 94.2 65.57 66.86 76.58 62.84 54.51 44.17 62.58 64.7 48.27 41.31 52.66 40.07 40.78 46.79 80.8 — — — — — —
Price performance 12m 0.18 0.2 0.13 0.32 -0.22 0.44 -0.02 -0.13 0.22 0.15 0.23 -0.29 -0.03 0.34 0.17 -0.22 0.31 -0.02 -0.13 -0.42 — — — — — — —

Filed figures

Figure Sep 2017 Sep 2018 Sep 2019 Sep 2020 Sep 2021 Sep 2022 Sep 2023 Sep 2024 Sep 2025 Sep 2026
Balance sheet detail
Trade receivables (USD) 3.07B 3.34B 2.99B 2.8B 2.97B 3.01B 2.52B 2.93B 3.1B 3.32B
↳ YoY growth +13.7% +8.9% -10.7% -6.1% +6.0% +1.2% -16.3% +16.2% +5.9% +7.0%
↳ 5y CAGR -9.2% -7.0% -9.9% -8.3% +1.9% -0.4% -5.5% -0.4% +2.0% +2.2%
Borrowings, current (USD) 862M 1.62B 1.44B 1.16B 872M 2.12B 547M 532M 4.8B 4.67B
Borrowings, non-current (USD) 3.79B 3.14B 4.28B 6.33B 5.79B 8.26B 7.61B 7.16B 8.32B 7.51B
Lease liabilities (USD) — — 0.00 521M 568M 492M 548M 669M 643M 694M
Cash and deposits (USD) 3.06B 1.09B 1.49B 3.32B 2.35B 1.8B 8.05B 3.59B 1.54B 1.81B
Intangible assets (USD) 1.89B 2.75B 2.62B 2.47B 2.88B 6.72B 6.26B 10.4B 9.46B 8.44B
Right-of-use assets (USD) — — 0.00 508M 558M 489M 550M 692M 637M 667M
Net debt (borrowings + leases - cash) (USD) 1.59B 3.67B 4.23B 4.17B 4.31B 9.06B 654M 4.77B 12.2B 11.1B
Cash flow detail
Operating cash flow (USD) 1.91B 2.89B 3.01B 3.08B 3.58B 2.92B 637M 3.33B 3.1B 3.98B
Purchases of property, plant and equipment (USD) -476M -617M -594M -538M -581M -531M -363M -419M -431M -443M
Change in receivables (cash effect) (USD) -25M -189M 51M 207M -165M -214M -191M -99M -171M -244M
Change in inventories (cash effect) (USD) 32M 17M -87M -6M -126M -469M -160M 122M -1M -241M
Change in payables (cash effect) (USD) 135M 115M -37M -196M 370M 122M -17M -16M 34M 291M
Dividends paid (cash effect) (USD) -1.24B -1.23B -1.21B -1.21B -1.21B -1.22B -1.2B -1.2B -1.19B -1.24B
Share buybacks (cash effect) (USD) -400M -1B -1.25B -942M -500M -500M -2B -435M -1.17B -1B
Interest paid (cash effect) (USD) -192M -193M -195M -163M -156M -199M -200M -193M -221M -249M
Income taxes paid (cash effect) (USD) -1.42B -680M -650M -400M -680M -720M -3.31B -950M -1.44B -960M
Share-based compensation (USD) 110M 216M 120M 110M 224M 144M 250M 260M 263M 237M
Operating cash flow before change in receivables (USD) 1.94B 3.08B 2.96B 2.88B 3.74B 3.14B 828M 3.43B 3.27B 4.22B
Free cash flow (OCF - PPE - intangibles) (USD) 1.44B 2.28B 2.41B 2.55B 2.99B 2.39B 274M 2.91B 2.67B 3.54B
Income detail
Research and development expense (USD) 340M 436M 454M 439M 485M 526M 523M 781M 771M 812M
↳ 5y CAGR -9.1% -5.4% -3.4% -2.8% +8.7% +9.1% +3.7% +11.5% +11.9% +10.9%
Total comprehensive income (USD) 2.53B 2.23B 1.62B 2.14B 3.03B 2.61B 13.4B 2.34B 2.29B 2.57B
Comprehensive income to owners (USD) 2.5B 2.21B 1.6B 2.11B 3.01B 2.62B 13.5B 2.35B 2.34B 2.57B
Reported Nov 20, 2017 Nov 19, 2018 Feb 5, 2020 Feb 3, 2021 Feb 2, 2022 Nov 14, 2022 Nov 13, 2023 Nov 12, 2024 Nov 10, 2025 Nov 9, 2026

Sign up to see institutional holdings

Sign Up

Podcast Mentions

Sign up to see podcast mentions and sentiment

Sign Up

Emerson Electric Company — Other Events Bull 0 Bear 0 Routine

On November 13, 2026, Emerson Electric Co. (the “Company”) completed its previously announced public offering of €750,000,000 aggregate principal amount of the Company’s 4.000% Notes due 2032 (the “Notes”). The pricing of the Notes was previously announced in a Current Report on Form 8-K filed on November 12, 2026.

The Notes were issued pursuant to an indenture dated as of December 10, 1998 (the “Base Indenture”), between the Company and Computershare Trust Company, N.A., as successor to Wells Fargo Bank, National Association as successor to The Bank of New York Mellon Trust Company, N.A., as successor to The Bank of New York Mellon (formerly known as The Bank of New York), as trustee (the “Trustee”), as supplemented by a Fourth Supplemental Indenture dated as of November 13, 2026 (the “Fourth Supplemental Indenture”) between the Company and the Trustee. Pursuant to an Agency Agreement dated as of November 13, 2026 (the “Agency Agreement”) relating to the Notes, the Company appointed U.S. Bank Europe DAC, UK Branch to act as paying agent for the Notes and U.S. Bank Trust Company, National Association to act as registrar and transfer agent for the Notes.

Emerson Electric Company — Other Events Bull 1 Bear 0 Financing

On November 10, 2026, Emerson Electric Co. (the “Company”) entered into a pricing agreement (the “Pricing Agreement”) dated November 10, 2026 (incorporating the Underwriting Agreement Standard Provisions dated November 10, 2026 (the “Standard Provisions”)) with J.P. Morgan Securities plc, Citigroup Global Markets Limited, Merrill Lynch International and Goldman Sachs & Co. LLC, as representatives of the several underwriters named in Schedule I thereto (together, the “Underwriters”), in connection with the public offering of €750,000,000 aggregate principal amount of the Company’s 4.000% Notes due 2032 (the “Notes”). The Notes are being sold to the Underwriters at an issue price of 99.264% of the principal amount thereof, and the Underwriters offered the Notes to the public at a price of 99.639% of the principal amount thereof. The closing of the transaction is subject to customary closing conditions and is expected to occur on November 13, 2026. The Company is in the process of applying to list the Notes on the New York Stock Exchange.

Local educators celebrated for exceptional commitment to students

ST. LOUIS (November 05, 2026) – Emerson is recognizing more than100 local educators for the company’s 2026 Excellence in Teaching Awards. Emerson is proud to honor this year's honorees at its Excellence in Teaching Awards Ceremony on Sunday, November 22. Each educator will be awarded an engraved crystal apple keepsake and a certificate of achievement.

The long-standing annual program celebrates instructors throughout the St. Louis metropolitan area who are selected by their school administration for an exceptional dedication to their students and school community.

“Educators have a unique opportunity to directly change the lives of their students,” said Akberet Boykin Farr, vice president of human resources – corporate functions at Emerson. “When a teacher goes above and beyond in their role, their students not only learn, but also receive encouragement to explore their passions and become better versions of themselves. Congratulations to all honorees on this much-deserved recognition.”

The Excellence in Teaching Awards program is local to the St. Louis metropolitan area where Emerson is headquartered. The program began in 1989 and is sponsored annually by Emerson. A complete list of the 2026 award recipients is available below and posted on the Emerson website here.

About Emerson

Emerson (NYSE: EMR) is a global automation leader delivering solutions for the most demanding technology challenges. Headquartered in St. Louis, Missouri, Emerson is engineering the autonomous future, enabling customers to optimize operations and accelerate innovation. For more information, visit Emerson.com.

Media Contact:

Kristen Schmidt

[email protected]

Download the 2026 Excellence in Teaching Award Honorees List

Latest News

View All

[Social

Emerson Celebrates 100+ St. Louis Area Educators with Annual Excellence in Teaching Awards

Document

Local educators celebrated for exceptional commitment to students

Nov 5, 2026READ MORE](https://www.emerson.com/en/corporate/news/2026/excellence-in-teaching-awards-2026-emerson)

[Financials

Emerson Reports Fourth Quarter and Full Year 2026 Results; Provides Initial 2027 Outlook

Document

Nov 4, 2026READ MORE](https://www.emerson.com/en/corporate/news/2026/emerson-fourth-quarter-2026-results)

[Financials

Emerson Schedules Fourth Quarter and Full Year 2026 Earnings Release and Conference Call

Document

Oct 14, 2026READ MORE](https://www.emerson.com/en/corporate/news/2026/q4-2026-webcast-advisory)

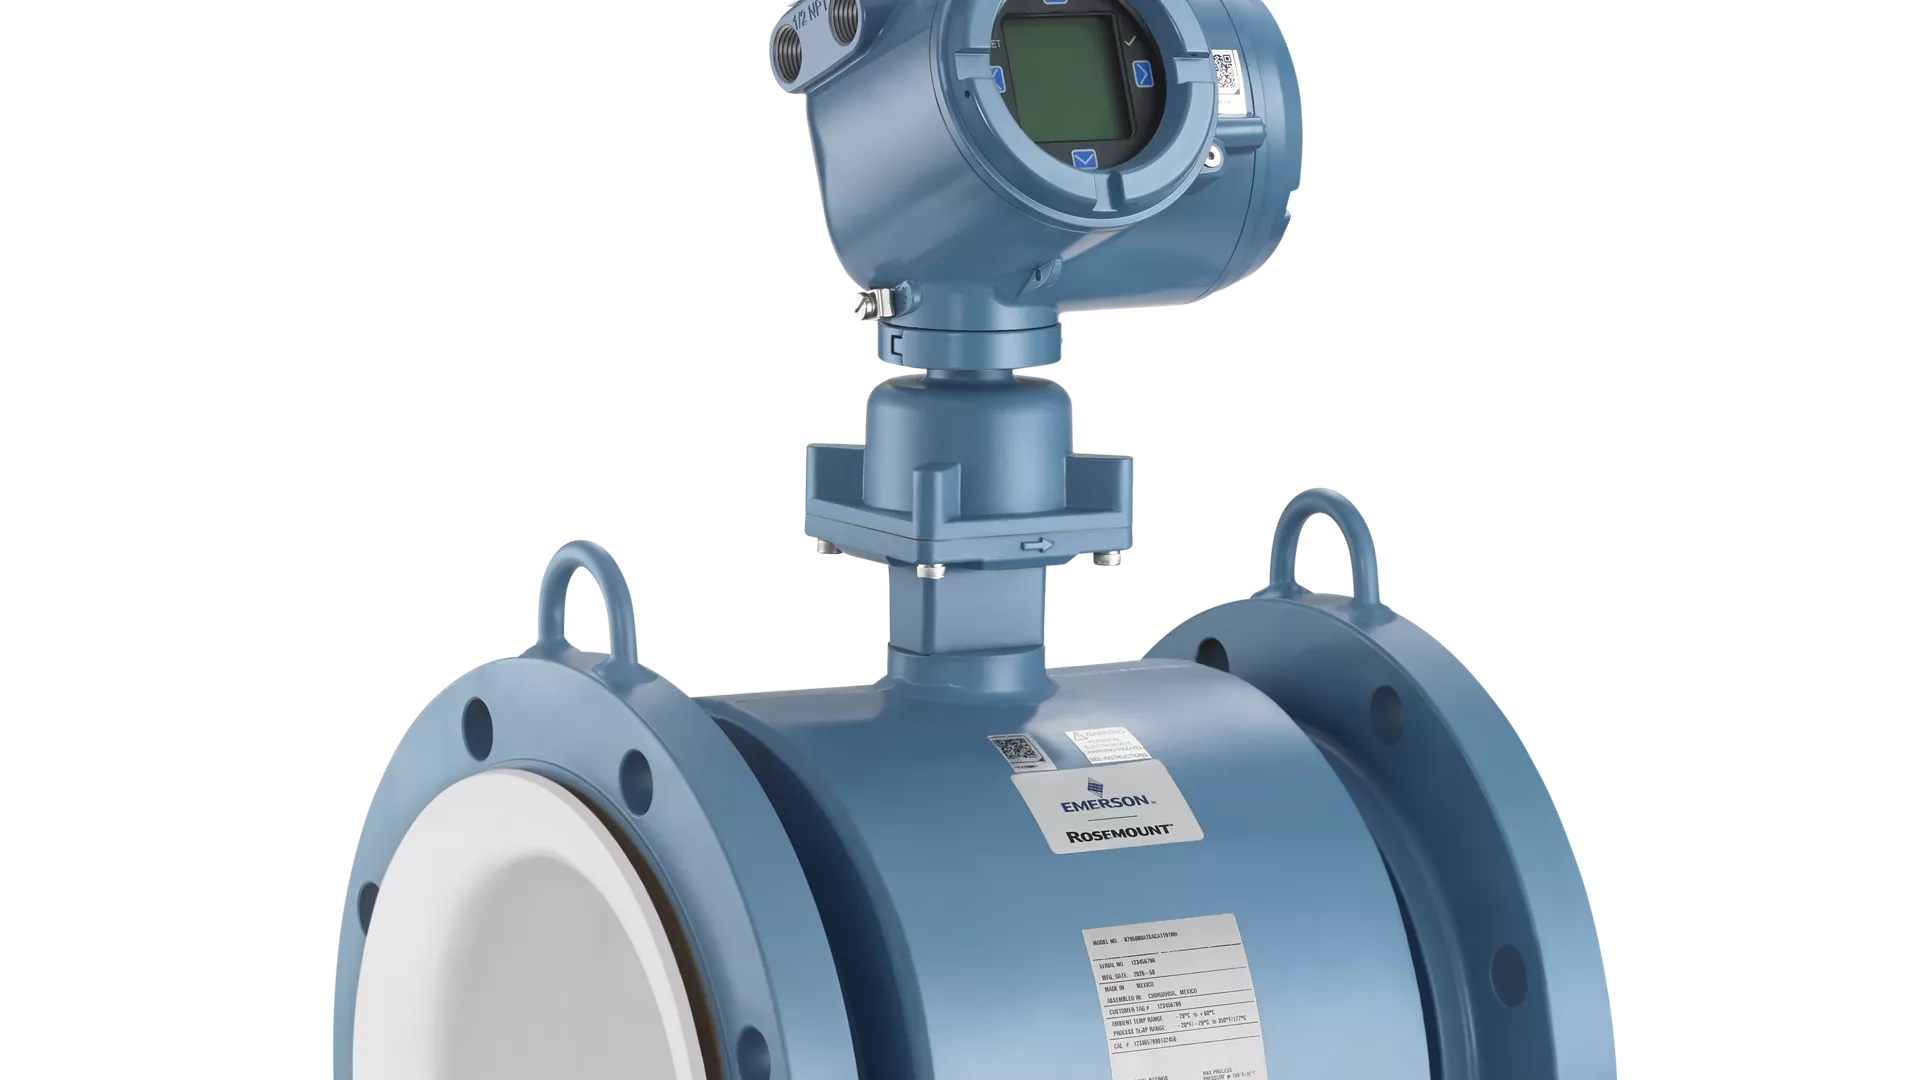
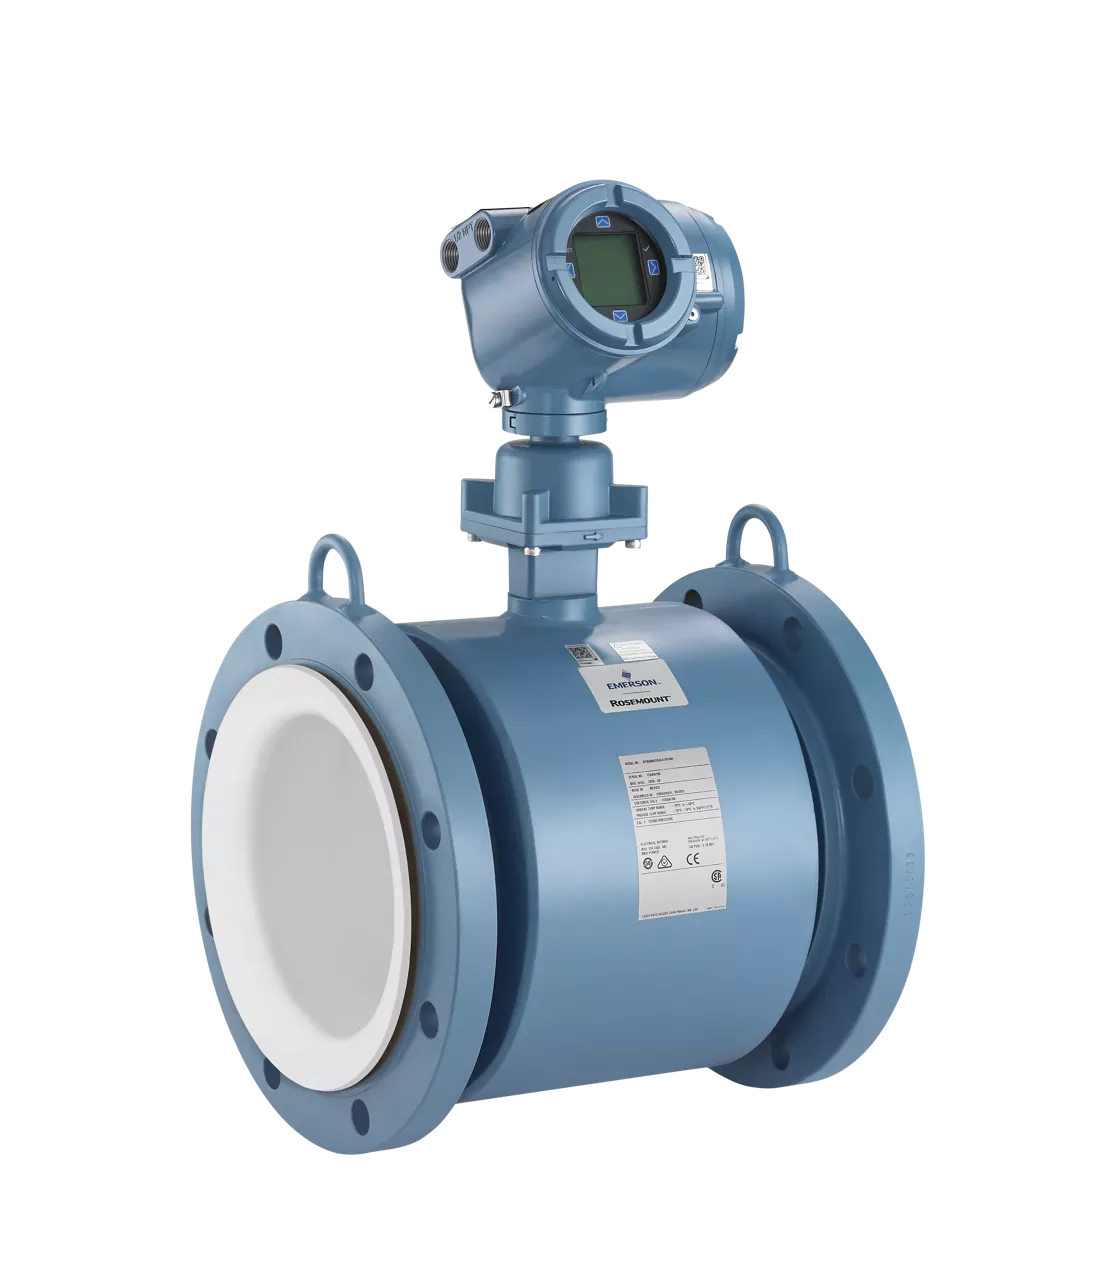
[Measurement Instrumentation

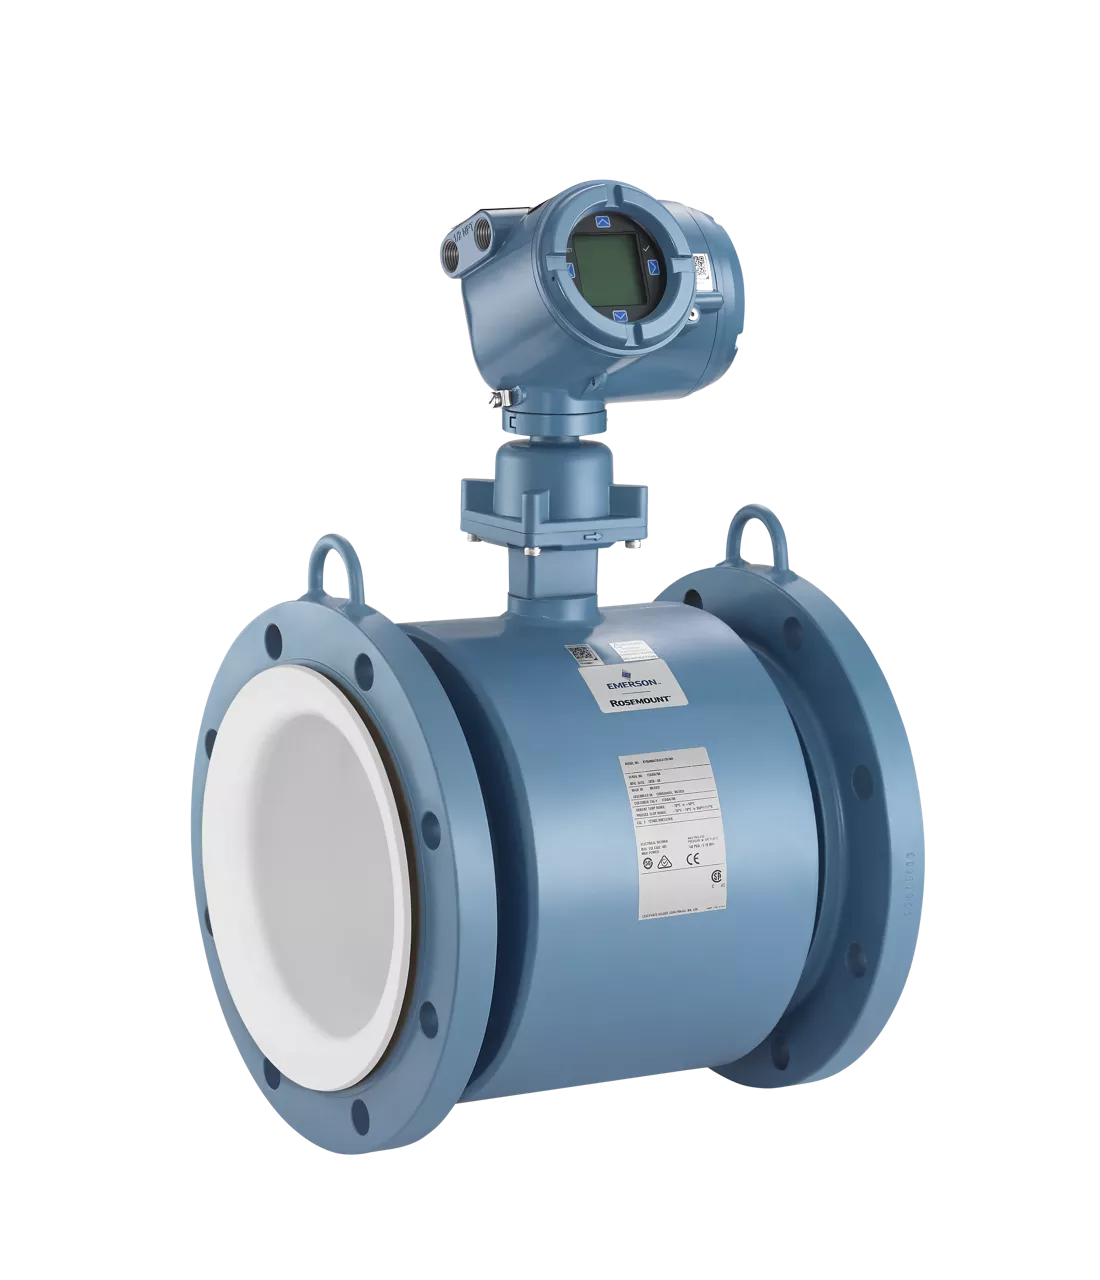
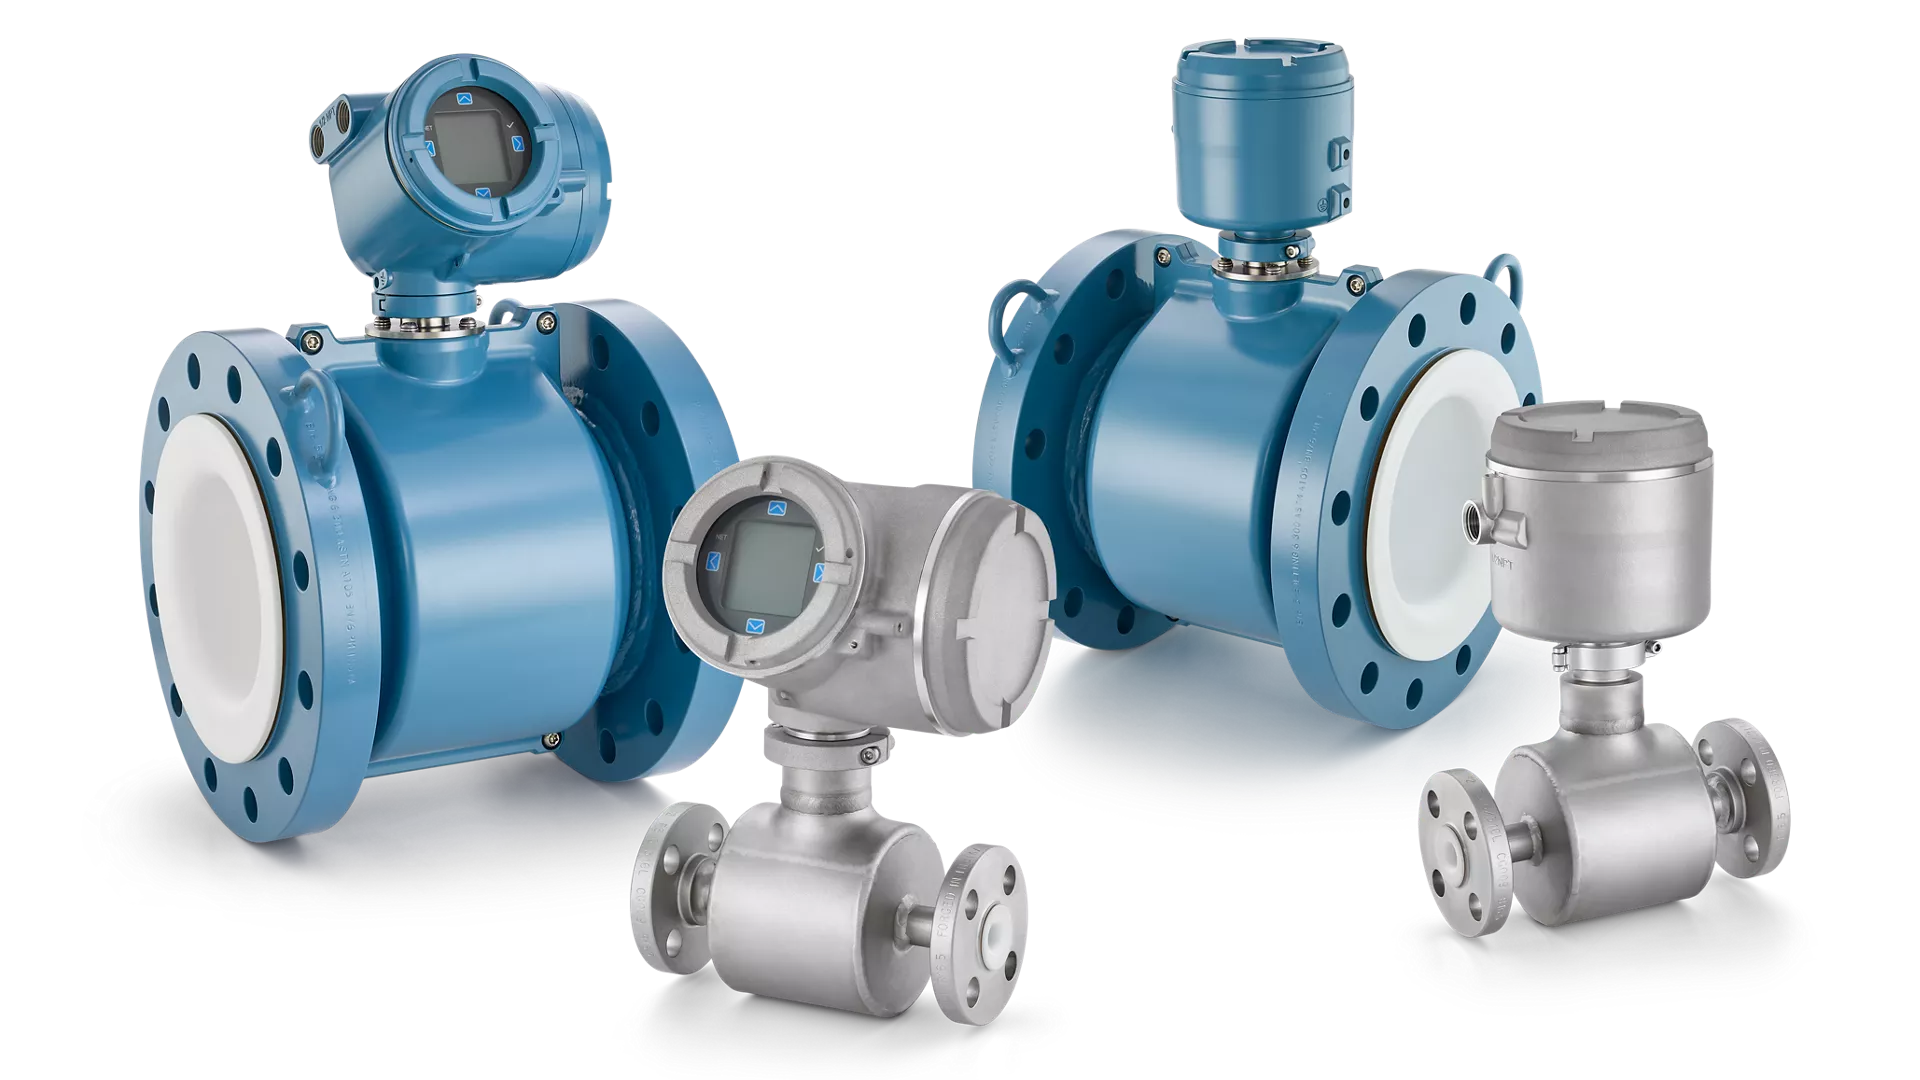
Emerson’s New Flow Measurement Solution Improves Data Center Reliability, Efficiency and Uptime

Document

Rosemount 8795 applies decades of critical infrastructure insights to data center cooling systems

Oct 8, 2026READ MORE](https://www.emerson.com/en/corporate/news/2026/emersons-new-flow-measurement-improves-data-center-reliability)

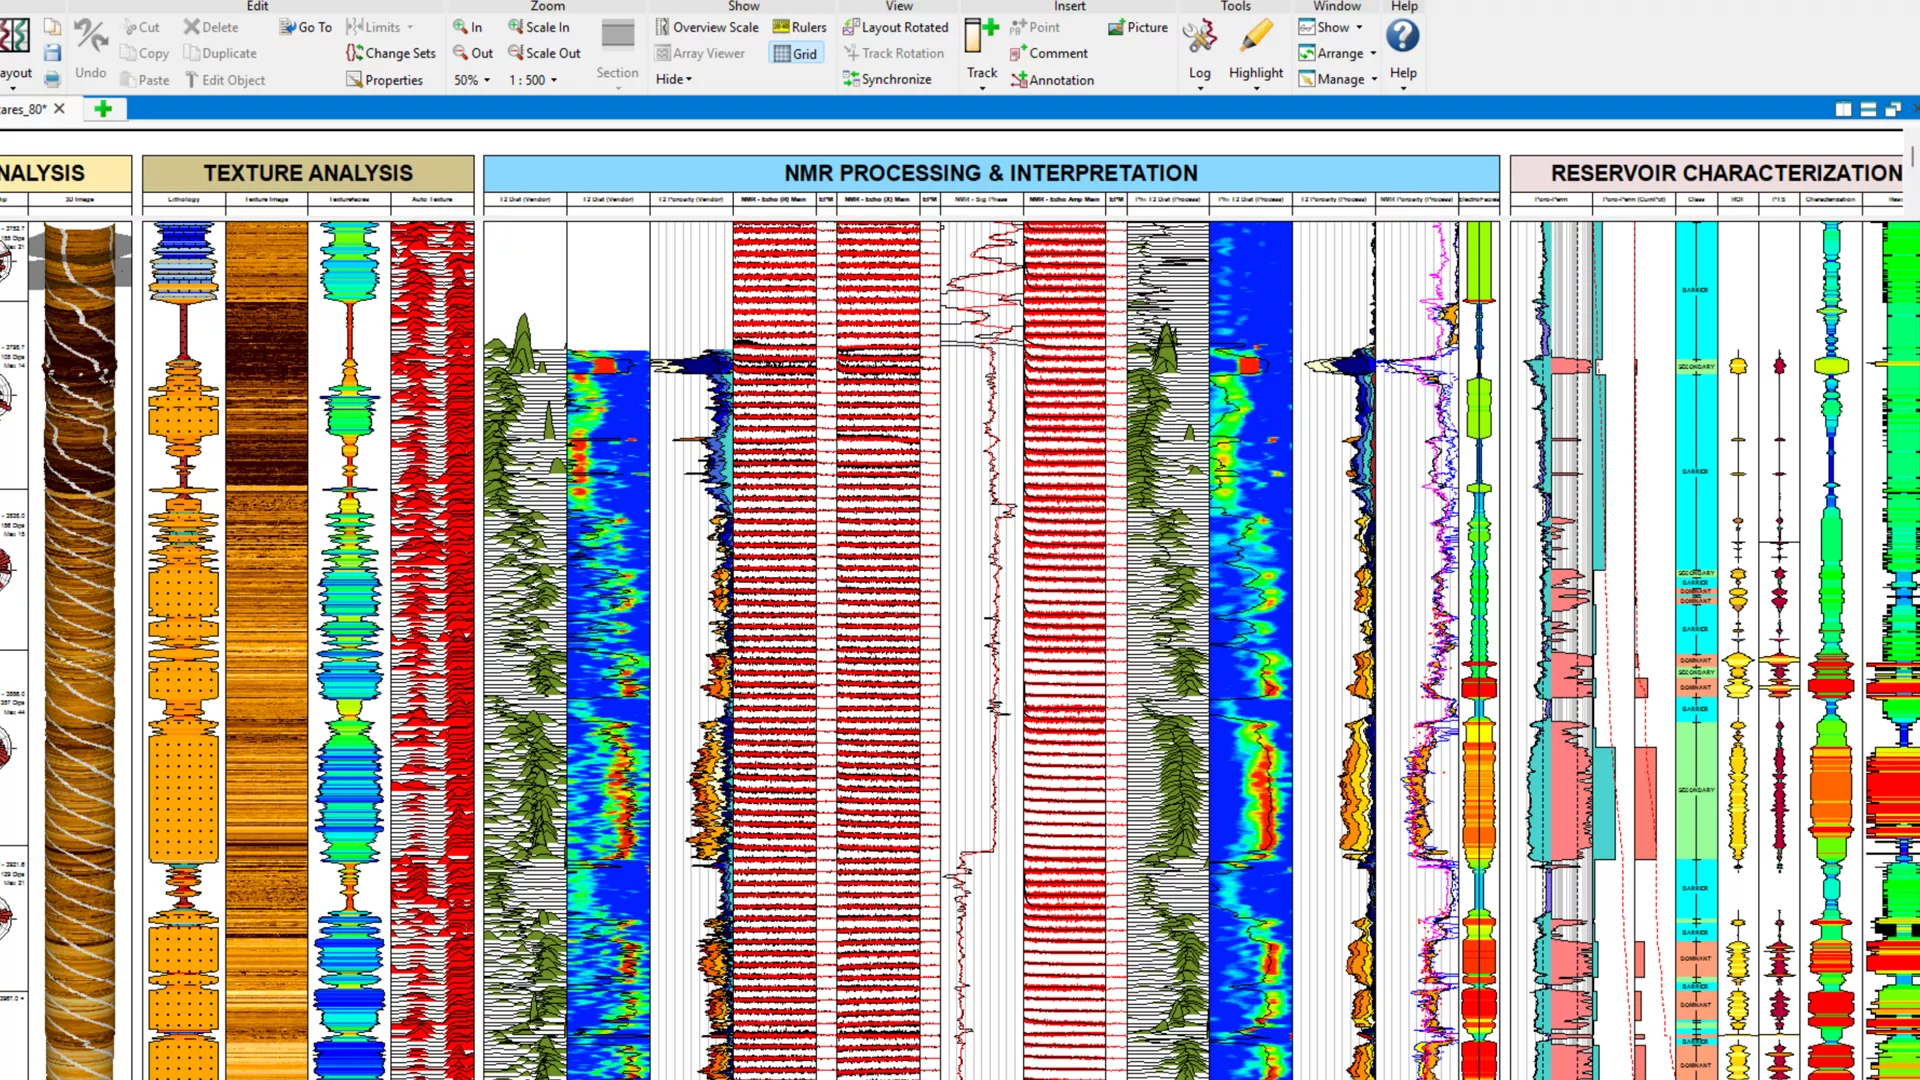
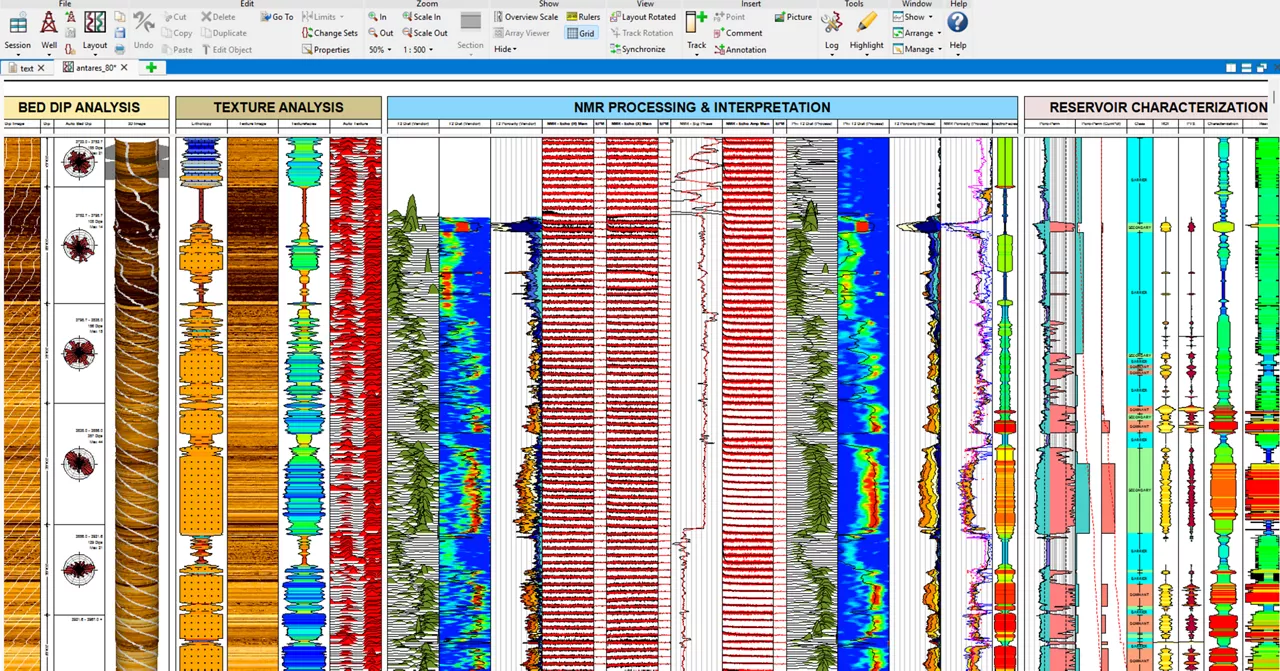
[Software

Emerson Selected by Logtek AS to Accelerate Upstream Exploration

Document

Norway-based subsurface data company chooses Aspen Geolog to automate subsurface workflows and accelerate upstream decision making

Oct 6, 2026READ MORE](https://www.emerson.com/en/corporate/news/2026/emerson-selected-by-logtek-as-to-accelerate-upstream-exploration)

Prompts

Emerson Electric Company (ticker EMR), listed in United States.

ETFs Holding Emerson Electric Company

ETF Weight in ETF Shares Market value As of
HVAC 4.18% 2,648 $ 421.429K Nov 17, 2026
CCOR 3.56% 6,630 $ 993.307K Jul 31, 2026
GEND 3.22% 1,044 $ 156.412K Jul 31, 2026
DIVS 2.67% 7,168 $ 1.026M Jun 30, 2026
TGLR 2.66% 6,717 $ 1.006M Jul 31, 2026
ABEQ 2.61% 25,585 $ 3.662M Jun 30, 2026
FBOT 2.52% 36,105 $ 5.504M Aug 31, 2026
BDVG 2.42% 2,291 $ 327.957K Jun 30, 2026
SWP 2.35% 23,108 $ 3.523M Aug 31, 2026
CSTK 2.00% 23,490 $ 3.519M Jul 31, 2026
BUSA 1.85% 38,585 $ 5.523M Jun 30, 2026
SPIN 1.29% 3,567 $ 573.039K Nov 16, 2026
CLCV 1.17% 1,341 $ 200.909K Jul 31, 2026
SAWG 1.03% 199 $ 29.814K Jul 31, 2026
ZECP 1.01% 25,018 $ 3.814M Aug 31, 2026
JEPI 0.82% 2,375,034 $ 377.987M Nov 17, 2026
GOP 0.72% 3,919 $ 629.587K Nov 17, 2026
KNOW 0.67% 326 $ 46.667K Jun 30, 2026
DFLV 0.60% 276,450 $ 46.145M Nov 12, 2026
JHDV 0.59% 499 $ 71.432K Jun 30, 2026
ESLV 0.47% 447 $ 66.97K Jul 31, 2026
IALT 0.46% 225,835 $ 36.28M Nov 16, 2026
DFUV 0.45% 426,410 $ 71.176M Nov 12, 2026
BTAL short -0.38% -7,590 $ -1.087M Jun 30, 2026
LCTU 0.35% 24,842 $ 3.991M Nov 16, 2026
ESUM 0.33% 3,991 $ 597.932K Jul 31, 2026
FLCV 0.27% 2,444 $ 372.563K Aug 31, 2026
DFVX 0.27% 9,219 $ 1.539M Nov 12, 2026
CDX 0.25% 3,846.9055 $ 612.235K Nov 17, 2026
YNOT 0.24% 3,118 $ 475.308K Aug 31, 2026
TACU 0.24% 271 $ 43.536K Nov 17, 2026
XMAG 0.21% 2,751 $ 457.56K Nov 13, 2026
ACVF 0.20% 2,062 $ 308.929K Jul 31, 2026
FLCC 0.18% 1,539 $ 234.605K Aug 31, 2026
DFSU 0.18% 25,227 $ 4.211M Nov 12, 2026
IQSZ 0.17% 2,015 $ 301.887K Jul 31, 2026
LDRX 0.17% 2,861 $ 436.131K Aug 31, 2026
AAUS 0.16% 5,222 $ 830K Nov 18, 2026
DFAU 0.15% 116,477 $ 19.442M Nov 12, 2026
DFUS 0.14% 175,234 $ 29.25M Nov 12, 2026
VOXP 0.12% 48 $ 7,191.36 Jul 31, 2026
JFLI 0.12% 369 $ 58.726K Nov 17, 2026
NTSX 0.12% 11,093 $ 1.588M Jun 30, 2026
APUE 0.11% 17,982 $ 2.741M Aug 31, 2026
NTSD 0.11% 269 $ 38.507K Jun 30, 2026
GDE 0.10% 3,312 $ 504.881K Aug 31, 2026
HCMT 0.10% 3,897 $ 583.849K Jul 31, 2026
DCOR 0.10% 270,118 $ 45.088M Nov 12, 2026
DFAC 0.09% 484,167 $ 80.817M Nov 12, 2026
VSLU 0.09% 3,304 $ 472.968K Jun 30, 2026
MSLC 0.08% 21,749 $ 3.315M Aug 31, 2026
DXUV 0.07% 27,014 $ 4.509M Nov 12, 2026
AVLC 0.06% 6,237 $ 1.002M Nov 16, 2026
AVUS 0.05% 47,167 $ 7.577M Nov 16, 2026
CSHP 0.05% 1,171 $ 188.121K Nov 16, 2026
EBI 0.04% 1,860 $ 283.538K Aug 31, 2026
GSPY 0.04% 1,715 $ 275.515K Nov 17, 2026
LGDX 0.03% 252 $ 40.484K Nov 17, 2026
INRO 0.02% 581 $ 93.338K Nov 16, 2026
GEW 0.01% 118 $ 17.988K Aug 31, 2026
NPFE 0.00% 127 $ 19.027K Jul 31, 2026
CORO 0.00% 352 $ 56.517K Nov 16, 2026
THRO 0.00% 10 $ 1,606.50 Nov 16, 2026