August 12, 2026 Download (opens in new window) DALLAS, Aug. 12, 2026 /PRNewswire/ -- Brinker International, Inc. (NYSE: EAT) today announced its financial results for the fourth quarter and fiscal year ended June 24, 2026 and provided guidance for…
August 12, 2026
DALLAS, Aug. 12, 2026 /PRNewswire/ -- Brinker International, Inc. (NYSE: EAT) today announced its financial results for the fourth quarter and fiscal year ended June 24, 2026 and provided guidance for fiscal 2027.
Fourth Quarter and Full Year Fiscal 2026 Financial Highlights
"Q4 2026 completes five consecutive years of Chili's same-store sales growth, delivering an unprecedented 71% cumulative increase over that time," said Kevin Hochman, President and CEO of Brinker International. "Our strong brand relevance, industry-leading value proposition, streamlined operations, and significant restaurant investments have created a competitive moat that positions Chili's to deliver sustainable, profitable growth."
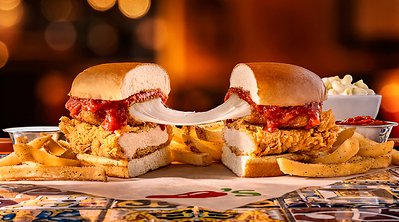
In the fourth quarter of fiscal 2026, Company sales were $1,521.2 million compared to $1,448.9 million in the fourth quarter of fiscal 2025. Company comparable restaurant sales increased 5.0% in the fourth quarter of fiscal 2026, including 5.6% for Chili's, as the brand drove positive traffic and continued outperformance against the casual dining industry. Chili's sustained strong performance reflects disciplined execution across the business. Continued investments in food quality, service, atmosphere, menu innovation, everyday value, and high-impact marketing reinforced the strength of the brand and attracted new guests, reinforcing the Company's confidence in its ability to deliver sustainable long-term growth. Chili's momentum accelerated in July with the sustained success of the Big Crispy chicken sandwich and other brand initiatives. Net income per diluted share and Net income per diluted share, excluding special items, non-GAAP, increased 30.0% and 23.3%, respectively, for the fourth quarter of fiscal 2026 compared to the fourth quarter of fiscal 2025.
During fiscal 2026, the Company utilized operational cash flow to repurchase $400.0 million of the Company's common stock. Effective August 10, 2026, our Board of Directors authorized a total of $750.0 million under our existing share repurchase program.
Financial results for the fourth quarter and full year of fiscal 2026 and fiscal 2025 were as follows (in millions, except per share amounts and percentages):
| | | | | | | | | | | | |
| --- | --- | --- | --- | --- | --- | --- | --- | --- | --- | --- | --- |
| | Fourth Quarter | | | | | | Fiscal Year | | | | |
| 2026 | | 2025 | | Variance | | 2026 | | 2025 | | Variance |
| Company sales | $ 1,521.2 | | $ 1,448.9 | | $ 72.3 | | $ 5,750.9 | | $ 5,335.3 | | $ 415.6 |
| Total revenues | $ 1,535.8 | | $ 1,461.9 | | $ 73.9 | | $ 5,807.4 | | $ 5,384.2 | | $ 423.2 |
| | | | | | | | | | | | |
| Operating income | $ 167.0 | | $ 142.7 | | $ 24.3 | | $ 619.9 | | $ 512.0 | | $ 107.9 |
| Operating income as a % of Total revenues | 10.9 % | | 9.8 % | | 1.1 % | | 10.7 % | | 9.5 % | | 1.2 % |
| Restaurant operating margin, non-GAAP(1) | $ 273.4 | | $ 258.2 | | $ 15.2 | | $ 1,026.4 | | $ 933.5 | | $ 92.9 |
| Restaurant operating margin as a % of Company sales, non-GAAP(1) | 18.0 % | | 17.8 % | | 0.2 % | | 17.8 % | | 17.5 % | | 0.3 % |
| Net income | $ 131.1 | | $ 107.0 | | $ 24.1 | | $ 487.0 | | $ 383.1 | | $ 103.9 |
| Adjusted EBITDA, non-GAAP(1) | $ 227.6 | | $ 212.4 | | $ 15.2 | | $ 847.2 | | $ 760.4 | | $ 86.8 |
| | | | | | | | | | | | |
| Net income per diluted share | $ 2.99 | | $ 2.30 | | $ 0.69 | | $ 10.87 | | $ 8.32 | | $ 2.55 |
| Net income per diluted share, excluding special items, non-GAAP(1) | $ 3.07 | | $ 2.49 | | $ 0.58 | | $ 10.74 | | $ 8.90 | | $ 1.84 |
Comparable Restaurant Sales****(2)
| | | | |
| --- | --- | --- | --- |
| | Q4:26 vs 25 | | FY:26 vs 25 |
| Brinker | 5.0 % | | 8.1 % |
| Chili's | 5.6 % | | 9.2 % |
| Maggiano's | (2.5) % | | (3.9) % |
| | |
| --- | --- |
| | |
| (1) | See Non-GAAP Information and Reconciliations section below for more details. |
| | |
| (2) | Comparable Restaurant Sales include restaurants that have been in operation for more than 18 full months. Restaurants temporarily closed for 14 days or more are excluded from comparable restaurant sales. Percentage amounts are calculated based on the comparable periods year-over-year. |
Subsequent to the end of the fiscal year, on July 16, 2026, the Company redeemed the outstanding $350.0 million 8.25% notes, and the payoff was funded with borrowings from the revolving credit facility. During the fourth quarter of fiscal 2026, the Company executed an agreement with a franchisee for the acquisition of 12 Chili's restaurants located in Alabama and Mississippi, including the real estate for six of the locations, and the transaction is expected to close on August 27, 2026.
Full Year Fiscal 2027 Guidance
We are providing the following select financial guidance for fiscal 2027 which includes a 53rd operating week in the fourth quarter. We estimate the impact of the additional operating week to be an increase of approximately 2.0% in Total revenues and $0.70 in Net income per diluted share, excluding special items, non-GAAP:
| | |
| --- | --- |
| Total revenues | $6.15 billion - $6.27 billion |
| Net income per diluted share, excluding special items, non-GAAP | $12.60 - $13.40 |
| Capital expenditures | $265.0 million - $285.0 million |
| Diluted weighted average shares | 42.0 million - 43.0 million |
The risks outlined in the Forward-Looking Statements paragraph of this press release, among other risks, could cause actual results to differ materially from forecasted results. We are unable to reliably forecast special items without unreasonable effort. As such, we do not present a reconciliation of forecasted non-GAAP measures to the corresponding GAAP measures.
Fourth Quarter of Fiscal 2026 Operating Performance
Segment Performance
The table below presents selected financial information (in millions, except as noted) related to our segments' operational performance for the thirteen week periods ended June 24, 2026 and June 25, 2025:
| | | | | | | | | | | | |
| --- | --- | --- | --- | --- | --- | --- | --- | --- | --- | --- | --- |
| | Chili's | | | | | | Maggiano's | | | | |
| | Fourth Quarter | | | | Variance | | Fourth Quarter | | | | Variance |
| | 2026 | | 2025 | | | 2026 | | 2025 | |
| Company sales | $ 1,408.6 | | $ 1,326.8 | | $ 81.8 | | $ 112.6 | | $ 122.1 | | $ (9.5) |
| Franchise revenues | 14.4 | | 12.8 | | 1.6 | | 0.2 | | 0.2 | | — |
| Total revenues | $ 1,423.0 | | $ 1,339.6 | | $ 83.4 | | $ 112.8 | | $ 122.3 | | $ (9.5) |
| | | | | | | | | | | | |
| Company restaurant expenses(1) | $ 1,146.7 | | $ 1,085.4 | | $ 61.3 | | $ 101.0 | | $ 105.8 | | $ (4.8) |
| Company restaurant expenses as a % of Company sales | 81.4 % | | 81.8 % | | (0.4) % | | 89.7 % | | 86.7 % | | 3.0 % |
| | | | | | | | | | | | |
| Operating income - GAAP | $ 214.2 | | $ 177.3 | | $ 36.9 | | $ 1.0 | | $ 13.4 | | $ (12.4) |
| Operating income (loss) as a % of Total revenues | 15.1 % | | 13.2 % | | 1.9 % | | 0.9 % | | 11.0 % | | (10.1) % |
| | | | | | | | | | | | |
| Restaurant operating margin, non- GAAP(2) | $ 261.9 | | $ 241.4 | | $ 20.5 | | $ 11.6 | | $ 16.3 | | $ (4.7) |
| Restaurant operating margin as a % of Company sales, non-GAAP(2) | 18.6 % | | 18.2 % | | 0.4 % | | 10.3 % | | 13.3 % | | (3.0) % |
| | |
| --- | --- |
| | |
| (1) | Company restaurant expenses includes Food and beverage costs, Restaurant labor and Restaurant expenses, and excludes Depreciation and amortization, General and administrative and Other (gains) and charges. |
| | |
| (2) | See Non-GAAP Information and Reconciliations section below for more details. |
Chili's
-
Chili's Company sales increased primarily due to favorable comparable restaurant sales driven by menu pricing and higher traffic.
-
Chili's Company restaurant expenses, as a percentage of Company sales, decreased primarily due to sales leverage and lower manager bonus, partially offset by unfavorable Food and beverage costs, higher advertising, hourly labor, delivery fees and to-go supplies, manager salaries, and other restaurant expenses. Food and beverage costs were negatively impacted by higher beef costs and a temporary increase in produce costs due to a late freeze in Florida.
-
Chili's franchisees generated sales of approximately $301.2 million for the fourth quarter of fiscal 2026 compared to $262.3 million for the fourth quarter of fiscal 2025.
Maggiano's
-
Maggiano's Company sales decreased primarily due to lower traffic and restaurant closures, partially offset by menu pricing.
-
Maggiano's Company restaurant expenses, as a percentage of Company sales, increased primarily due to sales deleverage, unfavorable Food and beverage costs, higher pre-opening costs, partially offset by lower worker's compensation and general liability insurance, repairs and maintenance, and advertising.
Corporate
- On a GAAP basis, the effective income tax rate was 17.3% in the fourth quarter of fiscal 2026. The effective income tax rate is lower than the statutory rate of 21.0% primarily due to leverage of the FICA tip credit. Excluding the impact of special items, the effective income tax rate was an expense of 17.6% in the fourth quarter of fiscal 2026.
Webcast Information
Investors and interested parties are invited to listen to today's conference call, as management will provide further details of the quarter and business updates. A real-time audio webcast of the presentation can be accessed via the Events and Presentations section of the Brinker Investor Relations page. The call will be broadcast live today, August 12, 2026 at 9 a.m. CDT:
https://investors.brinker.com/events-and-presentations/
For those who are unable to listen to the live broadcast, a replay of the call will be available shortly thereafter.
Additional financial information, including statements of income which detail operations excluding special items, and comparable restaurant sales trends by brand, is also available on Brinker's website under the Financial Information section of the Investor tab.
Forward Calendar
-
SEC Form 10-K for the year of fiscal 2026 filing on or before August 24, 2026
-
Earnings release call for the first quarter of fiscal 2027 on October 28, 2026
Non-GAAP Measures
Brinker management uses certain non-GAAP measures in analyzing operating performance and believes that the presentation of these measures in this release provides investors with information that is beneficial to gaining an understanding of the Company's financial results. Non-GAAP disclosures should not be viewed as a substitute for financial results determined in accordance with GAAP, nor are they necessarily comparable to non-GAAP performance measures that may be presented by other companies. Reconciliations of these non-GAAP measures are included in the tables below.
About Brinker
Brinker International, Inc. is one of the world's leading casual dining restaurant companies and home of Chili's® Grill & Bar, and Maggiano's Little Italy.® Founded in 1975 in Dallas, Texas, we've ventured far from home, but stayed true to our roots. Brinker owns, operates or franchises more than 1,600 restaurants in the United States, 28 other countries and two U.S. territories. Our passion is making everyone feel special, and we hope you feel that passion each time you visit one of our restaurants or invite us into your home through takeout or delivery. Learn more about Brinker and its brands at brinker.com
.
Forward-Looking Statements
The statements and tables contained in this release that are not historical facts are forward-looking statements within the meaning of Section 27A of the Securities Act of 1933 and Section 21E of the Securities Exchange Act of 1934. We intend all forward-looking statements to be covered by the safe harbor provisions of the Private Securities Litigation Reform Act of 1995. All forward-looking statements are made only based on our current plans and expectations as of the date such statements are made, and we undertake no obligation to update forward-looking statements to reflect events or circumstances arising after the date such statements are made. Forward-looking statements are neither predictions nor guarantees of future events or performance and are subject to risks and uncertainties which could cause actual results to differ materially from our historical results or from those projected in forward-looking statements. Such risks and uncertainties include, among other things, the impact of general economic conditions, including inflation, on economic activity and on our operations; disruptions on our business including consumer demand, costs, product mix, our strategic initiatives, operations, technology and assets, and our financial performance; the impact of current and potential tariffs and trade barriers; the impact of competition, including competitors employing our same strategies or discounting their offerings; changes in consumer preferences, including shifts in their brand preferences; food-borne illness outbreaks; consumer perception of food safety; reduced consumer discretionary spending; governmental regulations; the effectiveness of the Company's business strategy plan; loss of key management personnel; failure to hire and retain high-quality restaurant management and team members; increasing regulation surrounding wage inflation and competitive labor markets; the impact of social media, including the potential governmental ban of platforms used by the Company in its marketing initiatives; reputational damage or unfavorable publicity for our brands, which may result from actions of franchisees not within our control; reliance on technology and third party delivery providers; failure to protect the security of data of our guests and team members; product availability and supply chain disruptions; regional business and economic conditions; volatility in consumer, commodity, transportation, labor, currency and capital markets; litigation; franchisee success; technology failures; failure to protect our intellectual property; outsourcing; impairment of goodwill or assets; failure to maintain effective internal control over financial reporting; downgrades in credit ratings; changes in estimates regarding our assets; actions of activist shareholders; our pursuit of or failure to comply with new environmental and sustainability requirements; our pursuit of or failure to achieve any goals, targets or objectives with respect to sustainability matters; adverse weather conditions; terrorist acts; cybersecurity, artificial intelligence and phishing threats; health epidemics or pandemics; tax reform; inadequate insurance coverage; and limitations imposed by our credit agreements as well as the risks and uncertainties described in "Risk Factors" in our Annual Report on Form 10-K and future filings with the Securities and Exchange Commission.
| | | | | | | | |
| --- | --- | --- | --- | --- | --- | --- | --- |
| BRINKER INTERNATIONAL, INC. | | | | | | | |
| Consolidated Statements of Comprehensive Income (Unaudited) | | | | | | | |
| (In millions, except per share amounts) | | | | | | | |
| | | | | | | | |
| | Thirteen Week Periods Ended | | | | Fifty-Two Week Periods Ended | | |
| | June 24, 2026 | | June 25, 2025 | | June 24, 2026 | | June 25, 2025 |
| Revenues | | | | | | | |
| Company sales | $ 1,521.2 | | $ 1,448.9 | | $ 5,750.9 | | $ 5,335.3 |
| Franchise revenues | 14.6 | | 13.0 | | 56.5 | | 48.9 |
| Total revenues | 1,535.8 | | 1,461.9 | | 5,807.4 | | 5,384.2 |
| Operating costs and expenses | | | | | | | |
| Food and beverage costs | 399.4 | | 369.3 | | 1,487.6 | | 1,350.6 |
| Restaurant labor | 476.4 | | 466.7 | | 1,810.2 | | 1,717.3 |
| Restaurant expenses | 372.0 | | 354.7 | | 1,426.7 | | 1,333.9 |
| Depreciation and amortization | 55.5 | | 57.9 | | 218.7 | | 206.6 |
| General and administrative | 60.4 | | 58.8 | | 235.7 | | 222.0 |
| Other (gains) and charges(1) | 5.1 | | 11.8 | | 8.6 | | 41.8 |
| Total operating costs and expenses | 1,368.8 | | 1,319.2 | | 5,187.5 | | 4,872.2 |
| Operating income | 167.0 | | 142.7 | | 619.9 | | 512.0 |
| Interest expenses | 9.2 | | 10.9 | | 40.5 | | 53.1 |
| Other income, net | (0.7) | | (0.4) | | (1.5) | | (1.1) |
| Income before income taxes | 158.5 | | 132.2 | | 580.9 | | 460.0 |
| Provision for income taxes | 27.4 | | 25.2 | | 93.9 | | 76.9 |
| Net income | $ 131.1 | | $ 107.0 | | $ 487.0 | | $ 383.1 |
| | | | | | | | |
| Basic net income per share | $ 3.08 | | $ 2.41 | | $ 11.16 | | $ 8.60 |
| | | | | | | | |
| Diluted net income per share | $ 2.99 | | $ 2.30 | | $ 10.87 | | $ 8.32 |
| | | | | | | | |
| Basic weighted average shares outstanding | 42.6 | | 44.5 | | 43.6 | | 44.6 |
| | | | | | | | |
| Diluted weighted average shares outstanding | 43.9 | | 46.5 | | 44.8 | | 46.1 |
| | | | | | | | |
| Other comprehensive income (loss) | | | | | | | |
| Foreign currency translation adjustment | $ (0.2) | | $ 0.2 | | $ (0.3) | | $ (0.1) |
| Comprehensive income | $ 130.9 | | $ 107.2 | | $ 486.7 | | $ 383.0 |
| | |
| --- | --- |
| | |
| (1) | Other (gains) and charges included in the Consolidated Statements of Comprehensive Income (Unaudited): |
| | |
| | | | | | | | |
| --- | --- | --- | --- | --- | --- | --- | --- |
| | Thirteen Week Periods Ended | | | | Fifty-Two Week Periods Ended | | |
| | June 24, 2026 | | June 25, 2025 | | June 24, 2026 | | June 25, 2025 |
| Restaurant-level impairment charges | $ 5.7 | | $ 4.6 | | $ 5.7 | | $ 4.6 |
| Litigation & claims, net | 1.0 | | 11.3 | | 3.4 | | 22.4 |

 View original content to download multimedia:

 View original content to download multimedia:

 View original content to download multimedia:


 View original content to download multimedia:


 View original content to download multimedia:

 View original content to download multimedia:

 View original content to download multimedia:


 View original content to download multimedia:


 View original content to download multimedia:

 View original content to download multimedia:

 View original content to download multimedia:

 View original content to download multimedia:


 View original content to download multimedia: