October 28, 2026
CORAL GABLES, Fla.--(BUSINESS WIRE)-- Del Monte Corporation (NYSE: DMC) ("Del Monte" or the "Company") today reported financial results for the third quarter ended September 25, 2026. The quarter provided further evidence of Del Monte's transformation into a more diversified food platform. Six months after the acquisition of Del Monte Foods, the Company is benefiting from a stronger earnings mix, improved profitability, and greater balance across its portfolio. The acquisition has significantly expanded the scale of Prepared Foods and strengthened Del Monte's presence across fresh, refrigerated, shelf-stable, and prepared food categories.
Third Quarter 2026 Financial Highlights:
Third-quarter results reflected the growing contribution of Del Monte Foods and growth in gross profit, operating earnings, and margin performance, despite ongoing foreign currency, weather-related and cost pressures across portions of the Company's fresh and agricultural operations. Net sales increased 7.2%, gross profit increased 27.0% and gross margin expanded 150 basis points from the prior-year quarter, reflecting the contribution of Prepared Foods and the benefits of a more diversified earnings mix. The quarter also highlighted the Company's ability to deliver profitable growth while continuing to manage volume, foreign currency, and cost pressures across portions of its global fresh business. The Company completed the divestiture of its Mann Packing Inc. business operations (“Mann Packing”) during the fourth quarter of 2025. Accordingly, certain financial highlights are also presented on an adjusted basis to exclude the prior-year contribution from Mann Packing and facilitate comparison of the Company’s ongoing operations.
- Net sales of $1.10 billion, up 7.2%; Adjusted net sales up 14.2%.
- Gross profit of $102.6 million, up 27.0%, with gross margin expanding 150 basis points to 9.4%.
- Operating income of $29.1 million; Adjusted operating income (1) of $35.4 million.
- Net income attributable to Del Monte Corporation of $18.3 million; Adjusted net income attributable to Del Monte Corporation (1) of $23.6 million.
- Diluted EPS of $0.39 and Adjusted diluted EPS (1) of $0.50.
- EBITDA of $54.6 million; Adjusted EBITDA (1) of $60.9 million, up 5.0%.
- Net cash provided by operating activities for the first nine months of 2026 was $53.1 million.
- Quarterly cash dividend of $0.30 per share, payable December 4, 2026, to shareholders of record as of November 11, 2026.
Strategic Highlights:
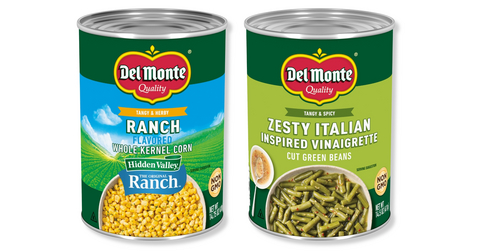
- Advanced the integration of Del Monte Foods, establishing the business as a core part of the Company's expanded platform, deepening commercial and operational collaboration across fresh, refrigerated, shelf-stable, and prepared food categories, and supporting innovation across the portfolio.
- Strengthened the Company's earnings mix through Prepared Foods, which contributed $261.2 million in net sales and $45.8 million in gross profit and delivered a 17.5% gross margin, the highest among the Company's reportable segments.
- Advanced the reshaping of the fresh and agricultural portfolio through the previously announced closure of four banana farms in Costa Rica. The actions reflected the Company's efforts during the quarter to improve operating efficiency and concentrate resources on higher-return opportunities.
- Advanced the Company's unified brand and innovation strategy by showcasing the reunited Del Monte brand and six new product innovations at the 2026 IFPA Global Produce & Floral Show, building on the Company's long-standing sourcing relationships, operational expertise and trusted global brand while reinforcing the breadth of the expanded portfolio and the Company's presence across fresh, refrigerated, shelf-stable and prepared food categories.
Mohammad Abu-Ghazaleh, Chairman and Chief Executive Officer, said, “Our third-quarter results provide clear evidence of the strategic and financial value of our expanded Del Monte portfolio. Just six months into the integration of Del Monte Foods, the Prepared Foods segment is already adding scale, attractive margins and greater balance to our earnings profile. This is supporting strong growth in sales, gross profit and operating income, as well as Adjusted EBITDA, particularly as our core Fresh business navigates volume, currency and cost pressures and an increasingly complex global operating environment shaped by weather volatility and geopolitical uncertainty. These early results reinforce our confidence in our strategy and, more importantly, in the long-term potential of the Del Monte we are building. Our focus remains on deepening commercial and operational collaboration, optimizing our fresh and agricultural operations, and leveraging the strength of our reunited brand to accelerate innovation across categories. We are approaching these opportunities with discipline and a clear ambition to build a more resilient, competitive and innovative Del Monte that delivers sustainable long-term shareholder value.”
Third Quarter 2026 Business Segment Performance
Following the acquisition of Del Monte Foods and the first-quarter 2026 segment realignment, the Company reports its results under four segments: Fresh and Value-Added Products, Bananas, Prepared Foods, and Other Products and Services. Prior-period amounts have been recast to conform to the current presentation.
Third-quarter segment performance reflected the growing contribution of Prepared Foods, which added scale, profitability and greater balance to the Company's earnings profile six months after the acquisition. Across the legacy fresh businesses, favorable pricing partially offset volume, cost, and foreign currency headwinds. The Company also continued portfolio optimization actions focused on improving operating performance and allocating resources toward higher-return opportunities.
Fresh and Value-Added Products generated net sales of $461.3 million and gross profit of $50.5 million. The segment continued to demonstrate the resilience of Del Monte’s core fresh platform and remained a significant component of the Company's integrated food platform, despite a challenging operating environment. Year-over-year results reflected the strategic divestiture of Mann Packing during the fourth quarter of 2025 and lower avocado and fresh-cut fruit volumes. These factors were partially offset by favorable pricing across portions of the portfolio. Gross profit reflected lower sales volume, higher production costs for pineapples and fresh-cut fruit, increased distribution expenses and adverse foreign currency movements. These pressures were partially offset by the absence of the negative gross profit associated with Mann Packing in the prior-year period. The segment's results reflected Del Monte’s sourcing expertise, integrated supply chain and leadership positions across global fresh food categories.
Bananas generated net sales of $313.3 million and reported a gross loss of $2.7 million. Lower banana volume, including the effects of increased competition and supply constraints in the Middle East, more than offset higher per-unit selling prices in North America. Gross profit was negatively impacted by lower net sales, higher ocean freight costs, adverse foreign currency movements related to the Costa Rican colón and approximately $6.1 million of incremental production costs in Costa Rica associated with Black Sigatoka prevention efforts following unusually heavy rainfall linked to El Niño weather conditions. During the quarter, the Company continued implementing actions related to four banana farms in Costa Rica as part of its broader effort to optimize its agricultural footprint, improve operating efficiency and enhance the long-term economics of the business. While these weather-related costs affected near-term profitability, the segment remains an important component of Del Monte's vertically integrated supply chain and global sourcing platform.
Prepared Foods generated net sales of $261.2 million and gross profit of $45.8 million, representing a 17.5% gross margin, the highest among the Company’s reportable segments. The acquisition of Del Monte Foods in March 2026 drove the segment’s year-over-year growth and expanded the Del Monte portfolio. Gross profit growth was driven by the contribution from Del Monte Foods and the resulting increase in net sales, partially offset by higher distribution costs. Just six months after the acquisition, Prepared Foods contributed meaningful scale, profitability, and earnings diversification, adding to the balance and resilience of the Company's overall earnings profile.
Other Products and Services generated net sales of $59.5 million and gross profit of $9.0 million. Higher commercial cargo activity supported net sales growth during the quarter. Gross profit increased primarily as a result of higher net sales, partially offset by higher fuel costs. The segment provided complementary earnings streams and supported the Company’s integrated operating platform.
Cash Flow and Capital Allocation
The Company maintained a disciplined approach to capital allocation, balancing investment in integration, operating performance and strategic inventory requirements with the return of capital through its quarterly dividend. During the period, the Company deployed capital to advance integration and fund strategic inventory and working capital requirements while maintaining financial flexibility.
Net cash provided by operating activities for the first nine months of 2026 was $53.1 million. Cash flow reflected the contribution of the expanded portfolio, including Del Monte Foods, as well as investments in inventory and working capital to support growth across the business and maintain liquidity for integration and operating requirements.
Long-term debt was $482.5 million as of September 25, 2026, compared with $173.0 million at the end of 2025, primarily reflecting the financing of the Del Monte Foods acquisition and inventory buildup.
Quarterly cash dividend of $0.30 per share was declared by the Board of Directors on October 27, 2026. The dividend is payable on December 4, 2026, to shareholders of record as of November 11, 2026.
Conference Call and Webcast
Del Monte will host a conference call and simultaneous webcast today at 11:00 a.m. Eastern Time to discuss its third-quarter 2026 financial results and provide an update on the Company’s strategic and operating progress. The live webcast will be available through the Investor Relations section of the Company’s website. A replay will be available on the Company’s website approximately two hours after the call concludes.
| Third Quarter 2026 Business Segment Performance and Selected Financial Data(As reported in business segment data) | ||||||||||||||||||||||||||||||
| Del Monte Corporation and Subsidiaries | ||||||||||||||||||||||||||||||
| Business Segment Data | ||||||||||||||||||||||||||||||
| (U.S. dollars in millions) - (Unaudited) | ||||||||||||||||||||||||||||||
| Quarter ended | ||||||||||||||||||||||||||||||
| September 25, 2026 | September 26, 2025 | |||||||||||||||||||||||||||||
| Segment Data: | Net Sales | Gross Profit | Gross Margin | Net Sales | Gross Profit | Gross Margin | ||||||||||||||||||||||||
| Fresh and value-added products | $ | 461.3 | 42 | % | $ | 50.5 | 49 | % | 10.9 | % | $ | 549.0 | 54 | % | $ | 64.3 | 79 | % | 11.7 | % | ||||||||||
| Banana | 313.3 | 29 | % | (2.7 | ) | (3 | )% | (0.9 | )% | 358.0 | 35 | % | 4.6 | 6 | % | 1.3 | % | |||||||||||||
| Prepared foods | 261.2 | 24 | % | 45.8 | 45 | % | 17.5 | % | 61.5 | 6 | % | 4.0 | 5 | % | 6.5 | % | ||||||||||||||
| Other products and services | 59.5 | 5 | % | 9.0 | 9 | % | 15.1 | % | 53.4 | 5 | % | 7.9 | 10 | % | 14.8 | % | ||||||||||||||
| $ | 1,095.3 | 100 | % | $ | 102.6 | 100 | % | 9.4 | % | $ | 1,021.9 | 100 | % | $ | 80.8 | 100 | % | 7.9 | % | |||||||||||
| Nine months ended | ||||||||||||||||||||||||||||||
| September 25, 2026 | September 26, 2025 | |||||||||||||||||||||||||||||
| Net Sales | Gross Profit | Gross Margin | Net Sales | Gross Profit | Gross Margin | |||||||||||||||||||||||||
| Fresh and value-added products | $ | 1,579.5 | 47 | % | $ | 173.2 | 55 | % | 11.0 | % | $ | 1,811.1 | 55 | % | $ | 198.4 | 68 | % | 11.0 | % | ||||||||||
| Banana | 1,031.6 | 31 | % | 22.2 | 7 | % | 2.2 | % | 1,131.7 | 34 | % | 51.4 | 18 | % | 4.5 | % | ||||||||||||||
| Prepared foods | 579.8 | 17 | % | 99.3 | 32 | % | 17.1 | % | 205.1 | 6 | % | 24.0 | 8 | % | 11.7 | % | ||||||||||||||
| Other products and services | 167.6 | 5 | % | 18.2 | 6 | % | 10.9 | % | 154.9 | 5 | % | 19.3 | 6 | % | 12.5 | % | ||||||||||||||
| $ | 3,358.5 | 100 | % | $ | 312.9 | 100 | % | 9.3 | % | $ | 3,302.8 | 100 | % | $ | 293.1 | 100 | % | 8.9 | % | |||||||||||
| (1) Non-GAAP financial measure. Reconciliations and other information required by Regulation G can be found below under "Non-GAAP Measures." | ||||||||||||||||||||||||||||||
| (2) "Del Monte Corporation net income" as referenced throughout this release is defined as Net income (loss) attributable to Del Monte Corporation. |
| Del Monte Corporation and Subsidiaries | ||||||||||||||
| Condensed Consolidated Statements of Operations | ||||||||||||||
| (U.S. dollars in millions, except share and per share data) - (Unaudited) | ||||||||||||||
| Quarter ended | Nine months ended | |||||||||||||
| Statement of Operations: | September 25, 2026 | September 26, 2025 | September 25, 2026 | September 26, 2025 | ||||||||||
| Net sales | $ | 1,095.3 | $ | 1,021.9 | $ | 3,358.5 | $ | 3,302.8 | ||||||
| Cost of products sold | 992.7 | 941.7 | 3,043.9 | 3,010.2 | ||||||||||
| Other product-related charges (credits) | — | (0.6 | ) | 1.7 | (0.5 | ) | ||||||||
| Gross profit | 102.6 | 80.8 | 312.9 | 293.1 | ||||||||||
| Selling, general and administrative expenses | 67.2 | 52.1 | 190.9 | 151.5 | ||||||||||
| Gain on disposal of property, plant and equipment, net | 2.5 | 5.0 | 4.3 | 5.9 | ||||||||||
| Asset impairment and other charges, net | 8.8 | 55.5 | 43.6 | 56.1 | ||||||||||
| Operating income (loss) | 29.1 | (21.8 | ) | 82.7 | 91.4 | |||||||||
| Interest expense, net | 6.3 | 1.8 | 14.6 | 8.1 | ||||||||||
| Income from equity method investments | 2.4 | 3.1 | 10.9 | 10.9 | ||||||||||
| Other (income) expense, net | (0.6 | ) | 3.4 | 7.2 | 7.8 | |||||||||
| Income (loss) before income taxes | 25.8 | (23.9 | ) | 71.8 | 86.4 | |||||||||
| Income tax provision | 7.1 | 4.2 | 20.9 | 25.2 | ||||||||||
| Net income (loss) | 18.7 | (28.1 | ) | 50.9 | 61.2 | |||||||||
| Less: Net income attributable to noncontrolling interests | 0.4 | 1.0 | 1.5 | 2.4 | ||||||||||
| Net income (loss) attributable to Del Monte Corporation | $ | 18.3 | $ | (29.1 | ) | $ | 49.4 | $ | 58.8 | |||||
| Earnings (loss) per share(1): | ||||||||||||||
| Basic | $ | 0.39 | $ | (0.61 | ) | $ | 1.04 | $ | 1.23 | |||||
| Diluted | $ | 0.39 | $ | (0.61 | ) | $ | 1.04 | $ | 1.22 | |||||
| Dividends declared per ordinary share | $ | 0.30 | $ | 0.30 | $ | 0.90 | $ | 0.90 | ||||||
| Weighted average number of ordinary shares: | ||||||||||||||
| Basic | 47,146,531 | 47,917,663 | 47,331,071 | 47,942,661 | ||||||||||
| Diluted | 47,349,407 | 47,917,663 | 47,608,082 | 48,214,204 | ||||||||||
| (1) Earnings (loss) per share ("EPS") is calculated based on Net income (loss) attributable to Del Monte Corporation. |
| Del Monte Corporation and Subsidiaries | |||||||
| Condensed Consolidated Balance Sheets | |||||||
| (U.S. dollars in millions) - (Unaudited) | |||||||
| September 25, 2026 | December 26, 2025 | ||||||
| Assets | |||||||
| Current assets: | |||||||
| Cash and cash equivalents | $ | 21.1 | $ | 35.7 | |||
| Trade accounts receivable, net | 409.3 | 376.1 | |||||
| Other accounts receivable, net | 84.7 | 85.9 | |||||
| Inventories, net | 849.6 | 581.9 | |||||
| Assets held for sale | 15.1 | 9.6 | |||||
| Prepaid expenses and other current assets | 50.1 | 51.6 | |||||
| Total current assets | 1,429.9 | 1,140.8 | |||||
| Investments in and advances to unconsolidated companies | 51.6 | 63.2 | |||||
| Property, plant and equipment, net | 1,209.5 | 1,119.5 | |||||
| Operating lease right-of-use assets | 181.6 | 192.8 | |||||
| Goodwill | 389.6 | 390.0 | |||||
| Intangible assets, net | 76.9 | 33.1 | |||||
| Deferred income taxes | 48.7 | 45.5 | |||||
| Other noncurrent assets | 81.1 | 74.1 | |||||
| Total assets | $ | 3,468.9 | $ | 3,059.0 | |||
| Liabilities and shareholders' equity | |||||||
| Current liabilities: | |||||||
| Accounts payable and accrued expenses | $ | 548.2 | $ | 467.3 | |||
| Current maturities of debt and finance leases | 7.0 | 1.5 | |||||
| Current maturities of operating leases | 42.9 | 45.4 | |||||
| Income taxes and other taxes payable | 22.6 | 15.1 | |||||
| Total current liabilities | 620.7 | 529.3 | |||||
| Long-term debt and finance leases | 492.6 | 176.2 | |||||
| Retirement benefits | 103.2 | 92.4 | |||||
| Deferred income taxes | 78.6 | 79.1 | |||||
| Operating leases, less current maturities | 116.1 | 125.9 | |||||
| Other noncurrent liabilities | 31.6 | 25.9 | |||||
| Total liabilities | 1,442.8 | 1,028.8 | |||||
| Commitments and contingencies | |||||||
| Shareholders' equity: | |||||||
| Preferred shares | — | — | |||||
| Ordinary shares | 0.5 | 0.5 | |||||
| Paid-in capital | 609.2 | 606.6 | |||||
| Retained earnings | 1,439.4 | 1,447.3 | |||||
| Accumulated other comprehensive loss | (38.1 | ) | (38.2 | ) | |||
| Total Del Monte Corporation shareholders' equity | 2,011.0 | 2,016.2 | |||||
| Noncontrolling interests | 15.1 | 14.0 | |||||
| Total shareholders' equity | 2,026.1 | 2,030.2 | |||||
| Total liabilities and shareholders' equity | $ | 3,468.9 | $ | 3,059.0 | |||
| Del Monte Corporation and Subsidiaries | |||||||
| Condensed Consolidated Statements of Cash Flows | |||||||
| (U.S. dollars in millions) - (Unaudited) | |||||||
| Nine months ended | |||||||
| September 25, 2026 | September 26, 2025 | ||||||
| Operating activities: | |||||||
| Net income | $ | 50.9 | $ | 61.2 | |||
| Adjustments to reconcile net income to net cash provided by operating activities: | |||||||
| Depreciation and amortization | 56.5 | 55.2 | |||||
| Amortization of debt issuance costs | 0.4 | 0.4 | |||||
| Asset impairments | 34.8 | 54.6 | |||||
| Share-based compensation expense | 7.9 | 7.3 | |||||
| Change in uncertain tax positions | 5.2 | (0.8 | ) | ||||
| Deferred income taxes | (3.7 | ) | (2.4 | ) | |||
| Gain on disposal of property, plant and equipment, net | (4.3 | ) | (5.9 | ) | |||
| Income from equity method investments | (10.9 | ) | (10.9 | ) | |||
| Other, net | (0.6 | ) | (2.0 | ) | |||
| Changes in operating assets and liabilities | |||||||
| Receivables | (36.8 | ) | 38.6 | ||||
| Inventories | (101.1 | ) | 32.0 | ||||
| Prepaid expenses and other current assets | (10.2 | ) | (5.6 | ) | |||
| Accounts payable and accrued expenses | 66.4 | 17.6 | |||||
| Other assets and liabilities | (1.4 | ) | (5.1 | ) | |||
| Net cash provided by operating activities | 53.1 | 234.2 | |||||
| Investing activities: | |||||||
| Capital expenditures | (69.2 | ) | (35.7 | ) | |||
| Proceeds from sales of property, plant and equipment | 23.9 | 11.8 | |||||
| Acquisition of select assets of Del Monte Foods, net of cash acquired | (307.7 | ) | — | ||||
| Investments in and advances to unconsolidated companies | (7.0 | ) | (11.7 | ) | |||
| Distributions received from unconsolidated companies | 29.6 | 1.1 | |||||
| Other investing activities | — | 0.1 | |||||
| Net cash used in investing activities | (330.4 | ) | (34.4 | ) | |||
| Financing activities: | |||||||
| Proceeds from debt | 721.4 | 309.8 | |||||
| Payments on debt | (411.9 | ) | (380.9 | ) | |||
| Distributions to noncontrolling interests | (0.4 | ) | (4.2 | ) | |||
| Share-based awards settled in cash for taxes | (1.8 | ) | (0.9 | ) | |||
| Dividends paid | (42.5 | ) | (43.1 | ) | |||
| Repurchase and retirement of ordinary shares | (20.1 | ) | (14.8 | ) | |||
| Other financing activities | (4.1 | ) | (1.2 | ) | |||
| Net cash provided by (used in) financing activities | 240.6 | (135.3 | ) | ||||
| Effect of exchange rate changes on cash | (2.9 | ) | 0.1 | ||||
| Net (decrease) increase in cash, cash equivalents and restricted cash | (39.6 | ) | 64.6 | ||||
| Cash, cash equivalents and restricted cash, beginning | 64.2 | 32.6 | |||||
| Cash, cash equivalents and restricted cash, ending | $ | 24.6 | $ | 97.2 |
Non-GAAP Measures
The Company's results are determined in accordance with U.S. generally accepted accounting principles (GAAP). Certain information presented in this press release reflects adjustments to GAAP measures that are referred to in this press release as “non-GAAP measures.” Management believes these non-GAAP measures provide a more comparable analysis of the underlying operating performance of the business.
These non-GAAP measures include the following: Adjusted net sales, Adjusted gross profit, Adjusted gross margin, Adjusted operating income, Adjusted DMC net income, Adjusted diluted EPS, EBITDA, Adjusted EBITDA, EBITDA margin, and Adjusted EBITDA margin. Adjusted net sales, Adjusted gross profit, Adjusted gross margin, Adjusted operating income, Adjusted DMC net income and Adjusted diluted EPS each reflect adjustments relating to the divestiture of Mann Packing, asset impairment and other charges, net, gain on disposal of property, plant and equipment, net and other product-related charges (credits). EBITDA is defined as net income (loss) attributable to Del Monte Corporation excluding interest expense, net, provision for income taxes, depreciation and amortization, and share-based compensation expense. Adjusted EBITDA represents EBITDA with additional adjustments for the divestiture of Mann Packing (excluding the impact of depreciation, amortization, asset impairment and other charges, net, gain on disposal of property, plant and equipment, net and income taxes already included within the EBITDA calculation), sales claims arising from delays and disruptions to shipments passing through the Strait of Hormuz, asset impairment and other charges, net, gain on disposal of property, plant and equipment, net, and other product-related charges (credits). EBITDA margin represents EBITDA as a percentage of net sales, and Adjusted EBITDA margin represents Adjusted EBITDA as a percentage of Adjusted net sales.
These non-GAAP measures provide the Company with an understanding of the results from the primary operations of its business. The Company uses these metrics because management believes they provide more comparable measures to evaluate period-over-period operating performance since they exclude special items that are not indicative of the Company's core business or operations. These measures may be useful to an investor in evaluating the underlying operating performance of the Company's business because these measures:
- Are used by investors to measure a company's comparable operating performance;
- Are financial measurements that are used by lenders and other parties to evaluate creditworthiness; and
- Are used by the Company's management for various purposes, including as measures of performance of its operating entities, as a basis of strategic planning and forecasting, and in certain cases as a basis for incentive compensation.
Because all companies do not use identical calculations, the Company's presentation of these non-GAAP financial measures may not be comparable to similarly titled measures used by other companies. Reconciliations of non-GAAP financial measures to the most directly comparable GAAP financial measures are provided in the financial tables that accompany this release.
| Del Monte Corporation and Subsidiaries | |||||||||||||||||||||||||||||||||||||
| Non-GAAP Reconciliation | |||||||||||||||||||||||||||||||||||||
| (U.S. dollars in millions, except per-share amounts) - (Unaudited) | |||||||||||||||||||||||||||||||||||||
| Quarter ended | |||||||||||||||||||||||||||||||||||||
| September 25, 2026 | September 26, 2025 | ||||||||||||||||||||||||||||||||||||
| Net Sales | Gross profit | Operating income | Net income attributable to Del Monte Corporation | Diluted EPS | Net Sales | Gross profit | Operating income (loss) | Net income (loss) attributable to Del Monte Corporation | Diluted EPS | ||||||||||||||||||||||||||||
| As reported | $ | 1,095.3 | $ | 102.6 | $ | 29.1 | $ | 18.3 | $ | 0.39 | $ | 1,021.9 | $ | 80.8 | $ | (21.8 | ) | $ | (29.1 | ) | $ | (0.61 | ) | ||||||||||||||
| Adjustments: | |||||||||||||||||||||||||||||||||||||
| Sales claims due to shipping delays in the Middle East (1) | — | — | — | — | — | — | — | — | — | — | |||||||||||||||||||||||||||
| Other product-related charges (credits)(2) | — | — | — | — | — | — | (0.6 | ) | (0.6 | ) | (0.6 | ) | (0.01 | ) | |||||||||||||||||||||||
| Asset impairment and other charges, net(3) | — | — | 8.8 | 8.8 | 0.19 | — | — | 55.5 | 55.5 | 1.15 | |||||||||||||||||||||||||||
| Gain on disposal of property, plant and equipment, net(4) | — | — | (2.5 | ) | (2.5 | ) | (0.06 | ) | — | — | (5.0 | ) | (5.0 | ) | (0.09 | ) | |||||||||||||||||||||
| Divestiture of Mann Packing(5) | — | — | — | — | — | (62.4 | ) | 7.9 | 11.6 | 11.7 | 0.24 | ||||||||||||||||||||||||||
| Tax effects of all adjustments(6) | — | — | — | (1.0 | ) | (0.02 | ) | — | — | — | 0.6 | 0.01 | |||||||||||||||||||||||||
| As adjusted | $ | 1,095.3 | $ | 102.6 | $ | 35.4 | $ | 23.6 | $ | 0.50 | $ | 959.5 | $ | 88.1 | $ | 39.7 | $ | 33.1 | $ | 0.69 |
| Del Monte Corporation and Subsidiaries | |||||||||||||||||||||||||||||||||||||
| Non-GAAP Reconciliation | |||||||||||||||||||||||||||||||||||||
| (U.S. dollars in millions, except per-share amounts) - (Unaudited) | |||||||||||||||||||||||||||||||||||||
| Nine months ended | |||||||||||||||||||||||||||||||||||||
| September 25, 2026 | September 26, 2025 | ||||||||||||||||||||||||||||||||||||
| Net Sales | Gross profit | Operating income | Net income attributable to Del Monte Corporation | Diluted EPS | Net Sales | Gross profit | Operating income | Net income attributable to Del Monte Corporation | Diluted EPS | ||||||||||||||||||||||||||||
| As reported | $ | 3,358.5 | $ | 312.9 | $ | 82.7 | $ | 49.4 | $ | 1.04 | $ | 3,302.8 | $ | 293.1 | $ | 91.4 | $ | 58.8 | $ | 1.22 | |||||||||||||||||
| Adjustments: | |||||||||||||||||||||||||||||||||||||
| Sales claims due to shipping delays in the Middle East (1) | 0.6 | 0.6 | 0.6 | 0.6 | 0.01 | — | — | — | — | — | |||||||||||||||||||||||||||
| Other product-related charges (credits)(2) | — | 1.7 | 1.7 | 1.7 | 0.04 | — | (0.5 | ) | (0.5 | ) | (0.5 | ) | (0.01 | ) | |||||||||||||||||||||||
| Asset impairment and other charges, net(3) | — | — | 43.6 | 43.6 | 0.92 | — | — | 56.1 | 56.1 | 1.16 | |||||||||||||||||||||||||||
| Gain on disposal of property, plant and equipment, net(4) | — | — | (4.3 | ) | (4.3 | ) | (0.09 | ) | — | — | (5.9 | ) | (5.9 | ) | (0.12 | ) | |||||||||||||||||||||
| Divestiture of Mann Packing(5) | — | — | — | — | — | (173.5 | ) | 20.3 | 28.7 | 28.8 | 0.60 | ||||||||||||||||||||||||||
| Tax effects of all adjustments(6) | — | — | — | (3.8 | ) | (0.08 | ) | — | — | — | 2.5 | 0.05 | |||||||||||||||||||||||||
| As adjusted | $ | 3,359.1 | $ | 315.2 | $ | 124.3 | $ | 87.2 | $ | 1.84 | $ | 3,129.3 | $ | 312.9 | $ | 169.8 | $ | 139.8 | $ | 2.90 |
| Del Monte Corporation and Subsidiaries | |||||||||||||||||||||||||||||||||||||||
| Segment Gross Profit Non-GAAP Reconciliation | |||||||||||||||||||||||||||||||||||||||
| (U.S. dollars in millions) - (Unaudited) | |||||||||||||||||||||||||||||||||||||||
| Quarter ended | |||||||||||||||||||||||||||||||||||||||
| September 25, 2026 | September 26, 2025 | ||||||||||||||||||||||||||||||||||||||
| Fresh and value-added products | Banana | Prepared foods | Other products and services | Total | Fresh and value-added products | ||||||||||||||||||||||||||||||||||
| Gross profit (as reported) | $ | 50.5 | $ | (2.7 | ) | $ | 45.8 | $ | 9.0 | $ | 102.6 | $ | |||||||||||||||||||||||||||
| Adjustments: | |||||||||||||||||||||||||||||||||||||||
| Divestiture of Mann Packing(5) | — | — | — | — | — | ||||||||||||||||||||||||||||||||||
| Other product-related charges (credits)(2) | — | — | — | — | — | ||||||||||||||||||||||||||||||||||
| Adjusted Gross profit | $ | 50.5 | $ | (2.7 | ) | $ | 45.8 | $ | 9.0 | $ | 102.6 | $ | |||||||||||||||||||||||||||
| Net sales | $ | 461.3 | $ | 313.3 | $ | 261.2 | $ | 59.5 | $ | 1,095.3 | $ | ||||||||||||||||||||||||||||
| Adjustments: | |||||||||||||||||||||||||||||||||||||||
| Divestiture of Mann Packing(5) | — | — | — | — | — | ||||||||||||||||||||||||||||||||||
| Sales claims due to shipping delays in the Middle East(1) | — | — | — | — | — | ||||||||||||||||||||||||||||||||||
| Adjusted Net sales | $ | 461.3 | $ | 313.3 | $ | 261.2 | $ | 59.5 | $ | 1,095.3 | $ | ||||||||||||||||||||||||||||
| Gross margin(a) | 10.9 | % | (0.9 | )% | 17.5 | % | 15.1 | % | 9.4 | % | |||||||||||||||||||||||||||||
| Adjusted Gross margin(b) | 10.9 | % | (0.9 | )% | 17.5 | % | 15.1 | % | 9.4 | % | |||||||||||||||||||||||||||||
| Del Monte Corporation and Subsidiaries | |||||||||||||||||||||||||||||||||||||||
| Segment Gross Profit Non-GAAP Reconciliation | |||||||||||||||||||||||||||||||||||||||
| (U.S. dollars in millions) - (Unaudited) | |||||||||||||||||||||||||||||||||||||||
| Nine months ended | |||||||||||||||||||||||||||||||||||||||
| September 25, 2026 | September 26, 2025 | ||||||||||||||||||||||||||||||||||||||
| Fresh and value-added products | Banana | Prepared foods | Other products and services | Total | Fresh and value-added products | ||||||||||||||||||||||||||||||||||
| Gross profit (as reported) | $ | 173.2 | $ | 22.2 | $ | 99.3 | $ | 18.2 | $ | 312.9 | $ | 198.4 | |||||||||||||||||||||||||||
| Adjustments: | |||||||||||||||||||||||||||||||||||||||
| Sales claims due to shipping delays in the Middle East(1) | 0.1 | 0.5 | — | — | 0.6 | — | |||||||||||||||||||||||||||||||||
| Divestiture of Mann Packing(5) | — | — | — | — | — | 20.3 | |||||||||||||||||||||||||||||||||
| Other product-related charges (credits)(2) | 0.7 | 1.0 | — | — | 1.7 | (0.2 | ) | ||||||||||||||||||||||||||||||||
| Adjusted Gross profit | $ | 174.0 | $ | 23.7 | $ | 99.3 | $ | 18.2 | $ | 315.2 | $ | 218.5 | |||||||||||||||||||||||||||
| Net sales | $ | 1,579.5 | $ | 1,031.6 | $ | 579.8 | $ | 167.6 | $ | 3,358.5 | $ | 1,811.1 | |||||||||||||||||||||||||||
| Adjustments: | |||||||||||||||||||||||||||||||||||||||
| Sales claims due to shipping delays in the Middle East(1) | 0.1 | 0.5 | — | — | 0.6 | — | |||||||||||||||||||||||||||||||||
| Divestiture of Mann Packing(5) | — | — | — | — | — | (173.5 | ) | ||||||||||||||||||||||||||||||||
| Adjusted Net sales | $ | 1,579.6 | $ | 1,032.1 | $ | 579.8 | $ | 167.6 | $ | 3,359.1 | $ | 1,637.6 | |||||||||||||||||||||||||||
| Gross margin(a) | 11.0 | % | 2.2 | % | 17.1 | % | 10.9 | % | 9.3 | % | 11.0 | % | |||||||||||||||||||||||||||
| Adjusted Gross margin(b) | 11.0 | % | 2.3 | % | 17.1 | % | 10.9 | % | 9.4 | % | 13.3 | % | |||||||||||||||||||||||||||
| (a) Calculated as Gross profit as a percentage of net sales. | |||||||||||||||||||||||||||||||||||||||
| (b) Calculated as Adjusted Gross profit as a percentage of Adjusted Net sales. |
| Del Monte Corporation and Subsidiaries | |||||||||||||||
| Reconciliation of EBITDA and Adjusted EBITDA | |||||||||||||||
| (U.S. dollars in millions) - (Unaudited) | |||||||||||||||
| Quarter ended | Nine months ended | ||||||||||||||
| September 25, 2026 | September 26, 2025 | September 25, 2026 | September 26, 2025 | ||||||||||||
| Net income (loss) attributable to Del Monte Corporation | $ | 18.3 | $ | (29.1 | ) | $ | 49.4 | $ | 58.8 | ||||||
| Interest expense, net | 6.3 | 1.8 | 14.6 | 8.1 | |||||||||||
| Income tax provision | 7.1 | 4.2 | 20.9 | 25.2 | |||||||||||
| Depreciation & amortization | 20.1 | 18.3 | 56.5 | 55.2 | |||||||||||
| Share-based compensation expense | 2.8 | 2.5 | 7.9 | 7.3 | |||||||||||
| EBITDA | 54.6 | (2.3 | ) | 149.3 | 154.6 | ||||||||||
| Adjustments: | |||||||||||||||
| Sales claims due to shipping delays in the Middle East (1) | — | — | 0.6 | — | |||||||||||
| Other product-related charges (credits)(2) | — | (0.6 | ) | 1.7 | (0.5 | ) | |||||||||
| Asset impairment and other charges, net(3) | 8.8 | 55.5 | 43.6 | 56.1 | |||||||||||
| Gain on disposal of property, plant and equipment, net(4) | (2.5 | ) | (5.0 | ) | (4.3 | ) | (5.9 | ) | |||||||
| Divestiture of Mann Packing(5) | — | 10.4 | — | 24.2 | |||||||||||
| Adjusted EBITDA | $ | 60.9 | $ | 58.0 | $ | 190.9 | $ | 228.5 | |||||||
| Net sales | $ | 1,095.3 | $ | 1,021.9 | $ | 3,358.5 | $ | 3,302.8 | |||||||
| Adjusted Net sales | $ | 1,095.3 | $ | 959.5 | $ | 3,359.1 | $ | 3,129.3 | |||||||
| Net income (loss) margin(a) | 1.7 | % | (2.8 | )% | 1.5 | % | 1.8 | % | |||||||
| (a) Calculated as Net income (loss) attributable to Del Monte Corporation as a percentage of net sales. | |||||||||||||||
| Adjusted Net income margin(b) | 2.2 | % | 3.4 | % | 2.6 | % | 4.5 | % | |||||||
| (b) Calculated as Adjusted Net income attributable to Del Monte Corporation as a percentage of Adjusted Net sales. | |||||||||||||||
| EBITDA margin(c) | 5.0 | % | (0.2 | )% | 4.4 | % | 4.7 | % | |||||||
| (c) Calculated as EBITDA as a percentage of net sales. | |||||||||||||||
| Adjusted EBITDA margin(d) | 5.6 | % | 6.0 | % | 5.7 | % | 7.3 | % | |||||||
| (d) Calculated as Adjusted EBITDA as a percentage of Adjusted Net sales. |
| (1) | Sales claims due to shipping delays in the Middle East for the nine months ended September 25, 2026, primarily consisted of customer quality claims arising from delays and disruptions to shipments passing through or indirectly impacted by delays in the Strait of Hormuz and congestion at other ports. |
| (2) | Other product-related charges (credits) for the nine months ended September 25, 2026, primarily consisted of product damages and non-recoverable inventory related to geopolitical developments in the Middle East and disruptions to shipping lanes through the Strait of Hormuz and the congestion at other ports. Other product-related charges (credits) for the quarter and nine months ended September 26, 2025 primarily consisted of insurance recoveries related to damages incurred as a result of Hurricane Beryl during July 2024. |
| (3) | Asset impairment and other charges, net for the quarter ended September 25, 2026, primarily consisted of $6.3 million of impairment charges related to the change in expected use and recoverability of certain property and equipment impacted by the prior quarter closure of four banana farms in Costa Rica, and $2.4 million of expenditures associated with our prior acquisition of Del Monte Foods, including rationalization costs related to discontinued inventory and severance charges related to the reorganization of its operations in Mexico. For the nine months ended September 25, 2026, asset impairment and other charges, net also included $16.1 million related to right-of-use assets acquired from Del Monte Foods for product lines we do not intend to operate, $10.6 million of additional impairment charges related to the closure of four banana farms in Costa Rica, $6.4 million of additional transaction costs and acquisition-related expenditures associated with our acquisition of Del Monte Foods and $1.6 million in property damage in Venezuela related to earthquake damage. Asset impairment and other charges, net for the quarter ended September 26, 2025 primarily consisted of $37.2 million of impairment charges related to low productivity banana farms in the Philippines and $17.9 million of impairment charges associated with our divestiture of Mann Packing, which was completed during the fourth quarter of 2025. For the nine months ended September 26, 2025, asset impairment and other charges, net also included impairment charges of $0.6 million related to a leased grape farm in Chile. |
| (4) | Gain on disposal of property, plant and equipment, net for the quarter ended September 25, 2026, primarily consisted of a $2.2 million gain related to proceeds received from the grant of a utility easement on farmland in Chile. For the nine months ended September 25, 2026, gain on disposal of property, plant and equipment, net also included a $2.2 million gain on idle land in Chile. Gain on disposal of property, plant and equipment, net for the quarter ended September 26, 2025 primarily consisted of a $2.9 million gain on the sale of a carrier vessel and a $2.1 million gain on the sale of an idle property in Chile. For the nine months ended September 26, 2025, gain on disposal of property, plant and equipment, net also included a $0.8 million gain from the sale of idle land in Guatemala. |
| (5) | Divestiture of Mann Packing includes the operating results of Mann Packing Inc. ("Mann Packing") and its wholly owned subsidiaries as a result of the sale of the Mann Packing business, including substantially all of its operational assets, which occurred during the fourth quarter of 2025 (refer to Form 10-K for the year ended December 26, 2025, for further information regarding the divestiture). For the quarter and nine months ended September 26, 2025, the adjustments exclude tax effects of $0.1 million and $0.3 million. The tax effects associated with the operating results of Mann Packing are included in the amounts referenced in footnote (6) below. Total diluted EPS for the divestiture of Mann Packing when including the impacts of tax effects for the quarter and nine months ended September 26, 2025, was $(0.62) and $(0.97). |
| (6) | Tax effects are calculated in accordance with ASC 740, Income Taxes, using the same methodology as the GAAP provision of income taxes. |
About Del Monte Corporation
Del Monte Corporation is one of the world's leading vertically integrated producers, distributors and marketers of fresh and shelf-stable food products, with products sold in more than 90 countries worldwide. As the global owner of the Del Monte® brand, subject to certain existing licensing arrangements, the Company operates across fresh produce, fresh-cut fruit and vegetables, refrigerated foods and shelf-stable categories, serving consumers around the world with a portfolio built on quality, innovation and trust.
Formerly Fresh Del Monte Produce Inc., the Company changed its corporate name to Del Monte Corporation in June 2026, reflecting its expanded role as steward of one of the world's most recognized food brands and its commitment to unlocking new opportunities for growth, innovation and global brand expansion.
The Del Monte® brand has been a symbol of quality, freshness and reliability for more than 135 years. Del Monte Corporation is not affiliated with certain other Del Monte companies around the world, including Del Monte Asia Pte. Ltd. The Company is the first global marketer of fruits and vegetables to commit to the Science Based Targets initiative and has been recognized as one of America's Most Trusted Companies by Newsweek and named a Humankind 100 Company by Humankind Investments.
Forward-looking Information
This press release and the related earnings call contain certain forward-looking statements within the meaning of the safe harbor provisions of the Private Securities Litigation Reform Act of 1995 regarding the intent, beliefs or current expectations of the Company. These statements include statements that are preceded by, followed by or include the words “believes”, “expects”, “anticipates”, “may” or similar expressions with respect to various matters. Specifically, this press release contains forward-looking statements regarding the Company’s plans and expectations for future performance, including: the expected benefits of the Del Monte Foods acquisition; the Company’s ability to strengthen brand consistency, expand customer reach, enhance efficiency and build a stronger, more flexible platform focused on innovation and long-term value creation. It is important to note that these forward-looking statements are not guarantees of future performance and involve known and unknown risks and uncertainties and assumptions that may cause the Company’s actual plans and performance to differ materially from those expressed in or implied by the forward-looking statements as a result of various factors, including: the occurrence of any event, change or other circumstances under which the anticipated benefits of the Del Monte Foods acquisition are not realized when expected or at all, including as a result of the impact of, or problems arising from, our inability to successfully execute on our integration strategy, the diversion of management’s attention from ongoing business operations and opportunities, operating costs and business disruption following the Del Monte Foods acquisition, litigation exposure and other liabilities associated with the Del Monte Foods acquisition; the Company’s ability to service the additional indebtedness incurred as a result of the acquisition of Del Monte Foods and comply with covenants under our credit facility; the effects of tariffs, including developments relating to IEEPA refunds; adverse weather conditions, and manufacturing processes with those of the Company's, ongoing elevated commodity, freight and supply chain costs; and risks associated with the conflict in the Middle East, including disruptions to shipping lanes through the Strait of Hormuz and congestion at other ports. In addition, these forward-looking statements and the information in this press release and the earnings call are qualified in their entirety by cautionary statements and risk factor disclosures contained in the Company’s Securities and Exchange Commission filings, including the Company’s most recently filed Annual Report on Form 10-K. All forward-looking statements in this press release are made only as of the date of this press release based on information available to us on the date hereof, and we assume no obligation to update such statements except as required by law.
Investors:
Christine Cannella
Vice President, Investor Relations
[email protected]
Media:
Claudia Pou
Vice President, Global Head of Corporate Communications
[email protected]
Source: Del Monte Corporation
Investor Contact
Christine Cannella
Del Monte Corporation
U.S. Executive Offices
241 Sevilla Avenue, 12th Floor
Coral Gables, FL 33134
Phone: 305-520-8433
Company
Investor Email Alerts
Personal Information.
Email Address *Required Email Address is required. Email Address is invalid.
Investor Alert Options *
- News
- Quarterly Reports
- Annual Reports
- SEC Filings
- End of Day Stock Quote
- Events & Presentations
Investor Alert Options is required.
The captcha test has failed. Please try again.
Submit


Del Monte Corporation is not related to Del Monte Foods Corporation II Inc. or its affiliates that are parties to the U.S. Bankruptcy case.
-
|
-
|
-
|
-
|
© 2026 Del Monte Corporation - All rights reserved
Powered By Q4 Inc. 5.191.0.1 (opens in new window)