|
Dollar General Corporation is a discount retailer operating small-box stores in the United States and Mexico. The company sells a broad selection of merchandise, including consumables, seasonal items, home products, and apparel, featuring both national brands and private label selections at everyday low prices. Its store base is concentrated in rural, suburban, and urban communities across the southern, southwestern, midwestern, and eastern United States, with initial expansion into Mexico beginning in 2023. Dollar General offers a focused assortment of everyday necessities such as packaged food, health and beauty care items, cleaning supplies, and basic apparel. The company also operates the pOpshelf retail concept, which focuses on non-consumables, and the Mi Súper Dollar General format in Mexico. Founded in 1939 as J.L. Turner and Son, Wholesale, the company was incorporated in 1955 and changed its name to Dollar General Corporation in 1968. It serves customers seeking convenient, time-saving shopping experiences for basic household and personal needs. Summarised from the company's own disclosures, fiscal year ended Mar 2026 |
Industry Discount Stores | Homepage dollargeneral.com |
| Sector Consumer Defensive | IR page investor.dollargeneral.com | |
|
Tags
discount retail, small-box stores, private label, consumables, seasonal merchandise, home products, apparel, health and beauty, packaged food, rural markets, everyday low prices, convenience retail, Dollar General, pOpshelf, Mi Súper Dollar General
|
Press page — |
Metrics
| Valuation | |
|---|---|
| Market cap | $ 26.381B |
| Market cap (USD) | $ 26.381B |
| P/E | 15.55 |
| PEG | — |
| P/BV | 2.84 |
| P/S | 0.60 |
| P/OCF | 7.95 |
| P/FCF | 13.12 |
| Dividend yield | 0.02% |
| Turnover / mcap | — |
| Returns | |
|---|---|
| ROE | 19.0% |
| ROI | 11.6% |
| ROIC | 13.0% |
| Profit margin | 3.5% |
| Growth | |
|---|---|
| Revenue growing | Yes |
| Profits growing | No |
| Revenue up 3y | Yes |
| Revenue up 5y | Yes |
| Earnings growth 3y (net profit CAGR) | -14.5% |
| Quality | |
|---|---|
| Profitable | Yes |
| Margin expanding | No |
| Buying back stock | No |
| Diluting (TTM) | No |
| Debt/Equity | 53.8% |
| Podcast bulls (TTM) | Sign up |
| Podcast bears (TTM) | Sign up |
| Podcast sentiment (TTM) | Sign up |
| Podcast sentiment % (TTM) | Sign up |
| News sentiment (TTM) | 17 |
| Quality score | 26.3% |
| Insiders | |
|---|---|
| Buys, 1w | Sign up |
| Buys, 1m | Sign up |
| Buys, 1y | Sign up |
| Sells, 1w | Sign up |
| Sells, 1m | Sign up |
| Sells, 1y | Sign up |
Sign up to see this company's insider trades
| Figure | FY 2025 | FY 2024 | FY 2023 | FY 2022 | FY 2021 | FY 2020 | FY 2019 | FY 2018 | FY 2017 | FY 2016 | FY 2015 | FY 2014 | FY 2013 | FY 2012 | FY 2011 | FY 2010 | FY 2006 | FY 2005 | FY 2004 | FY 2003 | FY 2002 | FY 2001 | FY 2000 | FY 1999 |
|---|---|---|---|---|---|---|---|---|---|---|---|---|---|---|---|---|---|---|---|---|---|---|---|---|
| Revenue | 42.724B | 40.612B | 38.692B | 37.845B | 34.22B | 33.747B | 27.754B | 25.625B | 23.471B | 21.987B | 20.369B | 18.91B | 17.504B | 16.022B | 14.807B | 13.035B | 9.17B | 8.582B | 7.661B | — | — | — | — | — |
| Net profit | 1.512B | 1.125B | 1.661B | 2.416B | 2.399B | 2.655B | 1.713B | 1.589B | 1.539B | 1.251B | 1.165B | 1.065B | 1.025B | 952.662M | 766.685M | 627.857M | 137.943M | 350.155M | 344.19M | 301M | 264.946M | 207.513M | 150.934M | 219.427M |
| Free cash flow | 2.393B | 1.686B | 691.576M | 423.973M | 1.795B | 2.848B | 1.453B | 1.409B | 1.156B | 1.045B | 873.182M | 940.777M | 674.621M | 559.756M | 535.619M | 404.289M | 143.842M | 271.373M | 97.564M | 369.192M | 299.725M | 140.263M | 30.309M | -12.381M |
| Figure | FY 2025 | FY 2024 | FY 2023 | FY 2022 | FY 2021 | FY 2020 | FY 2019 | FY 2018 | FY 2017 | FY 2016 | FY 2015 | FY 2014 | FY 2013 | FY 2012 | FY 2011 | FY 2010 | FY 2006 | FY 2005 | FY 2004 | FY 2003 | FY 2002 | FY 2001 | FY 2000 | FY 1999 |
|---|---|---|---|---|---|---|---|---|---|---|---|---|---|---|---|---|---|---|---|---|---|---|---|---|
| Share price | 132.77 | 75.82 | 135.95 | 243.93 | 235.83 | 216.05 | 155.98 | 111.63 | 93.01 | 74.07 | 74.07 | 70.7 | 60.32 | 44.09 | 41.15 | 30.84 | 17.6 | 17.75 | — | — | — | — | — | — |
| Price performance 12m | 0.75 | -0.44 | -0.44 | 0.03 | 0.09 | 0.39 | 0.4 | 0.2 | 0.26 | 0 | 0.05 | 0.17 | 0.37 | 0.07 | 0.33 | 0.53 | -0.01 | — | — | — | — | — | — | — |
Filed figures
Lines the statements and their notes report beside the headline figures, read from the filings' XBRL as filed (no restatement applied), with figures computed from one filing's own lines. Cash-flow lines carry their cash direction: an outflow is negative. Each period links to its filing; a figure's period, report date and tag are in its tooltip.
| Figure | Jan 2017 | Jan 2018 | Jan 2019 | Jan 2020 | Jan 2021 | Jan 2022 | Jan 2023 | Jan 2024 | Jan 2025 | Jan 2026 |
|---|---|---|---|---|---|---|---|---|---|---|
| Balance sheet detail | ||||||||||
| Borrowings, current (USD) | 501M | 401M | 1.95M | 555,000 | — | — | — | 769M | 519M | 14.4M |
| Borrowings, non-current (USD) | 2.71B | 2.6B | 2.86B | 2.91B | — | 4.17B | 7.01B | 6.23B | 5.72B | 4.57B |
| Lease liabilities (USD) | — | — | — | 8.78B | 9.46B | 10.1B | 10.7B | 11.1B | 11.4B | 11.3B |
| Cash and deposits (USD) | 188M | 267M | 235M | 240M | 1.38B | 345M | 382M | 537M | 933M | 1.14B |
| Intangible assets (USD) | 1.2B | 1.2B | 1.2B | 1.2B | 1.2B | 1.2B | 1.2B | 1.2B | 1.2B | 1.2B |
| Right-of-use assets (USD) | — | — | — | 8.8B | 9.47B | 10.1B | 10.7B | 11.1B | 11.2B | 11.1B |
| Net debt (borrowings + leases - cash) (USD) | 3.02B | 2.74B | 2.63B | 11.5B | — | 13.9B | 17.3B | 17.6B | 16.7B | 14.7B |
| Cash flow detail | ||||||||||
| Operating cash flow (USD) | 1.61B | 1.8B | 2.14B | 2.24B | 3.88B | 2.87B | 1.98B | 2.39B | 3B | 3.63B |
| Purchases of property, plant and equipment (USD) | -560M | -646M | -734M | -785M | -1.03B | -1.07B | -1.56B | -1.7B | -1.31B | -1.24B |
| Change in payables (cash effect) (USD) | 56.5M | 428M | 375M | 429M | 746M | 98.7M | -195M | 36.9M | 303M | 185M |
| Dividends paid (cash effect) (USD) | -281M | -283M | -307M | -328M | -356M | -392M | -494M | -518M | -519M | -520M |
| Share buybacks (cash effect) (USD) | -990M | -580M | -1.01B | -1.2B | -2.47B | -2.55B | -2.75B | — | — | — |
| Interest paid (cash effect) (USD) | -93M | -88.7M | -98M | -100M | -128M | -160M | -195M | -352M | -337M | -290M |
| Income taxes paid (cash effect) (USD) | -680M | -661M | -313M | -457M | -722M | -568M | -501M | -360M | -355M | -321M |
| Share-based compensation (USD) | 37M | 34.3M | 40.9M | 48.6M | 68.6M | 78.2M | 72.7M | 51.9M | 58.7M | 91.5M |
| Free cash flow (OCF - PPE - intangibles) (USD) | 1.04B | 1.16B | 1.41B | 1.45B | 2.85B | 1.8B | 424M | 692M | 1.69B | 2.39B |
| Income detail | ||||||||||
| Total comprehensive income (USD) | 1.25B | 1.54B | 1.59B | 1.71B | 2.66B | 2.4B | 2.42B | 1.66B | 1.13B | 1.52B |
| Comprehensive income to owners (USD) | 1.25B | 1.54B | 1.59B | 1.71B | 2.66B | 2.4B | 2.42B | 1.66B | 1.13B | 1.52B |
| Reported | Mar 24, 2017 | Mar 23, 2018 | Mar 22, 2019 | Mar 19, 2020 | Mar 19, 2021 | May 26, 2022 | Mar 24, 2023 | Mar 25, 2024 | Mar 21, 2025 | Mar 20, 2026 |
Sign up to see institutional holdings
Sign UpPodcast Mentions
Sign up to see podcast mentions and sentiment
Sign UpMaterial events reported to the SEC on Form 8-K or 6-K, newest first. The link opens the filing itself on EDGAR. Press releases from the company's own website, newest first.
Thu, 05 Nov 2026
GOODLETTSVILLE, Tenn.--(BUSINESS WIRE)-- Dollar General Corporation (NYSE: DG) today announced that it plans to release its financial results for the fiscal 2026 third quarter ended October 30, 2026, on December 3, 2026.
In connection with the release, Todd Vasos, chief executive officer, and Donny Lau, chief financial officer, will host a conference call on December 3, 2026, at 8:00 a.m. CT/9:00 a.m. ET.
During the call, the company will discuss the earnings results and may discuss material business, financial or other information that is not contained in the earnings release.
To participate via telephone, please call (877) 407-0890 at least 10 minutes before the conference call is scheduled to begin. The conference ID is 13763386. There will also be a live webcast of the call available at https://investor.dollargeneral.com under “News & Events, Events & Presentations.” A replay of the conference call will be available through December 31, 2026, and will be accessible via webcast replay or by calling (877) 660-6853. The conference ID for the telephonic replay is 13763386.
About Dollar General Corporation
Dollar General Corporation (NYSE: DG) is proud to serve as America’s neighborhood general store. Founded in 1939, Dollar General lives its mission of Serving Others every day by providing access to affordable products and services for its customers, career opportunities for its employees, and literacy and education support for its hometown communities. As of July 31, 2026, the Company’s 21,148 Dollar General, DG Market, DGX and pOpshelf stores across the United States and Mi Súper Dollar General stores in Mexico provide everyday essentials including food, health and wellness products, cleaning and laundry supplies, self-care and beauty items, and seasonal décor from our high-quality private brands alongside many of the world’s most trusted brands such as Coca Cola, PepsiCo/Frito-Lay, General Mills, Hershey, J.M. Smucker, Kraft, Mars, Nestlé, Procter & Gamble and Unilever.
View source version on businesswire.com: https://www.businesswire.com/news/home/20261105028590/en/
Dollar General Investor Relations [email protected] Dollar General Media Relations [email protected]
Source: Dollar General Corporation
Thu, 05 Nov 2026
Retailer lowers prices on nearly 100 seasonal food items and offers savings on holiday sides, baking essentials and entertaining needs
GOODLETTSVILLE, Tenn.--(BUSINESS WIRE)-- Dollar General (NYSE: DG) is helping customers gather around the holiday table for less with affordable meal solutions, seasonal savings and convenient shopping options designed to make holiday hosting easier. This season, customers can purchase many of the pantry staples and side dishes needed to create a traditional holiday meal for under$20, reinforcing Dollar General's commitment to helping families celebrate without overspending.
This press release features multimedia. View the full release here: https://www.businesswire.com/news/home/20261105483748/en/
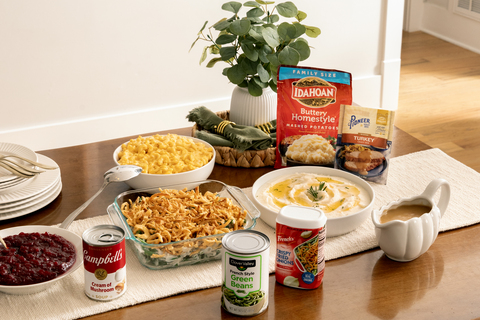
Dollar General's spend $15, save $5 begins November 8 and features approximately 90 qualifying products, including Idahoan® Mashed Potatoes, Clover Valley® canned cut green beans, French's® Crispy Fried Onions, Pioneer™ Roasted Turkey Gravy Mix, Campbell's® Cream of Mushroom Soup and more.
From stuffing and mashed potatoes to cranberry sauce, gravy, vegetables and baking ingredients, Dollar General is offering value throughout the holiday season with price reductions and special promotions on nearly 100 seasonal food items and everyday low prices on trusted national and private brands.
"Our customers continue to look for ways to celebrate meaningful holiday traditions while staying within budget," said Allen Warch, vice president and division merchandise manager of food and fresh at Dollar General. "Whether they're preparing a holiday meal, baking family-favorite desserts or picking up last-minute entertaining essentials, we're proud to offer convenient solutions and affordable prices that help make holiday hosting easier."
Discover Holiday Savings for Every Gathering at DGCustomers can find additional savings throughout the season with special offers on meal preparation and holiday baking essentials, including a special Spend $15, Save $5 on select holiday baking and food items from November 8 through December 24, 2026, with approximately 90 qualifying products. Among the seasonal items included in the promotion are holiday meal favorites Idahoan® Mashed Potatoes, Stove Top® Stuffing, Ocean Spray® Cranberry Sauce, Heinz® Chicken and Turkey Gravy, Bruce's® Cut Yams, Clover Valley® canned whole kernel corn and cut green beans, Jiffy® Corn Muffin Mix and Velveeta® Shells & Cheese.
Seasonal deals, which can be combined with the Spend $15, Save $5 promotion, vary throughout the season. Highlights of the deals include:
-
Kraft® Mac & Cheese 4 pack, 2 for $7
-
Stove Top® Stuffing and Heinz® Gravy, Mix and Match 2 for $4
-
Betty Crocker® cake mix or frosting, 2 for $3.50
-
Libby's® 100% Pure Pumpkin, $2
-
Jet-Puffed® Marshmallows or Crème, 2 for $3
-
Hershey's® Cocoa or Baking Chips, 2 for $8
-
Welch’s® Sparkling Grape Juice, $3.75
-
Campbell’s® Cream of Chicken or Mushroom Soup, $1.00
Additionally, customers can save $2 when spending $6 on select Jell-O®, Baker's®, Kraft®, Jet-Puffed® and related baking products. Dollar General also offers everyday value through its private brands like select **$1 Clover Valley®**products, including assorted soups, chicken or beef broth and spices that can help complete holiday recipes and side dishes without stretching household budgets.
How Shoppers Can Save on Baking, Entertaining and Last-Minute NeedsIn addition to meal ingredients, Dollar General offers a variety of holiday entertaining and hosting solutions, including beverages, disposable tableware, paper goods, cleaning supplies and seasonal décor. The Company’s Value Valley offers more than 500 items across essential categories priced at $1, making it easier for customers to not only add to their holiday hosting shopping baskets, but stock up household essentials every day.
Customers looking for holiday recipe inspiration can find ideas throughout the season in DG's weekly circular, featuring festive treats and family favorites such as Pumpkin Cream Cheese Dessert Bars, Pumpkin Pie Fluff, Chocolate Trifle, Sweet Yam Holiday Bake and Peppermint Hot Cocoa Brownie Skillet. Seasonal recipes crafted with ingredients from Dollar General are available online at https://www.dollargeneral.com/ch/better-for-you, DG’s online Thanksgiving Dining Guide can be found at: https://www.dollargeneral.com/c/food-beverage/thanksgiving-dining-guide while a Holiday Dining Guide is online at: https://www.dollargeneral.com/c/grocery/holiday-meal-ideas.
Providing Holiday Convenience When and How Customers Need It
With more than 21,000 stores located close to where customers live and work, Dollar General makes it easy to pick up holiday essentials, forgotten ingredients and last-minute entertaining needs. Customers can also choose from a variety of convenient delivery options, including myDG® Delivery, Instacart, DoorDash and Uber Eats, bringing holiday meal ingredients, pantry staples and seasonal essentials directly to their doorstep.

Prompts
Click prompts to add them under the company line, click again to take one out, then copy the result into your AI chat. Shared by Asian Century Stocks and Uncovered Thai Stocks. Thank you.
ETFs Holding Dollar General Corporation
Exchange-traded funds whose newest published daily portfolio holds one of the company's listings, largest weight first.
| ETF | Weight in ETF | Shares | Market value | As of |
|---|---|---|---|---|
| BIDD | 4.21% | 120,550 | $ 15.291M | Nov 16, 2026 |
| NLSI | 4.02% | 1,525 | $ 182.36K | Sep 30, 2026 |
| DIVE | 3.45% | 12,680 | $ 1.727M | Nov 17, 2026 |
| CVGD | 2.53% | 27,562 | $ 3.502M | Jul 31, 2026 |
| ACTS | 2.22% | 1,848 | $ 212.723K | Jun 30, 2026 |
| YALL | 2.15% | 11,654 | $ 1.587M | Nov 17, 2026 |
| CVAR | 1.83% | 6,185 | $ 785.804K | Jul 31, 2026 |
| BLCV | 1.33% | 35,027 | $ 4.77M | Nov 16, 2026 |
| IDYN | 1.21% | 10,510 | $ 1.333M | Nov 16, 2026 |
| YNOT | 1.19% | 18,277 | $ 2.317M | Aug 31, 2026 |
| BRNY | 1.13% | 46,814 | $ 6.25M | Nov 18, 2026 |
| TIME | 1.01% | 1,100 | $ 149.798K | Nov 17, 2026 |
| AVMV | 0.93% | 56,942 | $ 7.754M | Nov 16, 2026 |
| IEDI | 0.86% | 1,901 | $ 241.522K | Jul 31, 2026 |
| UPSD | 0.81% | 7,441 | $ 945.379K | Jul 31, 2026 |
| REMC | 0.80% | 236 | $ 27.166K | Jun 30, 2026 |
| LSEQ | 0.80% | 1,034 | $ 138.701K | Nov 13, 2026 |
| BRCE | 0.76% | 2,225 | $ 282.019K | Aug 31, 2026 |
| VUS | 0.68% | 960 | $ 121.968K | Jul 31, 2026 |
| FEGE | 0.67% | 132,627 | $ 16.81M | Aug 31, 2026 |
| BRES | 0.64% | 29,166 | $ 3.89M | Nov 18, 2026 |
| NDOW | 0.62% | 3,722 | $ 428.439K | Jun 30, 2026 |
| AVLV | 0.49% | 821,012 | $ 111.805M | Nov 16, 2026 |
| CAPE | 0.42% | 8,743 | $ 1.006M | Jun 30, 2026 |
| BTAL short | -0.41% | -10,120 | $ -1.165M | Jun 30, 2026 |
| BDVL | 0.39% | 51,307 | $ 6.987M | Nov 16, 2026 |
| AVMC | 0.37% | 14,978 | $ 2.04M | Nov 16, 2026 |
| FLDZ | 0.35% | 123 | $ 14.159K | Jun 30, 2026 |
| THMR | 0.31% | 1,141 | $ 144.622K | Aug 31, 2026 |
| FTLS | 0.28% | 54,122 | $ 0.00 | Nov 16, 2026 |
| GVLU | 0.28% | 5,324 | $ 725.022K | Nov 17, 2026 |
| DFLV | 0.27% | 153,650 | $ 20.683M | Nov 12, 2026 |
| ENHI | 0.26% | 436 | $ 55.304K | Nov 16, 2026 |
| FMDE | 0.24% | 155,262 | $ 17.872M | Jun 30, 2026 |
| EBI | 0.21% | 11,427 | $ 1.448M | Aug 31, 2026 |
| VFMF | 0.21% | 16,052 | $ 2.035M | Aug 31, 2026 |
| RGLO | 0.21% | 6,028 | $ 693.883K | Jun 30, 2026 |
| IALT | 0.20% | 115,454 | $ 16.194M | Nov 16, 2026 |
| THRO | 0.19% | 148,314 | $ 20.197M | Nov 16, 2026 |
| LGDX | 0.16% | 1,655 | $ 225.378K | Nov 17, 2026 |
| DFUV | 0.16% | 185,307 | $ 24.944M | Nov 12, 2026 |
| CDX short | -0.16% | -2,909.3141 | $ -388.481K | Nov 17, 2026 |
| AVLC | 0.15% | 17,278 | $ 2.353M | Nov 16, 2026 |
| DXUV | 0.14% | 65,671 | $ 8.84M | Nov 12, 2026 |
| AVUS | 0.14% | 144,575 | $ 19.688M | Nov 16, 2026 |
| GMOV | 0.14% | 1,178 | $ 149.312K | Aug 31, 2026 |
| FLSP | 0.14% | 11,134 | $ 1.282M | Jun 30, 2026 |
| AVSU | 0.13% | 4,576 | $ 623.16K | Nov 16, 2026 |
| DFSU | 0.13% | 22,858 | $ 3.077M | Nov 12, 2026 |
| VFVA | 0.12% | 9,384 | $ 1.189M | Aug 31, 2026 |
| DYNF | 0.12% | 352,452 | $ 47.997M | Nov 16, 2026 |
| DFVX | 0.11% | 4,721 | $ 635.494K | Nov 12, 2026 |
| INRO | 0.10% | 4,442 | $ 604.912K | Nov 16, 2026 |
| FEAC | 0.10% | 223 | $ 25.67K | Jun 30, 2026 |
| DFAC | 0.10% | 630,063 | $ 84.813M | Nov 12, 2026 |
| FEMV | 0.10% | 44 | $ 5,064.84 | Jun 30, 2026 |
| ACVF | 0.09% | 1,035 | $ 131.497K | Jul 31, 2026 |
| FELV | 0.07% | 18,426 | $ 2.121M | Jun 30, 2026 |
| DCOR | 0.07% | 219,715 | $ 29.576M | Nov 12, 2026 |
| AAUS | 0.06% | 2,384 | $ 320K | Nov 18, 2026 |
| DFAU | 0.06% | 55,580 | $ 7.482M | Nov 12, 2026 |
| APUE | 0.05% | 10,244 | $ 1.298M | Aug 31, 2026 |
| XMAG | 0.05% | 785 | $ 105.669K | Nov 13, 2026 |
| ENHU | 0.05% | 34 | $ 4,630.12 | Nov 16, 2026 |
| DFUS | 0.04% | 71,666 | $ 9.647M | Nov 12, 2026 |
| TACU | 0.04% | 54 | $ 7,353.72 | Nov 17, 2026 |
| SFGV | 0.04% | 3,661 | $ 490K | Nov 18, 2026 |
| VOXP | 0.04% | 18 | $ 2,286.90 | Jul 31, 2026 |
| HCMT | 0.03% | 1,531 | $ 194.514K | Jul 31, 2026 |
| NTSX | 0.03% | 3,857 | $ 443.979K | Jun 30, 2026 |
| VSLU | 0.03% | 1,480 | $ 170.363K | Jun 30, 2026 |
| GDE | 0.03% | 1,060 | $ 134.355K | Aug 31, 2026 |
| MSLC | 0.03% | 8,492 | $ 1.076M | Aug 31, 2026 |
| LCTD | 0.02% | 603 | $ 76.487K | Nov 16, 2026 |
| GSPY | 0.02% | 794 | $ 108.127K | Nov 17, 2026 |
| NTSD | 0.02% | 61 | $ 7,021.71 | Jun 30, 2026 |
| CSHP | 0.01% | 376 | $ 51.204K | Nov 16, 2026 |
| FELC | 0.00% | 14 | $ 1,611.54 | Jun 30, 2026 |
| CORO | 0.00% | 139 | $ 18.947K | Nov 16, 2026 |