DE
Fiscal year ends October Quarters are offset from the calendar — Q1 is Nov–Jan

Deere & Company manufactures agricultural, construction, and forestry equipment, providing financial services and technology solutions. The company operates through four business segments: Production & Precision Agriculture, Small Agriculture & Turf, Construction & Forestry, and Financial Services. Its product portfolio includes tractors, harvesters, cotton pickers, sugarcane harvesters, tillage and seeding equipment, compact tractors, utility vehicles, riding lawn equipment, backhoe loaders, excavators, skid steers, and roadbuilding machinery. Deere & Company also offers retail notes, revolving charge accounts, wholesale receivables, leases, and extended warranties through its financial services arm. The company serves production-scale growers of crops such as corn, soy, small grains, cotton, and sugarcane, as well as customers in lawn and property maintenance, golf course maintenance, earthmoving, forestry, and roadbuilding. It provides digital management systems, precision technologies, and automation solutions to optimize equipment performance and decision-making. Deere & Company was incorporated in 1958 and has manufactured agricultural equipment since 1837.

Summarised from the company's own disclosures, fiscal year ended Dec 2025

Industry Farm & Heavy Construction Machinery Homepage deere.com/en
Sector Industrials IR page investor.deere.com/home/default.aspx
Tags
agricultural machinery, construction equipment, forestry equipment, precision agriculture, financial services, turf equipment, roadbuilding machinery, automation, telematics, equipment financing, John Deere, John Deere Financial, John Deere Operations Center, Hagie, Mazzotti, Monosem, PLA, King Agro, Harvest Profit, Sentera, A & I, Unimil by John Deere, Alternatives by John Deere, Frontier, Surepoint, CF Smart Detect
Press page deere.com/en-us/our-company/newsroom

Metrics

Valuation  
Market cap $ 181.067B
Market cap (USD) $ 181.067B
P/E 37.33
PEG —
P/BV 6.47
P/S 3.77
P/OCF 24.99
P/FCF 30.07
Dividend yield 0.96%
Turnover / mcap —
Returns  
ROE 20.6%
ROI 6.0%
ROIC 8.1%
Profit margin 11.0%
Growth  
Revenue growing No
Profits growing No
Revenue up 3y No
Revenue up 5y No
Earnings growth 3y (net profit CAGR) -11.0%
Quality  
Profitable Yes
Margin expanding No
Buying back stock Yes
Diluting (TTM) No
Debt/Equity 221.0%
Podcast bulls (TTM) Sign up
Podcast bears (TTM) Sign up
Podcast sentiment (TTM) Sign up
Podcast sentiment % (TTM) Sign up
News sentiment (TTM) 6
Quality score -15.8%
Insiders  
Buys, 1w Sign up
Buys, 1m Sign up
Buys, 1y Sign up
Sells, 1w Sign up
Sells, 1m Sign up
Sells, 1y Sign up

Sign up to see this company's insider trades

Figure FY 2025 FY 2024 FY 2023 FY 2022 FY 2021 FY 2020 FY 2019 FY 2018 FY 2017 FY 2016 FY 2015 FY 2014 FY 2013 FY 2012 FY 2011 FY 2010 FY 2009 FY 2008 FY 2007 FY 2006 FY 2005 FY 2004 FY 2003 FY 2002 FY 2001 FY 2000
Revenue 45.684B 51.716B 61.251B 52.577B 44.024B 35.54B 39.258B 37.358B 29.738B 26.644B 28.863B 36.067B 37.795B 36.157B 32.013B 26.005B 23.112B 28.438B 24.082B 22.148B 21.931B 19.986B 15.535B 13.947B 13.293B 13.137B
Net profit 5.027B 7.1B 10.166B 7.131B 5.963B 2.751B 3.253B 2.368B 2.159B 1.524B 1.94B 3.162B 3.537B 3.065B 2.8B 1.865B 873.5M 2.053B 1.822B 1.694B 1.447B 1.406B 643.1M 319.2M -64M 485.5M
Free cash flow 6.099B 7.591B 7.091B 3.565B 6.878B 6.663B 2.292B 923.9M 1.605B 3.12B 3.046B 2.478B 2.096B -151.5M 1.27B 1.521B 1.078B 836.7M 1.737B 207.2M 704M 798.7M 1.226B — 622.4M 653.3M

Figure FY 2025 FY 2024 FY 2023 FY 2022 FY 2021 FY 2020 FY 2019 FY 2018 FY 2017 FY 2016 FY 2015 FY 2014 FY 2013 FY 2012 FY 2011 FY 2010 FY 2009 FY 2008 FY 2007 FY 2006 FY 2005 FY 2004 FY 2003 FY 2002 FY 2001 FY 2000
Share price 457.26 417.33 379.19 402.26 335.07 221.63 178.67 150.33 134.97 85.35 74 81.99 81.39 82.47 64.57 77 48.89 49.5 159.59 90 — — — — — —
Price performance 12m 0.1 0.1 -0.06 0.2 0.51 0.24 0.19 0.11 0.58 0.15 -0.1 0.01 -0.01 0.28 -0.16 0.57 -0.01 -0.69 0.77 — — — — — — —

Filed figures

Figure Oct 2016 Oct 2017 Oct 2018 Oct 2019 Oct 2020 Oct 2021 Oct 2022 Oct 2023 Oct 2024 Oct 2025
Balance sheet detail
Borrowings, current (USD) — — — — 8.58B 10.9B 12.6B 17.9B 13.5B 13.8B
Borrowings, non-current (USD) 23.7B 25.9B 27.2B 30.2B 32.7B 32.9B — — — —
Lease liabilities (USD) — — — — 60M 61M 51M 74M 105M 112M
Cash and deposits (USD) 4.34B 9.33B 3.9B 3.86B 7.07B 8.02B 4.77B 7.46B 7.32B 8.28B
Intangible assets (USD) 104M 218M 1.56B 1.38B 1.33B 1.28B 1.22B 1.13B 999M 892M
Right-of-use assets (USD) — — — — 324M 291M 299M 283M 274M 317M
Net debt (borrowings + leases - cash) (USD) 19.4B 16.6B 23.3B 26.4B 25.7B 35.9B 7.87B 10.6B 6.31B 5.63B
Cash flow detail
Operating cash flow (USD) 3.76B 2.2B 1.82B 3.41B 7.48B 7.73B 4.7B 8.59B 9.23B 7.46B
Purchases of property, plant and equipment (USD) -644M -595M -896M -1.12B -820M -848M -1.13B -1.5B -1.64B -1.36B
Change in receivables (cash effect) (USD) 335M -839M -1.53B -869M 2.01B 969M -2.48B -4.25B 421M 1.08B
Change in inventories (cash effect) (USD) -106M -1.31B -1.77B -780M 397M -2.5B -2.09B 279M 788M -275M
Change in payables (cash effect) (USD) -155M 968M 722M 46M -7M 1.88B 1.13B 830M -1.04B -251M
Dividends paid (cash effect) (USD) -761M -764M -806M -943M -956M -1.04B -1.31B -1.43B -1.61B -1.72B
Share buybacks (cash effect) (USD) -205M -6.2M -958M -1.25B -750M -2.54B -3.6B -7.22B -4.01B -1.14B
Interest paid (cash effect) (USD) -726M -903M -1.18B -1.46B -1.28B -1.04B -1.1B -2.23B -3.3B -3.08B
Income taxes paid (cash effect) (USD) -392M -981M -712M -1.11B -1.07B -2.08B -1.94B -3.58B -2.52B -1.65B
Share-based compensation (USD) 70.6M 68.1M 83.8M 82M 81M 82M 85M 130M 208M 151M
Operating cash flow before change in receivables (USD) 3.43B 3.04B 3.35B 4.28B 5.47B 6.76B 7.18B 12.8B 8.81B 6.38B
Free cash flow (OCF - PPE - intangibles) (USD) 3.12B 1.6B 924M 2.29B 6.66B 6.88B 3.57B 7.09B 7.59B 6.1B
Income detail
Research and development expense (USD) 1.39B 1.37B 1.66B 1.78B 1.64B 1.59B 1.91B 2.18B 2.29B 2.31B
↳ 5y CAGR +2.5% -0.9% +2.3% +4.2% +2.9% +2.7% +6.9% +5.6% +5.1% +7.0%
Total comprehensive income (USD) 625M 3.22B 3.22B 2.09B 2.82B 8.97B 6.61B 10.1B 6.5B 5.68B
Comprehensive income to owners (USD) 627M 3.22B 3.22B 2.08B 2.82B 8.96B 6.63B 10.1B 6.51B 5.7B
Provision for credit losses (USD) 94.3M 98.3M 90.8M — — — — — — —
Reported Feb 24, 2017 Dec 18, 2017 Dec 17, 2018 Dec 19, 2019 Aug 26, 2021 Dec 16, 2021 Dec 15, 2022 Dec 15, 2023 Dec 12, 2024 Dec 18, 2025

Sign up to see institutional holdings

Sign Up

Podcast Mentions

Sign up to see podcast mentions and sentiment

Sign Up

Built Around Our Customers Bull 0 Bear 0 Routine

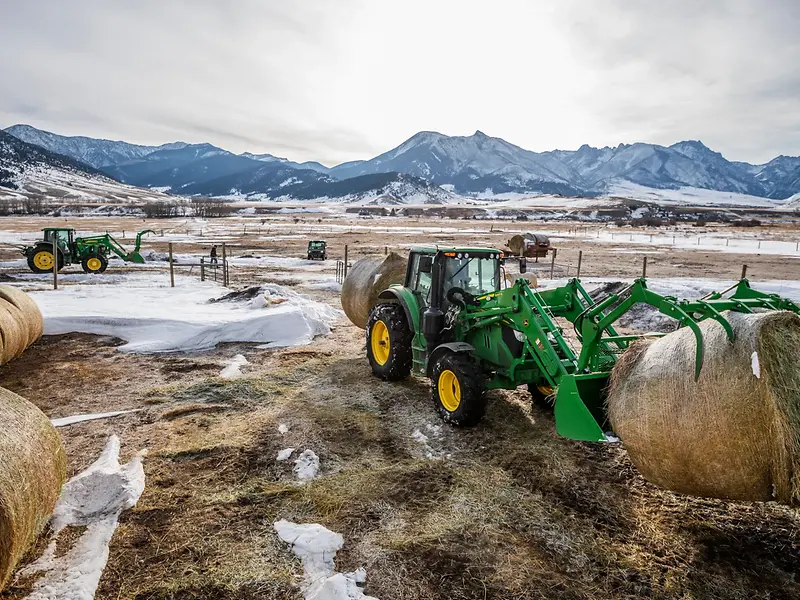
A snowy Montana scene as two tractors put up hay with mountains in the distance

For nearly 200 years, John Deere has helped our customers grow and build America. We're proud to equip farmers, ranchers, construction crews, and others with the equipment, technology, solutions, and support they need to keep running.

Our commitment to customers includes an industry-leading self-repair experience , a best-in-class dealer network of nearly 1,800 locations employing more than 50,000 people across the United States, and customer choice throughout the John Deere journey, from equipment and technology to parts, service, repair, and support.

With customers at the center of our work and our founder's ingenuity inspiring us, we continue to invest in American manufacturing and in solutions that help customers be productive, efficient, and successful. These efforts reflect four commitments: keeping customers running, delivering affordability and value, giving customers control, and building for the long term.

Keep Customers Running

At John Deere, we support our customers' ability to maintain, diagnose, repair, and protect their equipment. Through a range of tools and support options, we empower owners to keep their machines running efficiently while helping ensure safety, regulatory compliance, and machine quality.

Our commitment is to provide transparent, accessible repair options that meet customers' evolving needs. That includes industry-leading self-repair tools, parts choices, and support from the John Deere dealer network.

Deliver Affordability and Value

We know customers need options that fit their operations, budgets, and business goals. That’s why we offer flexible financing and payment options , along with a range of parts choices, including A&I and REMAN , to help customers manage costs and maximize the value of their investment.

We also provide retrofit and upgrade pathways that allow customers to add new capabilities to existing equipment. Technologies such as See & Spray™ can help customers reduce inputs and operating costs while getting more value from their machines throughout their lifecycle.

Give Customers Control

Every pass across a farm with John Deere equipment and technology generates data that can help farmers make better decisions. That data comes together in the John Deere Operations Center™ , where tools like JD™ AI help turn it into actionable recommendations that can save time and add value to an operation.

While we help put farm data to work, it's the customer's call who it is shared with because customers remain in control. That's the promise behind our Farmer Data Commitment . We believe data should create value for farmers, with trust at the center of how it is handled.

Build for the Long Term

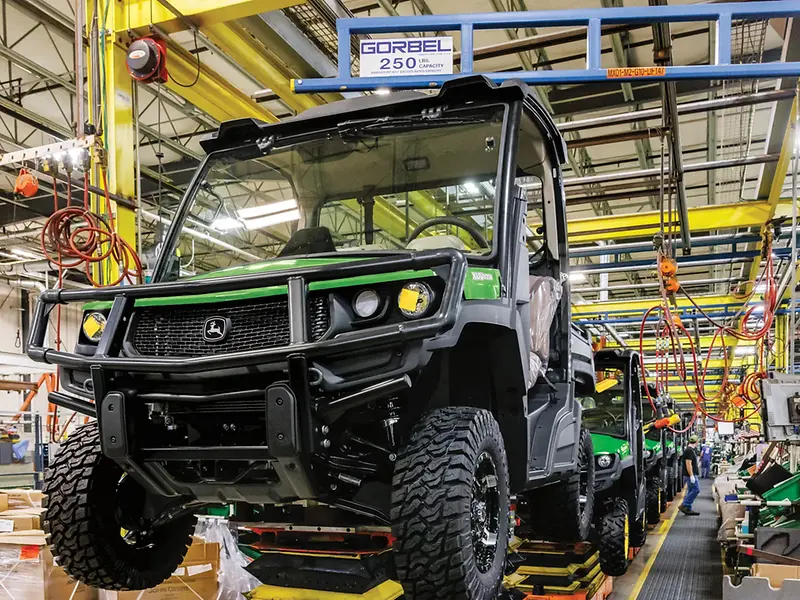
Today, John Deere operates more than 60 facilities in the United States across more than 20 states, more than anywhere else in the world. By concentrating investments in modern facilities, Deere is preserving and expanding critical U.S. manufacturing capabilities, supporting American manufacturing jobs, and maintaining its ability to serve customers well into the future.

We recently announced two major investments in U.S. manufacturing: expanding excavator production with a new facility in Kernersville, North Carolina, and breaking ground on a new parts distribution facility in Indiana. Both facilities are expected to open in 2027.


Topics

Corporate

Commitment

Images of equipment models may be digitally or AI generated, are for illustration purposes only, and are subject to change. Equipment models shown are typically base models and may not reflect all features, options, or attachments. Equipment availability may be limited. See your John Deere dealer for additional information. Features and specifications are based on published information at the time of publication and are subject to change without notice. See your dealer for available models, options, attachments, and pricing. Product options and accessories may not be available in all regions. Equipment, models, features, options, attachments, and prices may vary by dealer. John Deere reserves the right to change specifications, model features, design, and price of the products described here without notice.

Subscribe for more

Receive e-mail news & offers from John DeereSubscribe Now

Have any thoughts?

Take Survey

Products & Support

Company Information

News & Publications

Connect with John Deere

Enterprise Privacy Notice Accessibility Terms of Use Cookie Notice Contact Us Cookie Preferences

United States

Copyright © 2026 Deere & Company. All Rights Reserved.

Former EY U.S. CEO Julie Boland joins Board of Directors Bull 1 Bear 0 Management

Skip to main content

John Deere logo

Find a Dealer

Sign In EN

Home Products & SolutionsIndustriesParts & Owner SupportFinancingOur Company

Corporate

11/02/2026

Read time: 2 min.

SharePrint

Former EY U.S. CEO Julie Boland joins Deere & Company’s Board of Directors

MOLINE, Ill. (Nov. 2, 2026) – Deere & Company (NYSE: DE) today announced the appointment of Julie Boland, former U.S. chief executive officer and managing partner and Americas managing partner of Ernst & Young LLP (EY), to its board of directors. Boland brings extensive executive leadership experience and deep expertise in accounting, financial reporting, corporate governance, and global finance.

“Julie’s proven leadership, financial acumen, and governance expertise make her a strong addition to our board,” said John C. May, chairman and CEO of Deere & Company. “Her record leading a complex global organization, together with her finance and investment banking background, will sharpen the board’s perspective as Deere executes its strategy, accelerates long-term growth, and delivers value for customers and shareholders.”

Boland served as EY’s U.S. chief executive officer and managing partner and Americas managing partner from 2022 to 2026, culminating more than 16 years with the firm in roles of increasing responsibility. Her previous leadership positions included vice chair and Central Region managing partner and Cleveland office managing partner.

Before joining EY, Boland was chief financial officer at public and private companies and worked in investment banking at JPMorgan & Co. and Goldman Sachs in New York, Chicago, and London. Her experience spans financial leadership, enterprise strategy and transformation, capital allocation, regulatory affairs, risk management, and international banking.

Boland’s appointment expands Deere’s board from 10 to 11 members, including 10 independent, non-employee directors.

About Deere & Company

It doesn't matter if you've never driven a tractor, mowed a lawn, or operated a dozer. With John Deere's role in helping produce food, fiber, fuel, and infrastructure, we work for every single person on the planet. It all started nearly 200 years ago with a steel plow. Today, John Deere drives innovation in agriculture, construction, forestry, turf, power systems, and more.

Facility Updates

Skip to main content

John Deere logo

Find a Dealer

Sign In EN

Home Products & SolutionsIndustriesParts & Owner SupportFinancingOur Company

Company News

11/04/2026

Read time: 3 min.

SharePrint

John Deere Reaffirms Commitment to U.S. Manufacturing and Long-Term Competitiveness

Deer statue outside Headquarters with sunlight and green trees

Today, John Deere announced steps designed to strengthen its U.S. manufacturing operations and continue positioning the company for long-term growth.

The changes reaffirm Deere’s commitment to U.S. manufacturing by aligning production capacity with regional customer demand and advanced manufacturing capabilities. By concentrating investments in modern, high-use facilities, Deere intends to preserve and expand critical U.S. manufacturing capabilities, enhance competitiveness, support American manufacturing jobs, and maintain its ability to invest through business cycles while continuing to serve customers well into the future.

As markets, technologies, and customer expectations evolve, John Deere continually evaluates its manufacturing footprint to ensure it is well-positioned to serve customers and compete globally. That work includes streamlining operations, expanding capacity where it creates the most value, advancing automation and modern manufacturing technologies, and leveraging strategic sourcing to improve flexibility and cost competitiveness.

As part of this ongoing effort to optimize its manufacturing footprint, improve operational efficiency, and support continued investment in its U.S. operations John Deere is implementing the following manufacturing changes:

  • Windrowers and Round balers: Due to changes in customer demand, and available manufacturing capacities, Windrower production will relocate from Ottumwa Works to Des Moines Works by the end of fiscal year 2027, with round baler production planned to follow by the end of Fiscal Year 2028. Upon completion of the transition, Deere intends to close its factory in Ottumwa, Iowa.

  • STS Sprayers: Beginning in fiscal year 2028, production of Hagie STS sprayers will move to Deere’s factory in Thibodaux, Louisiana. As a result, Deere intends to end manufacturing operations at the Hagie factory in Clarion, Iowa, by fiscal year 2029.

  • Sugar Cane Harvesters: In fiscal year 2029, sugar cane harvester production will move from Thibodaux, Louisiana, and be consolidated in Catalão, Brazil, where Deere already manufacturers sugar cane harvesters. The move aligns production closer to the largest concentration of customer demand in South America and improves efficiency by consolidating production in a single location. Today, Thibodaux produces around 35 machines annually for the U.S. market.

  • Small planters: In fiscal year 2027, small planter production will move from John Deere Seeding in Moline, Illinois, to John Deere’s facility in Paton, Iowa.

  • Construction and Forestry: John Deere’s Construction and Forestry Division is evaluating strategic sourcing opportunities across its operations to strengthen competitiveness, increase flexibility, manage costs, and increase investment in critical capabilities, including product development, technology, field sales, and customer support. This evaluation reflects broader industry efforts to respond to shifting market conditions, evolving customer demand, and global cost pressures.

Customer, employee, and community impact

John Deere expects to continue serving customers without disruption throughout these changes. The company will manage the transitions carefully with the goal of maintaining product quality, availability, and service.

At the same time, John Deere recognizes the impact these decisions will have on employees and communities. Throughout the transition, the company will engage with employees, union representatives where applicable, local leaders, and community stakeholders, and is committed to identifying the best future use for the Ottumwa and Clarion sites.

Building a Stronger John Deere

Deere’s strategy remains centered on delivering value for customers, and the company’s commitment to U.S. manufacturing remains strong. These changes are designed to further strengthen the long-term competitiveness of John Deere’s manufacturing network and allow Deere to continue investing in American factories, advanced technologies, and its workforce—helping preserve U.S. manufacturing jobs while creating opportunities for future growth and innovation.


Topics

Company News

Corporate

Images of equipment models may be digitally or AI generated, are for illustration purposes only, and are subject to change. Equipment models shown are typically base models and may not reflect all features, options, or attachments. Equipment availability may be limited. See your John Deere dealer for additional information. Features and specifications are based on published information at the time of publication and are subject to change without notice. See your dealer for available models, options, attachments, and pricing. Product options and accessories may not be available in all regions. Equipment, models, features, options, attachments, and prices may vary by dealer. John Deere reserves the right to change specifications, model features, design, and price of the products described here without notice.

Subscribe for more

Receive e-mail news & offers from John DeereSubscribe Now

Have any thoughts?

Take Survey

Products & Support

Company Information

News & Publications

Connect with John Deere

Enterprise Privacy Notice Accessibility Terms of Use Cookie Notice Contact Us Cookie Preferences

United States

Copyright © 2026 Deere & Company. All Rights Reserved.

Prompts

Deere & Company (ticker DE), listed in United States.

Company History

Date Change Detail
May 31, 2007 Acquired Acquired Lesco Inc (CIK 745394). Its filings from before the deal are on its own company page, not shown here.

ETFs Holding Deere & Company

ETF Weight in ETF Shares Market value As of
ARKX 6.21% 58,655 $ 38.081M Nov 18, 2026
FBOT 5.18% 17,260 $ 11.304M Aug 31, 2026
PRCS 4.45% 11,805 $ 7.928M Sep 30, 2026
ARKQ 3.34% 97,002 $ 62.977M Nov 18, 2026
FMKT 3.08% 463 $ 302.797K Nov 17, 2026
PRVS 2.89% 1,181 $ 793.101K Sep 30, 2026
BKCG 2.32% 4,699 $ 2.785M Jul 31, 2026
CSNR 2.31% 3,318 $ 2.105M Jun 30, 2026
LOPP 2.23% 575 $ 364.74K Jun 30, 2026
BDVG 2.19% 468 $ 296.866K Jun 30, 2026
SPCT 2.12% 2,410 $ 1.428M Jul 31, 2026
TGLB 2.11% 932 $ 552.368K Jul 31, 2026
TGLR 2.02% 1,290 $ 764.544K Jul 31, 2026
JHAI 1.88% 743 $ 440.354K Jul 31, 2026
UPAR 1.77% 1,467 $ 959.403K Nov 17, 2026
DVND 1.73% 1,437 $ 911.532K Jun 30, 2026
MFUT 1.62% 1,845 $ 1.207M Nov 17, 2026
LCF 1.48% 1,510 $ 957.838K Jun 30, 2026
AIFD 1.48% 3,128 $ 1.854M Jul 31, 2026
RFFC 1.44% 717 $ 469.57K Aug 31, 2026
PRAY 1.35% 1,674 $ 1.062M Jun 30, 2026
ROPE 1.27% 483 $ 310K Nov 18, 2026
RPAR 1.25% 10,138 $ 6.63M Nov 17, 2026
SCLZ 1.18% 365 $ 231.53K Jun 30, 2026
ASLV 1.18% 4,337 $ 2.57M Jul 31, 2026
TFPN 1.17% 2,741 $ 1.793M Nov 17, 2026
LVDS 1.16% 2,138 $ 1.388M Nov 17, 2026
LRGC 1.10% 22,597 $ 14.799M Aug 31, 2026
FWD 1.06% 51,946 $ 34.02M Aug 31, 2026
CGGR 1.06% 408,423 $ 267.105M Nov 16, 2026
ESLV 1.01% 243 $ 144.019K Jul 31, 2026
CGDG 0.99% 90,490 $ 59.18M Nov 16, 2026
ACVU 0.98% 4,206 $ 0.00 Nov 18, 2026
CGBL 0.96% 116,686 $ 76.311M Nov 16, 2026
THRO 0.96% 151,741 $ 99.237M Nov 16, 2026
BKDV 0.93% 28,877 $ 17.115M Jul 31, 2026
FBCV 0.90% 2,682 $ 1.59M Jul 31, 2026
DFUV 0.82% 187,952 $ 127.58M Nov 12, 2026
DFLV 0.80% 90,532 $ 61.452M Nov 12, 2026
JGRO 0.79% 109,878 $ 71.336M Nov 17, 2026
LCDS 0.70% 172 $ 111.668K Nov 17, 2026
JOYT 0.68% 1,237 $ 803.098K Nov 17, 2026
SROI 0.67% 213 $ 126.239K Jul 31, 2026
AVLV 0.66% 230,432 $ 150.7M Nov 16, 2026
NBGX 0.61% 138 $ 90.378K Aug 31, 2026
ACLC 0.59% 2,952 $ 1.933M Aug 31, 2026
JAVA 0.58% 66,919 $ 43.446M Nov 17, 2026
DFVX 0.58% 4,906 $ 3.33M Nov 12, 2026
FFLV 0.55% 153 $ 90.679K Jul 31, 2026
AVSU 0.55% 4,038 $ 2.641M Nov 16, 2026
TVAL 0.55% 9,548 $ 6.244M Nov 17, 2026
CGGO 0.53% 95,453 $ 62.425M Nov 16, 2026
ACVF 0.51% 1,302 $ 771.656K Jul 31, 2026
RAAX 0.49% 9,796 $ 6.579M Sep 30, 2026
JEPI 0.48% 341,571 $ 221.758M Nov 17, 2026
BTAL 0.45% 2,024 $ 1.284M Jun 30, 2026
DYNF 0.45% 284,127 $ 185.816M Nov 16, 2026
TGRT 0.44% 10,912 $ 7.136M Nov 17, 2026
AVUS 0.43% 94,937 $ 62.088M Nov 16, 2026
CCNR 0.41% 2,973 $ 1.762M Jul 31, 2026
MPLY 0.41% 109 $ 64.601K Jul 31, 2026
AVLC 0.40% 9,562 $ 6.253M Nov 16, 2026
XMAG 0.39% 1,246 $ 845.772K Nov 13, 2026
HEQQ 0.37% 165 $ 107.123K Nov 17, 2026
HELO 0.37% 27,512 $ 17.862M Nov 17, 2026
MKTN short -0.36% -612 $ -388.21K Jun 30, 2026
BDVL short -0.36% -9,769 $ -6.389M Nov 16, 2026
ENHU 0.36% 51 $ 33.353K Nov 16, 2026
LCTU 0.36% 6,273 $ 4.102M Nov 16, 2026
DFSU 0.35% 12,330 $ 8.369M Nov 12, 2026
LDRX 0.34% 1,307 $ 855.967K Aug 31, 2026
JEPQ 0.31% 193,199 $ 125.431M Nov 17, 2026
NBCR 0.28% 3,706 $ 2.427M Aug 31, 2026
AAUS 0.28% 2,174 $ 1.41M Nov 18, 2026
DCOR 0.27% 181,981 $ 123.527M Nov 12, 2026
CLSE short -0.26% -3,623 $ -2.373M Aug 31, 2026
DFAC 0.26% 340,218 $ 230.937M Nov 12, 2026
JUSA 0.25% 3,335 $ 2.165M Nov 17, 2026
NTSD 0.25% 138 $ 87.538K Jun 30, 2026
FFLC 0.24% 4,954 $ 2.936M Jul 31, 2026
ACIO 0.24% 9,486 $ 5.622M Jul 31, 2026
DFUS 0.24% 76,053 $ 51.624M Nov 12, 2026
ADME 0.24% 1,164 $ 689.868K Jul 31, 2026
NTSX 0.23% 5,048 $ 3.202M Jun 30, 2026
GEW 0.23% 510 $ 334.004K Aug 31, 2026
GDE 0.23% 1,682 $ 1.102M Aug 31, 2026
VOXP 0.21% 21 $ 12.446K Jul 31, 2026
DFAU 0.21% 40,345 $ 27.386M Nov 12, 2026
APUE 0.21% 8,016 $ 5.25M Aug 31, 2026
VFMO 0.20% 5,722 $ 3.747M Aug 31, 2026
HCMT 0.18% 1,748 $ 1.036M Jul 31, 2026
EBI 0.16% 1,718 $ 1.125M Aug 31, 2026
TACU 0.16% 44 $ 28.776K Nov 17, 2026
MSLC 0.15% 9,430 $ 6.176M Aug 31, 2026
VSLU 0.13% 1,121 $ 711.084K Jun 30, 2026
INRO 0.13% 1,135 $ 742.279K Nov 16, 2026
DXUV 0.13% 11,519 $ 7.819M Nov 12, 2026
CSHP 0.09% 524 $ 342.691K Nov 16, 2026
GSPY 0.09% 957 $ 625.868K Nov 17, 2026
NPFE 0.02% 237 $ 140.463K Jul 31, 2026