Chevron Corporation is an integrated energy and chemicals company. Its upstream operations involve the exploration, development, production, and transportation of crude oil and natural gas, including liquefied natural gas (LNG) processing, carbon capture and storage, and gas-to-liquids. Downstream activities include refining crude oil into petroleum products, marketing fuels and lubricants, manufacturing renewable fuels, and producing commodity petrochemicals, plastics, and additives. The company transports crude oil and refined products via pipelines, marine vessels, motor equipment, and rail cars. Chevron serves customers in North America, South America, Europe, Africa, Asia, and Australia. Incorporated in 1926 as Standard Oil Company of California, the company adopted the name Chevron Corporation in 1984 and briefly operated as ChevronTexaco Corporation from 2001 to 2005.

Summarised from the company's own disclosures, fiscal year ended Feb 2026

Industry Oil & Gas Integrated Homepage chevron.com
Sector Energy IR page chevron.com/investors
Tags
crude oil, natural gas, liquefied natural gas, petroleum refining, petrochemicals, renewable fuels, carbon capture, gas-to-liquids, lubricants, plastics
Press page chevron.com/newsroom

Metrics

Valuation  
Market cap $ 416.939B
Market cap (USD) $ 416.939B
P/E 15.55
PEG —
P/BV 2.15
P/S 1.85
P/OCF 8.03
P/FCF 12.24
Dividend yield 3.3%
Turnover / mcap —
Returns  
ROE 7.3%
ROI 5.4%
ROIC 4.6%
Profit margin 6.7%
Growth  
Revenue growing No
Profits growing No
Revenue up 3y No
Revenue up 5y No
Earnings growth 3y (net profit CAGR) -29.7%
Quality  
Profitable Yes
Margin expanding No
Buying back stock No
Diluting (TTM) No
Debt/Equity 22.2%
Podcast bulls (TTM) Sign up
Podcast bears (TTM) Sign up
Podcast sentiment (TTM) Sign up
Podcast sentiment % (TTM) Sign up
News sentiment (TTM) 29
Quality score -10.5%
Insiders  
Buys, 1w Sign up
Buys, 1m Sign up
Buys, 1y Sign up
Sells, 1w Sign up
Sells, 1m Sign up
Sells, 1y Sign up

Sign up to see this company's insider trades

Figure FY 2025 FY 2024 FY 2023 FY 2022 FY 2021 FY 2020 FY 2019 FY 2018 FY 2017 FY 2016 FY 2015 FY 2014 FY 2013 FY 2012 FY 2011 FY 2010 FY 2009 FY 2008 FY 2007 FY 2006 FY 2005 FY 2004 FY 2003 FY 2002 FY 2001 FY 2000
Revenue 184.432B 193.414B 196.913B 235.717B 155.606B 94.471B 139.865B 158.902B 141.722B 114.472B 138.477B 211.97B 228.848B 241.909B 253.706B 204.928B 171.636B 273.005B 220.904B 210.118B 198.2B 155.3B 121.761B 99.049B — 52.129B
Net profit 12.299B 17.661B 21.369B 35.465B 15.625B -5.543B 2.924B 14.824B 9.195B -497M 4.587B 19.241B 21.423B 26.179B 26.895B 19.024B 10.483B 23.931B 18.688B 17.138B 14.099B 13.328B 7.23B 1.132B — 5.185B
Free cash flow 16.592B 15.044B 19.78B 37.628B 21.131B 1.655B 13.198B 16.826B 7.111B -5.263B -10.048B -3.932B -2.983B 7.874B 14.598B 11.747B -470M 9.966B 8.299B 10.51B 11.404B 8.38B 6.69B 2.344B 1.744B 5.005B

Figure FY 2025 FY 2024 FY 2023 FY 2022 FY 2021 FY 2020 FY 2019 FY 2018 FY 2017 FY 2016 FY 2015 FY 2014 FY 2013 FY 2012 FY 2011 FY 2010 FY 2009 FY 2008 FY 2007 FY 2006 FY 2005 FY 2004 FY 2003 FY 2002 FY 2001 FY 2000
Share price 152.41 144.84 149.16 179.49 117.35 84.45 120.51 108.79 125.19 117.7 89.96 112.18 124.91 108.14 106.4 91.25 76.99 73.97 89.05 70.17 — — — — — —
Price performance 12m 0.05 -0.03 -0.17 0.53 0.39 -0.3 0.11 -0.13 0.06 0.31 -0.2 -0.1 0.16 0.02 0.17 0.19 0.04 -0.17 0.27 — — — — — — —

Filed figures

Figure Dec 2016 Dec 2017 Dec 2018 Dec 2019 Dec 2020 Dec 2021 Dec 2022 Dec 2023 Dec 2024 Dec 2025
Balance sheet detail
Trade receivables (USD) 14.1B 15.4B 15.1B 13.3B 9.5B 16.4B 18.2B 17.6B 18.3B 16B
↳ YoY growth +9.6% +8.9% -2.0% -11.5% -28.7% +72.6% +11.0% -3.1% +4.0% -12.8%
↳ 5y CAGR -8.4% -6.1% -7.0% -4.5% -5.9% +3.1% +3.5% +3.2% +6.6% +11.0%
Borrowings, current (USD) 27.5B 17.3B 18.2B 13B 9.76B 5.2B 4.66B 2.18B 13.8B 7.96B
Borrowings, non-current (USD) 35.2B 33.5B 28.7B 23.7B 42.8B 31.1B 21.4B 20.3B 20.1B 39.8B
Lease liabilities (USD) — — — 4.19B 4.54B 4B 4.48B 5.87B 5.67B 7.43B
Cash and deposits (USD) 6.99B 4.81B 9.34B 6.91B 6.74B 6.8B 17.7B 8.18B 8.26B 7.29B
Right-of-use assets (USD) — — — 4.07B 3.95B 3.67B 4.26B 5.42B 5.32B 6.05B
Net debt (borrowings + leases - cash) (USD) 55.7B 46B 8.89B 34B 50.3B 33.5B 12.8B 20.2B 31.4B 47.9B
Cash flow detail
Operating cash flow (USD) 12.8B 20.5B 30.6B 27.3B 10.6B 29.2B 49.6B 35.6B 31.5B 33.9B
Purchases of property, plant and equipment (USD) -18.1B -13.4B -13.8B -14.1B -8.92B -8.06B -12B -15.8B -16.4B -17.3B
Change in receivables (cash effect) (USD) -2.12B -915M 437M 1.85B 2.42B -7.55B -2.32B 1.19B -932M 3.83B
Change in inventories (cash effect) (USD) 603M -267M -424M 7M 284M -530M -930M -320M -574M 51M
Change in payables (cash effect) (USD) 533M 875M -494M -109M -3.58B 5.48B 2.75B -49M 2.57B -3.47B
Dividends paid (cash effect) (USD) -8.03B -8.13B -8.5B -8.96B -9.65B -10.2B -11B -11.3B -11.8B -12.8B
Share buybacks (cash effect) (USD) -2M -1M -1.75B -4.04B -1.76B -1.38B -11.3B -14.9B -15.2B -12.1B
Interest paid (cash effect) (USD) -158M -265M -736M -810M -720M -699M -525M -465M -587M -942M
Income taxes paid (cash effect) (USD) -1.94B -3.13B -4.75B -4.82B -2.99B -4.36B -9.15B -10.4B -8.46B -7.3B
Operating cash flow before change in receivables (USD) 15B 21.4B 30.2B 25.5B 8.15B 36.7B 51.9B 34.4B 32.4B 30.1B
Free cash flow (OCF - PPE - intangibles) (USD) -5.26B 7.11B 16.8B 13.2B 1.66B 21.1B 37.6B 19.8B 15B 16.6B
Income detail
Research and development expense (USD) 476M 433M 453M 500M 435M 268M 268M 320M 353M 427M
↳ 5y CAGR -5.4% -7.7% -9.6% -6.7% -6.3% -10.9% -9.1% -6.7% -6.7% -0.4%
Total comprehensive income (USD) 17M 9.52B 15.5B 1.4B -6.18B 17.4B 36.7B 21.2B 17.9B 12.8B
Comprehensive income to owners (USD) -49M 9.45B 15.4B 1.48B -6.17B 17.3B 36.6B 21.2B 17.9B 12.6B
Reported Feb 23, 2017 Feb 22, 2018 Feb 21, 2020 Feb 21, 2020 Feb 25, 2021 Feb 24, 2022 Feb 23, 2023 Feb 26, 2024 Feb 21, 2025 Feb 24, 2026

Operating KPIs — quarters

KPI Dec 23 Mar 24 Jun 24 Sep 24 Dec 24 Mar 25 Dec 25 Mar 26
Production 3,392 3,346 3,319 3,364 3,350 3,353 4,045 3,858
↳ YoY growth +12.7% +12.3% +11.8% +6.9% -1.2% +0.2% +20.7% +15.1%
Reported Apr 26, 2024 Apr 26, 2024 Aug 2, 2024 Nov 1, 2024 May 2, 2025 May 2, 2025 May 1, 2026 May 1, 2026

Sign up to see institutional holdings

Sign Up

Podcast Mentions

Sign up to see podcast mentions and sentiment

Sign Up

Why El Segundo is called El Segundo Bull 0 Bear 0 Routine

3 min read | November 05, 2026

A refinery gave the city of El Segundo its name. More than a century later, the city and the refinery are still writing a shared story that reaches across Southern California.

Refinery General Manager Richard J. Hanna (right) and a colleague conferring on the beach close to the El Segundo wharf in the early 1900s. Richard’s wife, Virginia Hanna, named the new Standard Oil Co. of California refinery El Segundo.

By about 5:30 a.m., Hannah Schaaf, a Chevron operations section head, is arriving at Southern California’s El Segundo Refinery. At 6:00, she joins the incoming day crew to review what happened overnight and what comes next, from equipment needs to maintenance work and safety efforts.

She’s doing this work at the refinery that gave the city of El Segundo its name. In 1911, before El Segundo incorporated as a city, Standard Oil Co. of California (Socal) named its second California refinery El Segundo, Spanish for “the second.” A community grew around the facility and took the name, too.

The work behind everyday movement

The day’s plan doesn’t always survive unchanged.

When incoming crude quality varies, Schaaf’s team relies on flexibility and close coordination with the rest of the refinery to help ensure that products continue to meet the specifications necessary for terminals and suppliers.

“I love the complexity of the refinery because there’s always something new to figure out, and those challenges help people discover what they’re capable of.”

Hannah Schaaf
Chevron Operations Section Head

By the time fuel leaves Schaaf’s area, some is headed toward pipelines and terminals. One destination is nearby Los Angeles International Airport.

Chevron’s El Segundo Refinery supplies more than 35% of the jet fuel used at LAX and approximately 25% of Southern California’s motor vehicle fuel.

Keeping El Segundo competitive for the future

Schaaf’s team works against today’s operating plan. Some decisions require looking further ahead. That’s where Ryan Fisher, a Chevron delivery coordinator, enters the story.

His work moves between strategy and execution, from analyzing plans for a crude unit to considering how jet fuel moves across Chevron’s West Coast operations. Ryan Fisher describes part of the job as “putting the right molecules in the right places.”

“Good decisions solve today’s problems. Great decisions help people years from now.”

Ryan Fisher
Chevron Delivery Coordinator

Refinery-related economic activity supports 5,900 jobs across Los Angeles County. That reach is a modern expression of a relationship that dates back to El Segundo’s earliest years, when homes and businesses developed around the refinery and its workforce.

What it means to be part of the community

Karla Gomez, a Chevron CRE operations coordinator, works on both sides of the refinery gates, supporting the workplace inside and maintaining relationships with fellow community members outside.

Over multiple decades, Chevron has donated tens of millions of dollars and tens of thousands of volunteer hours in support of El Segundo and greater South Bay schools.

“We’re people who have the same goals that everyone else has. We’re here to help make sure that we care for the land where we sit and maintain the relationships that we hold.”

Karla Gomez
Chevron CRE Operations Coordinator

Lear

Did you know?

Some of El Segundo’s smallest residents have wings.

Members of Karla Gomez’s team work with an entomologist to maintain a habitat for the endangered El Segundo blue butterfly on refinery grounds, including the buckwheat the butterfly species relies on.

A legacy shaped by people

More than a century after a refinery supplied El Segundo’s name, the words “El Segundo” still appear on both sides of the refinery gate. What that shared name means continues to evolve with the city, the refinery and the people who connect them.

The next chapter is being shaped by the people doing the work today.

topics covered

related content

view archive

Chevron email updates

Subscribe to our newsletter to receive news and updates.

Sign up for the newsletter

© 2001 – 2026 Chevron Corporation. All rights reserved.

Back to top

2 min read | November 03, 2026

Chevron is finding better ways to help keep goods, materials and businesses moving.

American transportation depends on the diesel fuel that Chevron is working to provide.

A grocery store receives a shipment before sunrise. A delivery driver drops off a package ordered two days earlier. A farmer harvests crops that will soon be shipped across the country. A construction crew arrives at a project site to begin work.

Each of these moments depends on transportation fuels like diesel.

Diesel powers many of the trucks, trains, ships, farm machines and heavy equipment that move goods through the economy. Keeping that fuel available requires thousands of people working across refineries, supply networks, pipelines and biorefineries to safely produce and deliver it where it is needed.

In 2026, high refinery utilization rates helped Chevron maximize fuel production and support market supply.

1. Getting more fuel from existing refineries

Building new fuel-producing facilities takes time. Another, more efficient option is helping existing facilities run reliably so they can produce more.

Chevron increased U.S. refining capacity by nearly 20% during 2025. In 2026, the company’s U.S. refining throughput exceeded, on average, 1 million barrels per day, a company record. Those gains came from improvements in maintenance planning, greater feedstock flexibility and closer coordination between refinery, supply and commercial teams.

The result is straightforward: more fuel can enter the supply system without Chevron having to build new refineries.

2. Keeping refineries running reliably

Fuel production depends on equipment operating safely and consistently.

Through August 2026, Chevron’s U.S. refining system operated at approximately 96% crude utilization, compared with about 90% across the prior five-year period.

In practical terms, refineries spent more time turning crude oil into transportation fuels and less time operating below potential capacity.

3. Reaching record production levels

Strong system performance showed up across multiple refineries in 2026.

Chevron’s Pasadena , Pascagoula and El Segundo refineries all achieved record crude throughput. The company’s Richmond and Salt Lake City facilities also operated above plan.

Illustrated map of Chevron wholly owned refineries

Production records are the result of many individual actions, from maintenance and engineering work to daily operating decisions that help facilities run more effectively.

4. Producing more biodiesel and renewable diesel

Chevron’s renewable diesel and biodiesel facilities produced approximately 52 million gallons in August 2026, making August the first month in company history when production topped 50 million gallons. The company’s biodiesel facilities achieved historic feedstock processing rates, utilizing 70% of available vegetable oil capacity.

The milestone reflects growing production from facilities that add another source of transportation fuel to the overall system.

The bigger picture

Transportation fuels like diesel often appear as ordinary moments: a stocked grocery shelf, a delivered package, a completed construction project or a successful harvest.

Behind those moments is a network of refineries, biofuel facilities and people working to increase fuel supply safely and reliably. Chevron’s production improvements in 2026 show how changes across that network can help deliver more diesel, renewable diesel and biodiesel to the businesses and industries that depend on it.

  • Share this story on Facebook

  • Share this story on Twitter

  • Share this story on LinkedIn

  • Threads podcast

  • Apple podcast

  • Spotify podcast

  • Email this story

Chevron email updates

Subscribe to our newsletter to receive news and updates.

Sign up for the newsletter

© 2001 – 2026 Chevron Corporation. All rights reserved.

Back to top

4 min read | November 02, 2026

Chevron is finding better ways to help shape tomorrow’s energy landscape.

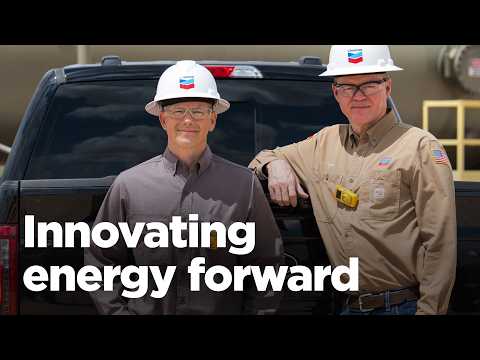
Ryder Booth, Chevron’s chief technology and engineering officer, recently appeared on The Energy Tailgate podcast to discuss how Chevron is innovating energy forward.

In the early 2000s, many experts feared that the world was running out of oil and gas. Yet since then, energy supplies have grown. One reason for this is that companies are producing more from the resources they already have. Another reason is that they’ve become better at finding new opportunities, acquiring them and developing them.

At Chevron, that work now runs through three people. Kevin McLachlan, Chevron’s vice president of Exploration, looks for what hasn’t been found yet. Jake Spiering, Chevron’s president of Corporate Business Development, looks for what can be acquired. And Ryder Booth, Chevron’s chief technology and engineering officer, looks for ways to get more from what Chevron already has.

Together, they cover Chevron’s three paths to resource growth: exploration, acquisitions and technology. Each plays a different role, but all three seek to answer the same underlying question: Which opportunities deserve continued investment? Their answers may help shape the world’s energy supply for years to come.

Explaining resources and reserves

Before exploring these three paths, it might be helpful to explain a commonly misunderstood concept in energy: the difference between a resource and a reserve. And the difference isn’t just technical; it’s legal.

Think of a resource as potential: something geologists believe exists and may eventually be producible. Some resources become reserves—a reserve is a resource that meets strict regulatory and financial reporting requirements. It can be developed using current technology and is backed by a development plan.

That difference matters because companies can report only what regulators recognize as reserves. A resource doesn’t “count” until it reaches that commercial and legal threshold.

By the numbers info graphic

Chevron has three paths to growth: exploration, acquisitions and technology.

Exploration path

Kevin McLachlan leads a team of people who spend their days searching for resources that are not yet discovered. His team pairs decades of exploration data with newer analytical tools. It’s much like upgrading from a paper map to GPS—the destination is the same, but the route becomes clearer. Exploration growth happens when Chevron finds resources that weren’t previously part of its portfolio.

“Our focus is more than just where to look; it is also how we can use technology to see the subsurface more clearly and how much faster we can find resources.”

Kevin McLachlan

Chevron Vice President of Exploration

Acquisition path

Exploration creates new opportunities. Acquisition allows companies to add promising resources and reserves that have already been identified. Jake Spiering evaluates opportunities to determine strategic fit, resource quality and long-term competitiveness rather than size; recent acquisition deals such as Hess, PDC Energy and Noble Energy added resources, reserves and capabilities in areas already known for strong oil and gas production.

“Every deal gets the same test. Does it fit our strategy, is the resource good enough to compete for our capital, and will it still be valuable years from now? If it can’t clear all three, we pass.”

Jake Spiering

Chevron President of Corporate Business Development

Technology path

The third path grows resources without a new discovery or deal—it unlocks value from what Chevron already has. Ryder Booth works with specialists across the company to translate technical and economic information into investment decisions, combining historical exploration archives with modern analytics. Horizontal drilling and hydraulic fracturing have proven again that an existing asset does not have to change; new technology used in development can breathe new life into an asset.

In the third episode of The Energy Tailgate podcast, podcast host Tanner Foust and Ryder Booth, Chevron’s chief technology and engineering officer, discuss new technology that’s driving success and helping Chevron meet the world’s growing demand for energy.

Why all three matter

No single path does all the work. Exploration turns up what wasn’t there before. Acquisitions bring in resources—and the people who know how to run them. Technology takes both and stretches them further than they could go alone. Some years, one path pulls more weight than the others. But none of them replaces the need for the other two.

For McLachlan, Spiering and Booth, the work comes back to one practical consideration: which opportunities have enough technical, commercial and legal merit to move forward with.

“Some years exploration carries more of the load. Some years it’s a deal, and some years it’s technology. Over time, we need all three, because no single path can keep supplying the energy people will need.”

Jake Spiering

Chevron President of Corporate Business Development

topics covered

related content

view archive

Chevron email updates

Subscribe to our newsletter to receive news and updates.

Sign up for the newsletter

© 2001 – 2026 Chevron Corporation. All rights reserved.
Back to top

Prompts

Chevron Corporation (ticker CVX), listed in United States.

Company History

Date Change Detail
Oct 19, 2001 Renamed CHEVRON CORP → CHEVRONTEXACO CORP

ETFs Holding Chevron Corporation

ETF Weight in ETF Shares Market value As of
WEEI 14.68% 73,351 $ 14.438M Jul 31, 2026
TNGY 7.48% 212,553 $ 43.816M Aug 31, 2026
SGRT 5.35% 13,392 $ 2.908M Nov 17, 2026
DIVN 5.07% 75,464 $ 15.556M Aug 31, 2026
STRN 4.97% 5,769 $ 1.253M Nov 17, 2026
FMKT 4.91% 2,226 $ 483.354K Nov 17, 2026
OMAH 4.70% 240,722 $ 52.27M Nov 17, 2026
DOGG 4.58% 20,891 $ 4.456M Nov 11, 2026
NBET 4.49% 10,805 $ 2.127M Jul 31, 2026
LENS 4.40% 12,668 $ 2.72M Nov 18, 2026
DIVL 4.24% 15,390 $ 2.551M Jun 30, 2026
NLSI 4.21% 936 $ 191.141K Sep 30, 2026
ACEP 4.09% 18,824 $ 4.03M Nov 18, 2026
DIVZ 4.01% 64,611 $ 10.71M Jun 30, 2026
DDDD 3.98% 1,430 $ 310.51K Nov 17, 2026
DIVO 3.96% 1,718,861 $ 284.918M Jun 30, 2026
TBG 3.94% 61,363 $ 13.15M Nov 18, 2026
BLCV 3.80% 62,943 $ 13.667M Nov 16, 2026
GEND 3.78% 933 $ 183.642K Jul 31, 2026
SIXA 3.68% 96,724 $ 20.926M Nov 12, 2026
BDVG 3.57% 2,920 $ 484.019K Jun 30, 2026
BDIV 3.50% 1,188 $ 233.834K Jul 31, 2026
FDV 3.37% 150,674 $ 29.657M Jul 31, 2026
MDLV 3.36% 7,559 $ 1.62M Nov 18, 2026
GQGU 3.33% 112,551 $ 18.656M Jun 30, 2026
FCUS 3.31% 11,355 $ 2.466M Nov 17, 2026
CCOR 3.10% 4,402 $ 866.446K Jul 31, 2026
NRES 3.07% 5,572 $ 1.149M Aug 31, 2026
AVIE 2.91% 2,230 $ 484.222K Nov 16, 2026
TURF 2.86% 27,043 $ 4.483M Jun 30, 2026
INCE 2.81% 21,439 $ 3.554M Jun 30, 2026
TGLR 2.81% 5,403 $ 1.063M Jul 31, 2026
FLV 2.76% 51,039 $ 10.521M Aug 31, 2026
CSTK 2.71% 24,243 $ 4.772M Jul 31, 2026
BEEX 2.64% 22,720 $ 4.933M Nov 17, 2026
BBLU 2.55% 58,664 $ 12.57M Nov 18, 2026
PRMR 2.36% 10,487 $ 2.162M Aug 31, 2026
DFUV 2.17% 1,572,316 $ 340.171M Nov 12, 2026
MFSV 2.13% 62,156 $ 12.813M Aug 31, 2026
FRIZ 2.12% 670 $ 111.059K Jun 30, 2026
SPCT 2.12% 7,230 $ 1.423M Jul 31, 2026
PAYR 2.11% 6,116 $ 1.204M Jul 31, 2026
GOP 2.02% 8,139 $ 1.767M Nov 17, 2026
USMC 1.97% 414,190 $ 68.656M Jun 30, 2026
BLCR 1.95% 868,701 $ 188.63M Nov 16, 2026
DFLV 1.93% 686,962 $ 148.624M Nov 12, 2026
SELV 1.88% 27,851 $ 4.617M Jun 30, 2026
SAMT 1.88% 99,180 $ 16.44M Jun 30, 2026
DVND 1.84% 5,839 $ 967.873K Jun 30, 2026
CAMX 1.78% 6,168 $ 1.214M Jul 31, 2026
BALI 1.78% 126,011 $ 27.362M Nov 16, 2026
BUSA 1.75% 31,572 $ 5.233M Jun 30, 2026
VFMV 1.62% 35,572 $ 7.333M Aug 31, 2026
WCAP 1.61% 4,986 $ 981.394K Jul 31, 2026
JHDV 1.61% 1,179 $ 195.431K Jun 30, 2026
DYNF 1.44% 2,734,651 $ 593.802M Nov 16, 2026
HIDV 1.35% 13,456 $ 2.774M Aug 31, 2026
OEI 1.29% 3,043 $ 598.954K Jul 31, 2026
SHRT 1.29% 765 $ 166.112K Nov 17, 2026
GINX 1.26% 6,528 $ 1.346M Aug 31, 2026
LQAI 1.20% 124 $ 26.827K Nov 12, 2026
DIVD 1.19% 1,520 $ 330K Nov 18, 2026
UPAR 1.18% 2,928 $ 635.786K Nov 17, 2026
INCM 1.13% 109,517 $ 18.154M Jun 30, 2026
INFO 1.10% 47,257 $ 10.391M Nov 13, 2026
JAVA 1.08% 374,516 $ 80.278M Nov 17, 2026
AVLV 1.06% 1,120,165 $ 243.233M Nov 16, 2026
BIGY 1.06% 1,362 $ 295.745K Nov 17, 2026
THRO 1.04% 497,557 $ 108.04M Nov 16, 2026
TIME 1.03% 700 $ 151.998K Nov 17, 2026
XMAG 0.99% 9,885 $ 2.139M Nov 13, 2026
FELV 0.98% 189,205 $ 31.363M Jun 30, 2026
SFTY 0.92% 35,184 $ 7.253M Aug 31, 2026
STOX 0.91% 9,932 $ 2.047M Aug 31, 2026
GMOV 0.91% 4,730 $ 975.042K Aug 31, 2026
DFVX 0.88% 23,304 $ 5.042M Nov 12, 2026
INRO 0.87% 23,565 $ 5.117M Nov 16, 2026
SGLC 0.84% 8,665 $ 1.786M Aug 31, 2026
TFPN 0.82% 5,777 $ 1.254M Nov 17, 2026
WTV 0.81% 143,164 $ 23.731M Jun 30, 2026
RPAR 0.80% 19,467 $ 4.227M Nov 17, 2026
FFND 0.79% 3,770 $ 777.148K Aug 31, 2026
SCLZ 0.78% 925 $ 153.328K Jun 30, 2026
PHEQ 0.77% 6,542 $ 1.084M Jun 30, 2026
FTLS 0.77% 92,323 $ 0.00 Nov 16, 2026
LDRX 0.76% 9,364 $ 1.93M Aug 31, 2026
DCOR 0.74% 1,532,532 $ 331.563M Nov 12, 2026
GSPY 0.73% 23,111 $ 5.018M Nov 17, 2026
PEPS 0.71% 1,246 $ 206.537K Jun 30, 2026
ENHU 0.71% 306 $ 66.445K Nov 16, 2026
LGDX 0.71% 4,461 $ 968.662K Nov 17, 2026
TVAL 0.71% 37,174 $ 8.072M Nov 17, 2026
AVUS 0.70% 465,538 $ 101.087M Nov 16, 2026
AVLC 0.69% 49,881 $ 10.831M Nov 16, 2026
DFAC 0.67% 2,703,100 $ 584.816M Nov 12, 2026
NBCR 0.66% 27,327 $ 5.633M Aug 31, 2026
OTGL 0.66% 1,120 $ 185.651K Jun 30, 2026
AAUS 0.65% 15,520 $ 3.33M Nov 18, 2026
FTHI 0.60% 70,032 $ 15.207M Nov 16, 2026
HUSV 0.60% 1,588 $ 344.818K Nov 16, 2026