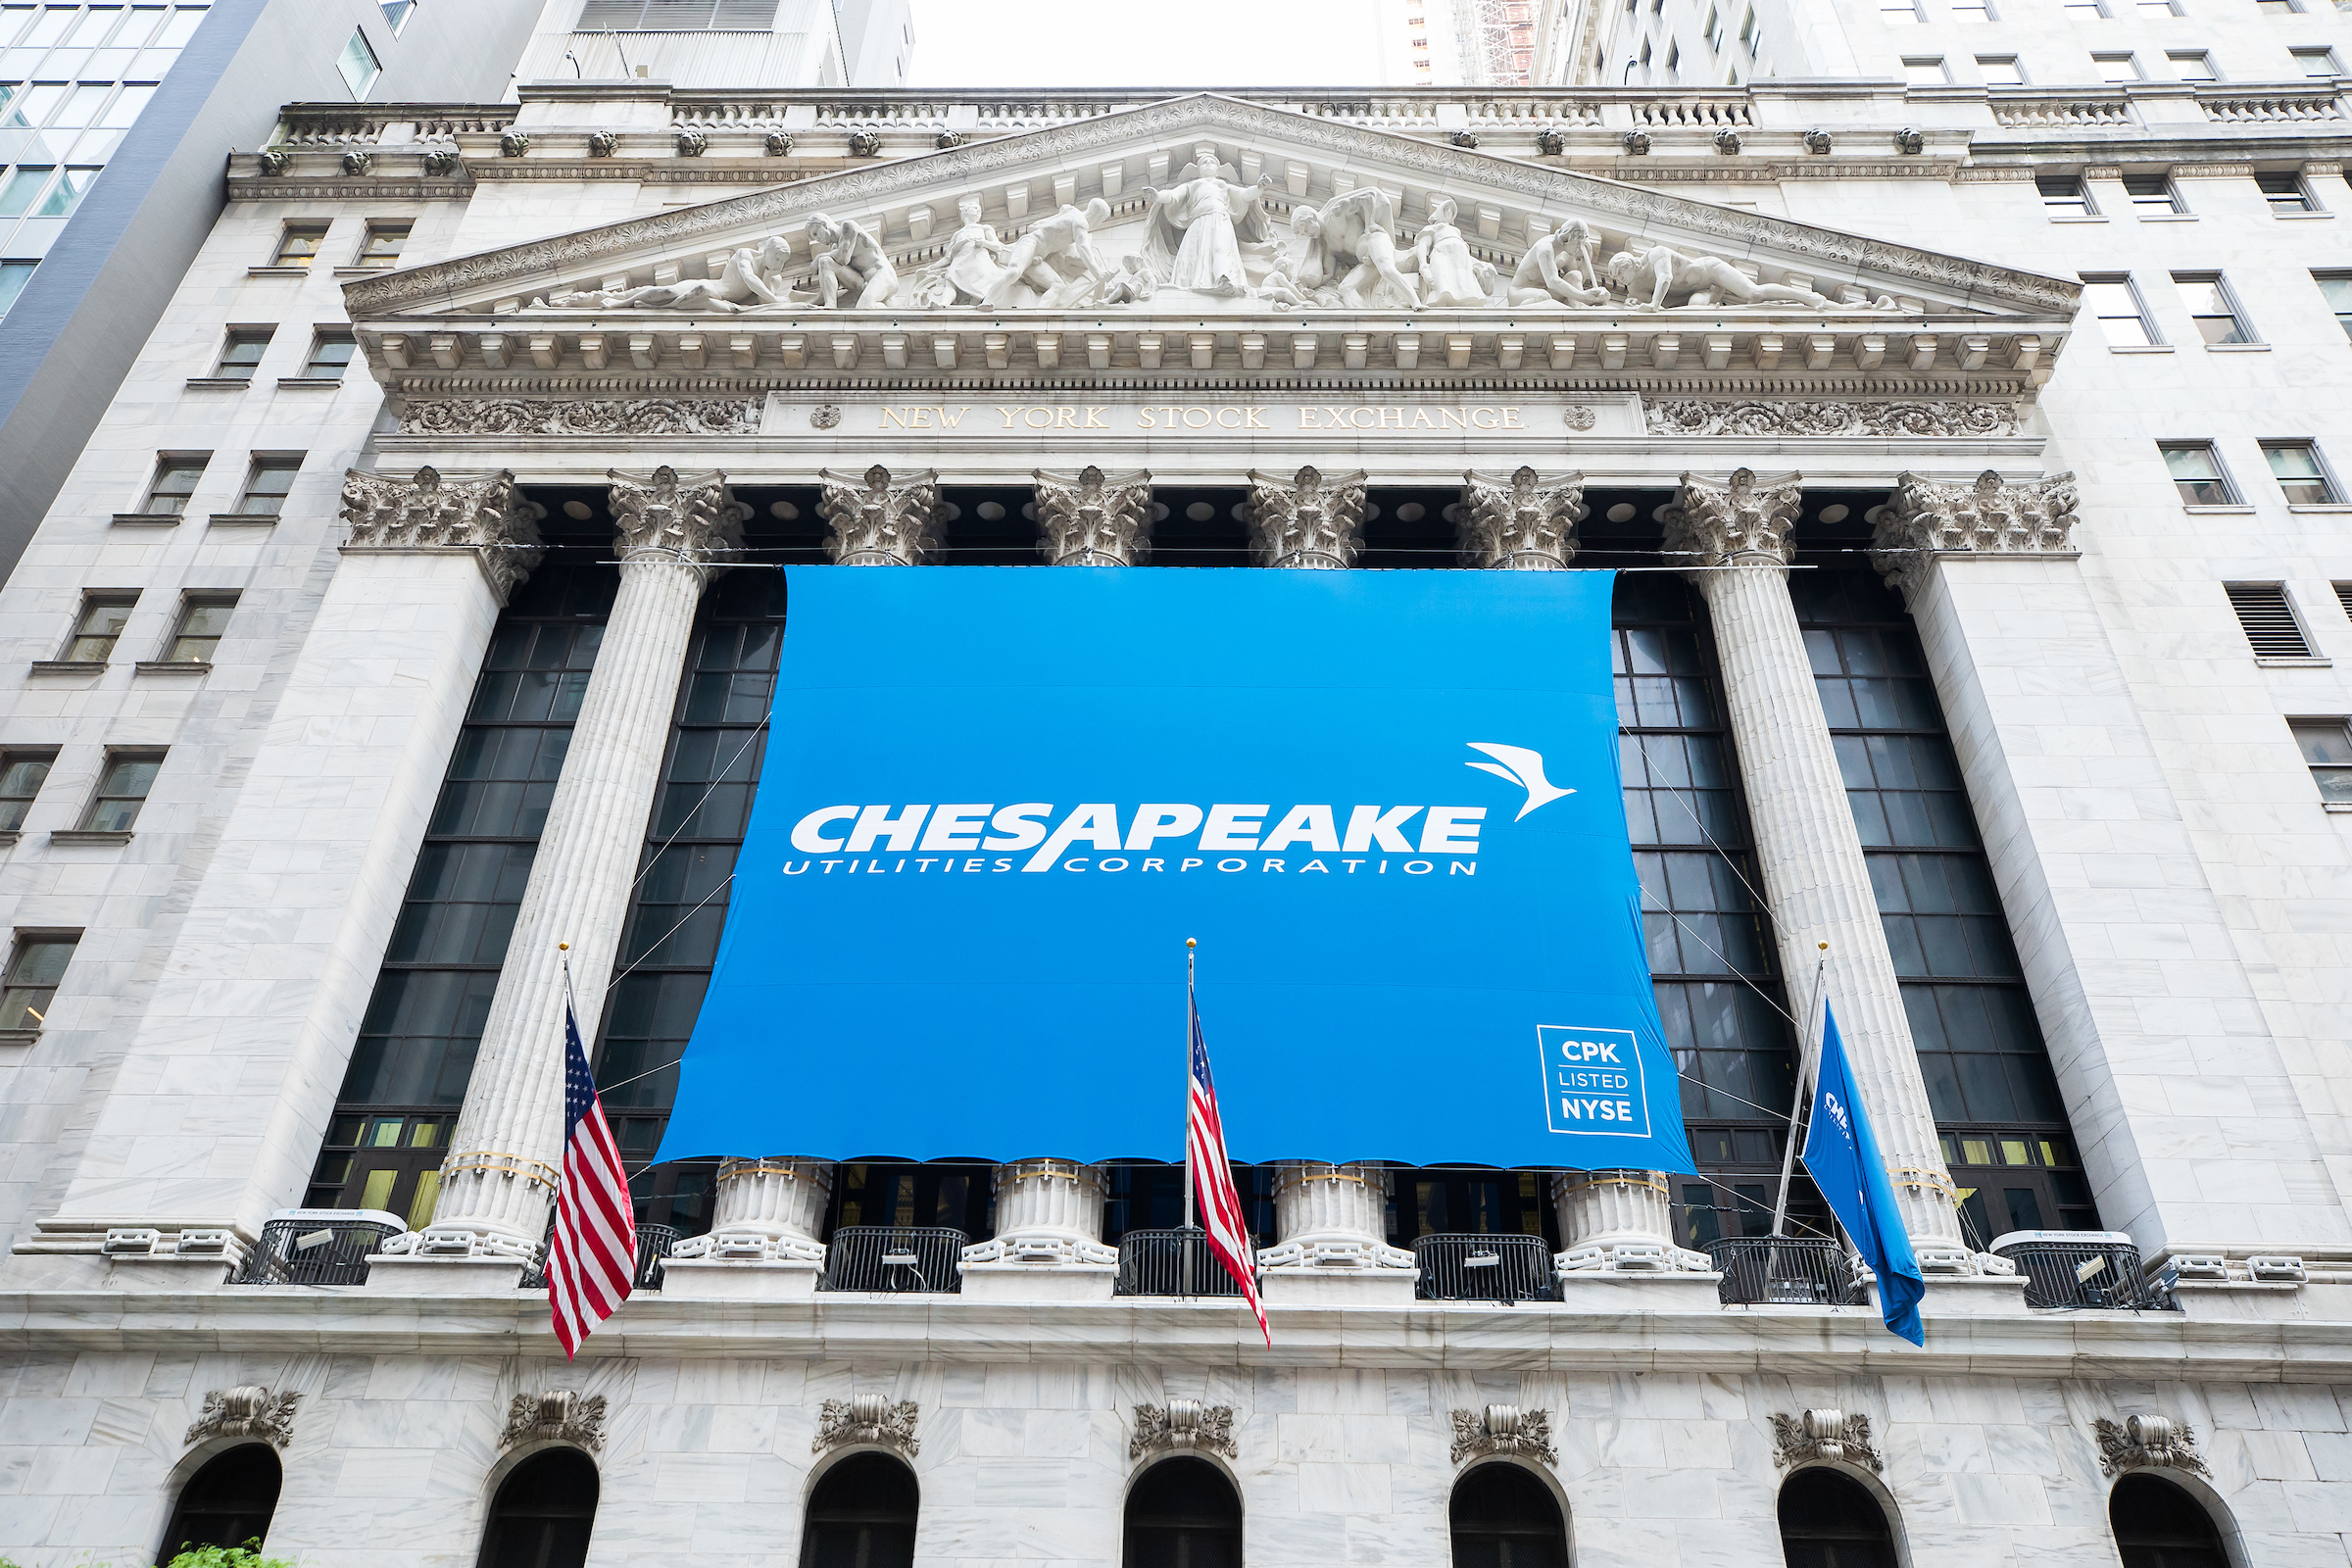
Chesapeake Utilities Corporation is an energy delivery company operating primarily in the Mid-Atlantic region, North Carolina, South Carolina, Florida, and Ohio. The company distributes natural gas, electricity, and propane, transmits natural gas, and generates electricity and steam. Its operations are divided into Regulated Energy and Unregulated Energy segments. Key subsidiaries include Florida Public Utilities Company, Central Florida Gas Company, Delmarva Natural Gas, Eastern Shore Natural Gas Company, Peninsula Pipeline, Aspire Energy Express, and Marlin Gas Services. The company serves residential, commercial, and industrial customers in states including Delaware, Maryland, Pennsylvania, Florida, and Ohio. Notable services include mobile compressed natural gas transport, liquefied natural gas and renewable natural gas transport, and methane capture. The company was formed in 1947 and evolved from Dover Gas Light Company.

Summarised from the company's own disclosures, fiscal year ended Feb 2026

Industry Utilities - Regulated Gas Homepage chpk.com
Sector Utilities IR page chpk.com/investors
Tags
natural gas distribution, electricity distribution, propane distribution, natural gas transmission, electricity generation, compressed natural gas transport, renewable natural gas, methane capture, combined heat and power, regulated utilities, Florida Public Utilities Company, Central Florida Gas Company, Delmarva Natural Gas, Eastern Shore Natural Gas Company, Peninsula Pipeline, Aspire Energy Express, Marlin Gas Services, Sharp Energy, Eight Flags Energy, FCG, FPU, Sandpiper Energy, Elkton Gas, Mitchell’s Gas Service, Clarence E. Sharp Company, Cambridge Gas Company, Plant City Natural Gas Company, Kellam Energy Inc., Chipola Propane Gas Company, Ohl Propane, Boulden Propane, Gatherco Inc., Aspire Energy of Ohio LLC, Dover Gas Light Company, Citizens Gas Company, Sussex Gas Company
Press page chpk.com/newsroom

Metrics

Valuation  
Market cap $ 3.141B
Market cap (USD) $ 3.141B
P/E 20.29
PEG 1.27
P/BV 1.85
P/S 3.11
P/OCF 9.32
P/FCF -15.06
Dividend yield 2.2%
Turnover / mcap —
Returns  
ROE 9.4%
ROI 4.6%
ROIC 6.1%
Profit margin 15.1%
Growth  
Revenue growing Yes
Profits growing Yes
Revenue up 3y No
Revenue up 5y No
Earnings growth 3y (net profit CAGR) 16.0%
Quality  
Profitable Yes
Margin expanding No
Buying back stock No
Diluting (TTM) No
Debt/Equity 84.6%
Podcast bulls (TTM) Sign up
Podcast bears (TTM) Sign up
Podcast sentiment (TTM) Sign up
Podcast sentiment % (TTM) Sign up
News sentiment (TTM) 26
Quality score 0%
Insiders  
Buys, 1w Sign up
Buys, 1m Sign up
Buys, 1y Sign up
Sells, 1w Sign up
Sells, 1m Sign up
Sells, 1y Sign up

Sign up to see this company's insider trades

Figure FY 2025 FY 2024 FY 2023 FY 2022 FY 2021 FY 2020 FY 2019 FY 2018 FY 2017 FY 2016 FY 2015 FY 2014 FY 2013 FY 2012 FY 2011 FY 2010 FY 2009 FY 2008 FY 2007 FY 2006 FY 2005 FY 2004 FY 2003 FY 2002 FY 2001 FY 2000
Revenue 930M 787.2M 670.604M 680.704M 569.968M 488.198M 479.604M 717.489M 617.583M 498.86M 459.244M 498.834M 444.306M 392.502M 418.027M 427.546M 268.785M — 258.286M 231.201M 229.63M 177.955M 157.151M 142.23M 330.321M 335.407M
Net profit 140.3M 118.6M 87.212M 89.796M 83.466M 71.498M 65.153M 56.58M 58.124M 44.675M 41.14M 36.092M 32.787M 28.863M 27.622M 26.056M 15.897M 13.607M 13.198M 10.507M 10.468M 9.429M 6.692M 3.729M 6.722M 7.489M
Free cash flow -214.9M -115.9M 14.864M 30.606M -36.42M -6.595M -81.763M -122.989M -65.24M -66.49M -39.476M -17.88M -24.189M -6.135M 24.084M 15.481M 19.206M -2.213M -5.596M -18.729M -19.72M — — — -13.735M —

Figure FY 2025 FY 2024 FY 2023 FY 2022 FY 2021 FY 2020 FY 2019 FY 2018 FY 2017 FY 2016 FY 2015 FY 2014 FY 2013 FY 2012 FY 2011 FY 2010 FY 2009 FY 2008 FY 2007 FY 2006 FY 2005 FY 2004 FY 2003 FY 2002 FY 2001 FY 2000
Share price 124.76 121.35 105.63 118.18 145.81 108.21 95.83 81.3 78.55 66.95 56.75 49.66 60.02 45.4 43.39 41.54 31.98 31.63 30.73 30.25 30.61 — — — — —
Price performance 12m 0.03 0.15 -0.11 -0.19 0.35 0.13 0.18 0.04 0.17 0.18 0.14 -0.17 0.32 0.05 0.04 0.3 0.01 0.03 0.02 -0.01 — — — — — —

Filed figures

Figure Dec 2016 Dec 2017 Dec 2018 Dec 2019 Dec 2020 Dec 2021 Dec 2022 Dec 2023 Dec 2024 Dec 2025
Balance sheet detail
Trade receivables (USD) 62.8M 77.2M 85.4M 49.6M 56.9M 58.5M 62.9M 71.8M 76.7M 102M
↳ YoY growth +53.2% +23.0% +10.6% -42.0% +14.8% +2.8% +7.5% +14.2% +6.8% +32.3%
↳ 5y CAGR -3.9% +7.5% +2.6% -1.4% +6.8% -1.4% -4.0% -3.4% +9.1% +12.3%
Borrowings, current (USD) 222M 260M 306M 293M 189M 240M 224M 198M 222M 293M
Borrowings, non-current (USD) 137M 197M 316M 440M 508M 550M 578M 1.19B 1.26B 1.33B
Lease liabilities (USD) — — — 11.6M 11.6M 10.6M 14.9M 13M 11.1M 7.9M
Cash and deposits (USD) 4.18M 5.61M 6.09M 6.99M 3.5M 4.98M 6.2M 4.9M 7.9M 1.8M
Intangible assets (USD) 1.84M 4.69M 6.21M 8.13M 8.29M 13.2M 17.9M 16.9M 15M 13.2M
Right-of-use assets (USD) — — — 11.6M 11.2M 10.1M 14.4M 12.4M 10.5M 9.9M
Net debt (borrowings + leases - cash) (USD) 355M 452M 616M 738M 706M 795M 811M 1.39B 1.49B 1.63B
Cash flow detail
Operating cash flow (USD) 103M 110M 147M 103M 159M 151M 159M 203M 239M 234M
Purchases of property, plant and equipment (USD) -170M -175M -270M -185M -166M -187M -128M -189M -355M -449M
Change in receivables (cash effect) (USD) -27M -19.5M -16.3M 36.5M -7.43M -1.63M -11.2M 2.27M -10.3M -37.1M
Change in inventories (cash effect) (USD) -2.53M -9.04M 2.11M 8.23M 1.71M -9.52M -7.85M 293,000 3.3M -600,000
Change in payables (cash effect) (USD) 18.8M 15.6M 35.9M -62M 4.94M 8.29M 2.72M -16.8M 400,000 13.3M
Dividends paid (cash effect) (USD) -17.5M -19.9M -22M -24.7M -27.2M -31.5M -35.1M -40M -54.2M -60.7M
Share buybacks (cash effect) (USD) — — -706,000 -721,000 22.6M 15.9M 4.53M — — —
Interest paid (cash effect) (USD) -10.3M -12.4M -16.7M -22.6M -22.9M -20.8M -24.3M -30.5M -73M -73.2M
Income taxes paid (cash effect) (USD) 5.31M 4.11M -477,000 -3.22M 8.14M -8.4M 4.96M -21.9M -9.4M -16M
Share-based compensation (USD) 2.37M 2.49M 2.81M 4.28M 4.83M 5.95M 6.44M 7.62M 8.4M 8.5M
Operating cash flow before change in receivables (USD) 130M 130M 163M 66.5M 166M 152M 170M 201M 250M 271M
Free cash flow (OCF - PPE - intangibles) (USD) -66.5M -65.2M -123M -81.8M -6.6M -36.4M 30.6M 14.9M -116M -215M
Income detail
Total comprehensive income (USD) 45.6M 58.7M 55M 65.7M 74.9M 87.6M 87.1M 85.9M 120M 139M
Comprehensive income to owners (USD) 45.6M 58.7M 55M 65.7M 74.9M 87.6M 87.1M 85.9M 120M 139M
Reported Feb 28, 2017 Mar 1, 2018 Feb 24, 2021 Feb 24, 2021 Feb 23, 2022 Feb 23, 2022 Feb 22, 2023 Feb 21, 2024 Feb 26, 2025 Feb 25, 2026

Sign up to see institutional holdings

Sign Up

Podcast Mentions

Sign up to see podcast mentions and sentiment

Sign Up

The information set forth in Item 2.03 with respect to the certain Note Purchase Agreement, dated November 10, 2026 (the “Note Purchase Agreement”), by and among Chesapeake Utilities Corporation, a Delaware corporation (the “Company”) and the purchasers named therein (collectively, the “Purchasers”) is incorporated herein in its entirety.

Creation of a Direct Financial Obligation or an Obligation under an Off-Balance Sheet Arrangement of a Registrant

Note Purchase Agreement On November 10, 2026, the Company and the Purchasers executed the Note Purchase Agreement which authorized the sale and purchase of $250 million of aggregate principal amount of unsecured senior notes (collectively, the “Senior Notes”). $150 million of the Senior Notes closed and funded on November 10, 2026 and $100 million is expected to fund on or about December 10, 2026.

NYSE Symbol: CPK Bull 3 Bear 0 Results

CHESAPEAKE UTILITIES CORPORATION REPORTS

THIRD QUARTER 2026 RESULTS

•Net income and earnings per share ("EPS")* were $21.6 million and $0.89, respectively, for the third quarter of 2026 and $106.3 million and $4.40, respectively, for the nine months ended September 30, 2026 with a year-to-date growth rate of 8.4 percent on Adjusted EPS**

•Adjusted gross margin** growth of $11.5 million for the third quarter of 2026 and $42.7 million year to date, representing a 9.2 percent growth rate for the nine months ended September 30, 2026, driven largely by regulatory initiatives and infrastructure programs, transmission expansion projects, natural gas organic growth, improved contributions from our unregulated businesses, and increased customer consumption.

•Announced a joint venture agreement with NextEra Energy Resources to finance and own 49 percent of the Florida Energy Pathway ("FEP") project, a $1.2 billion, 97-mile intrastate natural gas transmission infrastructure project that supports energy reliability in South Florida.

Home |Uncategorized |Chesapeake Utilities Corporation Reports Third Quarter 2026 Results

Home | Newsroom | Chesapeake Utilities Corporation Reports Third Quarter 2026 Results

2026-11-05T16:33:33-05:00November 5, 2026|

Chesapeake Utilities Corporation Reports Third Quarter 2026 Results

  • Net income and earnings per share (“EPS”)* were $21.6 million and $0.89, respectively, for the third quarter of 2026 and $106.3 million and $4.40, respectively, for the nine months ended September 30, 2026 with a year-to-date growth rate of 8.4 percent on Adjusted EPS**
  • Adjusted gross margin** growth of $11.5 million for the third quarter of 2026 and $42.7 million year to date, representing a 9.2 percent growth rate for the nine months ended September 30, 2026, driven largely by regulatory initiatives and infrastructure programs, transmission expansion projects, natural gas organic growth, improved contributions from our unregulated businesses, and increased customer consumption.
  • Announced a joint venture agreement with NextEra Energy Resources to finance and own 49 percent of the Florida Energy Pathway (“FEP”) project, a $1.2 billion, 97-mile intrastate natural gas transmission infrastructure project that supports energy reliability in South Florida.

Dover, Delaware — Chesapeake Utilities Corporation (NYSE: CPK) (“Chesapeake Utilities” or the “Company”) today announced financial results for the three and nine months ended September 30, 2026.

Additional highlights include:

  • Invested $151.2 million of capital during the third quarter of 2026, bringing the year-to-date total to $412.8 million and on track to meet 2026 capital expenditure guidance of $550 – $600 million.
  • Florida City Gas (“FCG”) interim rate increase of $16.2 million on an annualized basis became effective in July 2026 following approval by the Florida Public Service Commission. The Company participated in rate case hearings in late September and expects a final decision on the FCG rate case in December 2026.
  • Established a new at-the-market equity offering program that provides the option to issue and sell up to $225 million of common stock to support the Company’s strategic growth initiatives in the coming years. This program includes forward sale agreements which provide additional financing optionality regarding pricing and timing of equity issuances.

“In the third quarter, we demonstrated continued earnings growth and made progress on the transformation of our business as we prepare for our next phase of growth and drive value for our customers and communities,” said Jeff Householder, the Company’s Chair of the Board, President and Chief Executive Officer. “We are also excited to move forward with the FEP project through a strategic partnership with NextEra Energy Resources, which supports our disciplined approach to capital deployment and infrastructure investment. We believe we are well positioned to expand natural gas transportation capacity to meet growing customer demands in one of the nation’s fastest-growing regions.

**Read More **

**« Return to Newsroom ** Print or Save as PDF

News Alerts

For breaking news on Chesapeake Utilities Corporation and our family of businesses, sign up for News Alerts.
Sign up »

Chesapeake

500 Energy Lane
Dover, Delaware 19901

CPK

Chesapeake Utilities Corporation (“Chesapeake Utilities”) is a diversified energy delivery company listed on the New York Stock Exchange under the ticker symbol “CPK” (NYSE:CPK). Chesapeake Utilities is not, nor has it ever been, affiliated with Chesapeake Energy Corporation.

About

Toggle Navigation

Our Businesses

Toggle Navigation

Investors

Toggle Navigation

Safety

Toggle Navigation

Community

Toggle Navigation

Careers

Toggle Navigation

© 2026 Chesapeake Utilities Corp. All rights reserved.

Terms of Use | Privacy | Accessibility

Page load link

×

Email Alerts

You may automatically receive Chesapeake Utilities Corporation financial information by email. To choose your options for email notification, please enter your email address below and click Submit.

Prompts

Chesapeake Utilities Corporation (ticker CPK), listed in United States.

ETFs Holding Chesapeake Utilities Corporation

ETF Weight in ETF Shares Market value As of
SIXS 1.22% 12,662 $ 1.775M Nov 12, 2026
KNOW 1.14% 646 $ 79.122K Jun 30, 2026
JPSV 1.08% 2,228 $ 307.464K Nov 17, 2026
SCDS 0.69% 454 $ 62.652K Nov 17, 2026
HSMV 0.66% 258 $ 36.097K Nov 16, 2026
EMLP 0.57% 171,594 $ 24.008M Nov 16, 2026
FPWR 0.49% 1,181 $ 165.234K Nov 16, 2026
SIXL 0.43% 6,400 $ 897.088K Nov 12, 2026
QIDX 0.26% 769 $ 102.108K Jul 31, 2026
RUSC 0.23% 1,487 $ 182.128K Jun 30, 2026
MSSM 0.23% 12,104 $ 1.616M Aug 31, 2026
AVSC 0.16% 36,375 $ 5.089M Nov 16, 2026
DFAS 0.07% 178,074 $ 24.961M Nov 12, 2026
EBI 0.01% 735 $ 98.152K Aug 31, 2026
DFAC 0.01% 52,091 $ 7.302M Nov 12, 2026
DCOR 0.01% 25,632 $ 3.593M Nov 12, 2026
DFSU 0.01% 1,002 $ 140.45K Nov 12, 2026
DFAU 0.01% 4,964 $ 695.804K Nov 12, 2026
DFUS 0.01% 7,779 $ 1.09M Nov 12, 2026
AVUS 0.00% 671 $ 93.88K Nov 16, 2026
NTRL short 0.00% -1,259 $ 0.00 Nov 16, 2026