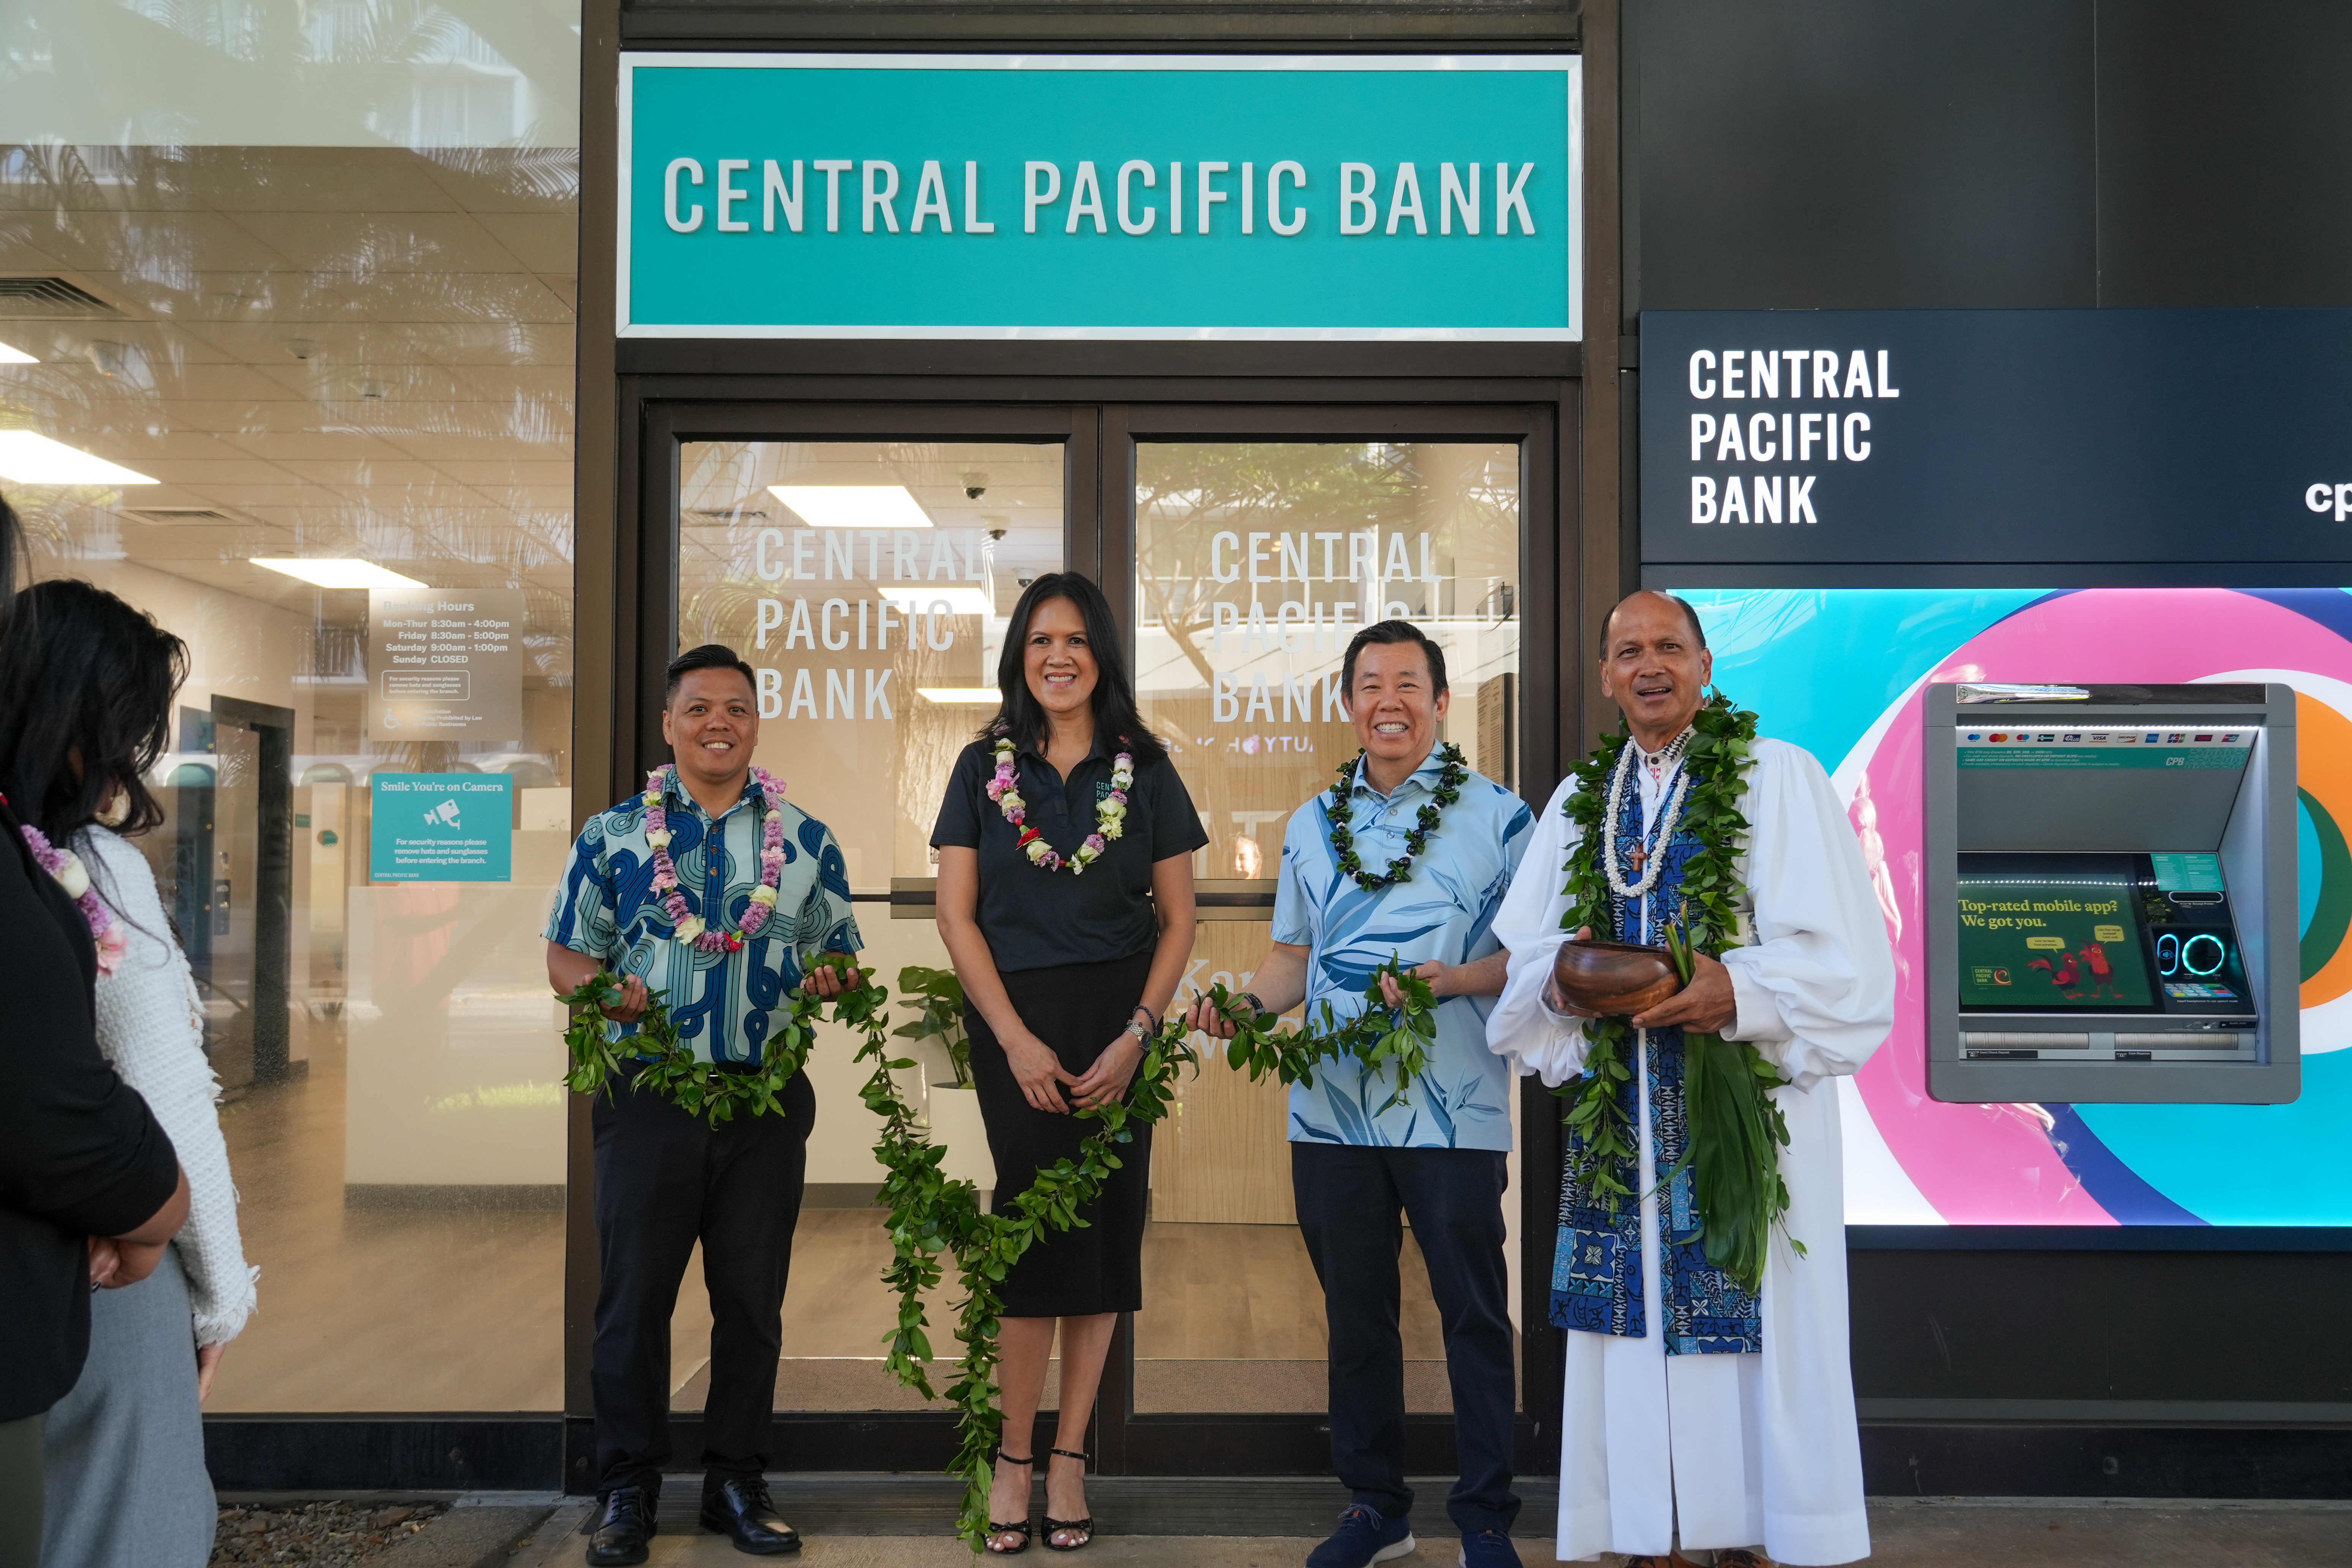
This donation will fund the creation of a new Community Room at the reimagined Nuʻuanu YMCA Link to download the Central Pacific Bank Foundation Historic Tribute Video and Display Board (courtesy of YMCA of Honolulu): Click here Link to download…
This donation will fund the creation of a new Community Room at the reimagined Nuʻuanu YMCA

Link to download the Central Pacific Bank Foundation Historic Tribute Video and Display Board (courtesy of YMCA of Honolulu): Click here
Link to download photos and video from the news conference (courtesy of YMCA of Honolulu): Click here
HONOLULU, HI (January 22, 2026) – The YMCA of Honolulu announced today a generous $425,000 combined donation from the Central Pacific Bank Foundation, Federal Home Loan Bank of Des Moines, and Central Pacific Bank Chairman, President, and CEO Arnold Martines and his wife, Thuy, to support the reimagined Nuʻuanu YMCA.
The $425,000 donation comprises a $250,000 grant from the Central Pacific Bank Foundation, a $75,000 grant from the Federal Home Loan Bank of Des Moines Member Impact Fund, and a $100,000 personal donation from Arnold and Thuy Martines.
This donation will fund the creation of the Central Pacific Bank Foundation Community Room at the new, reimagined Nuʻuanu YMCA. This community space will serve as a welcoming hub where neighbors, nonprofits, community organizations, and changemakers can come together to learn, collaborate, and strengthen the fabric of Hawaiʻi.
“Central Pacific Bank Foundation’s grant and partnership with the Federal Home Loan Bank of Des Moines’ Member Impact Fund grant to the YMCA of Honolulu represents more than a financial contribution; it is an investment in the Nuʻuanu YMCA’s mission and future in supporting the people and communities in Hawaiʻi by providing new improved facilities,” said Catherine Ngo, President and Chair of the Central Pacific Bank Foundation.
Kris Williams, President and CEO of FHLB Des Moines, added, “We are thrilled to see grants from our Member Impact Fund having a direct, positive impact on the communities in which our bank members help advance affordable housing and community development needs in a meaningful way.”
Arnold Martines, who serves as YMCA of Honolulu Association Board Chair and Chairman, along with his wife, Thuy Martines, personally donated $100,000 in support of the reimagined Nuʻuanu YMCA. “Thuy and I have always believed in the power of community. Hawaiʻi is where we’ve worked, served, and raised our family, and we are happy to support the reimagined Nuʻuanu Y as a way of honoring a place that has uplifted generations.”
Lisa Ontai, Interim President and CEO of the YMCA of Honolulu, added, “We are deeply grateful for the generous donations from Central Pacific Bank Foundation, Federal Home Loan Bank of Des Moines Member Impact Fund, and Arnold and Thuy Martines. Their donations ensure that the reimagined Nuʻuanu YMCA will continue to be a vibrant community hub where people of all ages and backgrounds can grow, connect, and thrive for many years.”
Nuʻuanu YMCA Reimagined
The current Nuʻuanu YMCA, located at 1441 Pali Highway, was dedicated on October 27, 1963. The 2.6-acre site has since served as the flagship branch of the YMCA of Honolulu, housing health and fitness spaces, enrichment programs, youth, teen, and kupuna activities, as well as aquatics for all ages and abilities.
The YMCA is now embarking on an important redevelopment process to modernize and reimagine the Nuʻuanu YMCA to better meet the evolving needs of our community, now and in the future.
Early concepts envision a new multi-story facility that integrates affordable housing, modern health and wellness spaces, and technology-equipped flexible multipurpose rooms to support physical and mental well-being, early learning, youth and teen development, family stability, and lifelong health.
Designed with efficiency, inclusion, and adaptability in mind, the new Nuʻuanu YMCA will provide spaces and resources that serve people of all ages and abilities, both within its walls and through expanded outreach throughout the community.
About the Central Pacific Bank Foundation
The Central Pacific Bank Foundation is a Hawaii-based Private Foundation incorporated in 2007, committed to building a stronger future for Hawaii by supporting community programs and economic opportunities. We do this through our investment and leadership in programs that help our residents and businesses thrive today, and for generations to come. Our focus areas are Education, Health and Human Services, and Ethnic and Cultural Preservation.
About the Federal Home Loan Bank of Des Moines Member Impact Fund
The Member Impact Fund is an up to $3:$1 matching grant program that encourages partnerships between eligible FHLB Des Moines member financial institutions and an eligible grantee. An eligible grantee includes a not-for-profit organization or government entity that has a mission of promoting affordable housing or community development and is located in an eligible state or U.S. territory.
About the YMCA of Honolulu
The YMCA of Honolulu is one of Hawaiʻi’s leading nonprofits, dedicated to strengthening communities through youth development, healthy living, and social responsibility. Serving Oʻahu since 1869, the Y ensures that people of all ages, incomes, and backgrounds have opportunities to learn, grow, and thrive.
The Y operates ten locations across Oʻahu: Atherton, Kaimukī-Waiʻalae, Kalihi, Leeward, Mililani, Nuʻuanu, Windward, Waiʻanae Coast, Central (with dormitory-style lodging), and Camp H.R. Erdman, a resident camp on the North Shore. Its reach extends to more than 115 community sites, including afterschool programs at 60 schools; substance abuse treatment and prevention at 28 school campuses across Oʻahu, Molokaʻi, Lānaʻi, and Kauaʻi; teen mental health services at 26 middle and high schools; and Early Learning Centers and Preschools, including those serving houseless families.
The YMCA of Honolulu holds a 4-star rating from Charity Navigator for strong fiscal management, accountability, and transparency. Learn more at www.ymcahonolulu.org