Understanding Radiation and Natural Gas Development
=====================================================================================================================================================================================================
Posted on March 16, 2026
by gina
By Carrie Crumpton, CNX Vice President of Environmental Strategy
Hey Carrie, how is radiation associated with gas operations?
Much of the petroleum and natural gas developed in the United States was created by the decay of ancient sea life. Naturally occurring radionuclides, which are radioactive forms of elements, and their decay products are found in various natural formations, including shale rock and gas formations, because of the origin of these sedimentary rocks and their organic content. Gas reservoirs often contain detectable amounts of radionuclides like radium-226, radium-228, and lead-210, which occur naturally in the earth. These constituents, collectively known as Naturally Occurring Radioactive Material (NORM), can become what is referred to as Technologically Enhanced1 (TENORM) through human activities such as oil and gas production, mining, and water treatment.

Did you know? Every day, cosmic rays from the sun and distant stars pass through our atmosphere, contributing about 20–30 millirem a year to the average American’s radiation dose.
Where can TENORM appear in gas operation activities?
Drilling Waste: Drill cuttings from formations with elevated radioactivity have the potential to convey TENORM back to the surface.
Produced Water: Heavy Brine (or saltwater) separated from the hydrocarbons contains dissolved radionuclides.
Scale and Sludge: Deposits of radium can accumulate forming detectable levels inside pipe, tanks, and equipment when produced water flows from the well through the system.
What is the typical radiation dose from exposure to typical NORM and TENORM sources?
Radiation dose is measured in millirem (mrem), which quantifies the amount of radiation absorbed by the body. According to the Nuclear Regulatory Commission (NRC), the average American receives a dose of about 620 mrem each year from a combination of natural and man-made sources of radiation. Radiation has always been around us as part of our natural environment – this includes cosmic radiation (from outer space), terrestrial radiation (from the ground), and even radiation from food, water, and the air we breathe.
The NRC Personal Annual Radiation Dose Calculator
indicates the annual dose of radiation you are typically exposed to if you:
- have porcelain crowns or false teeth (0.07 mrem)
- wear an LCD wristwatch (0.006 mrem)
- use luggage inspection at airports (0.002 mrem)
- watch TV (1 mrem)
- use a video display computer terminal (1 mrem)
- have a smoke detector (0.008 mrem)
- wear a pacemaker (100 mrem)
- have a diagnostic x-ray (40 mrem)
- live within 50 miles of a coal-fired electrical utility plant (0.03 mrem)
For perspective, a dose of 1 mrem results in about 1.2 minutes of reduced life expectancy – this is similar to crossing the street three times, taking three puffs on a cigarette, or consuming 10 extra calories (for a person who is overweight).
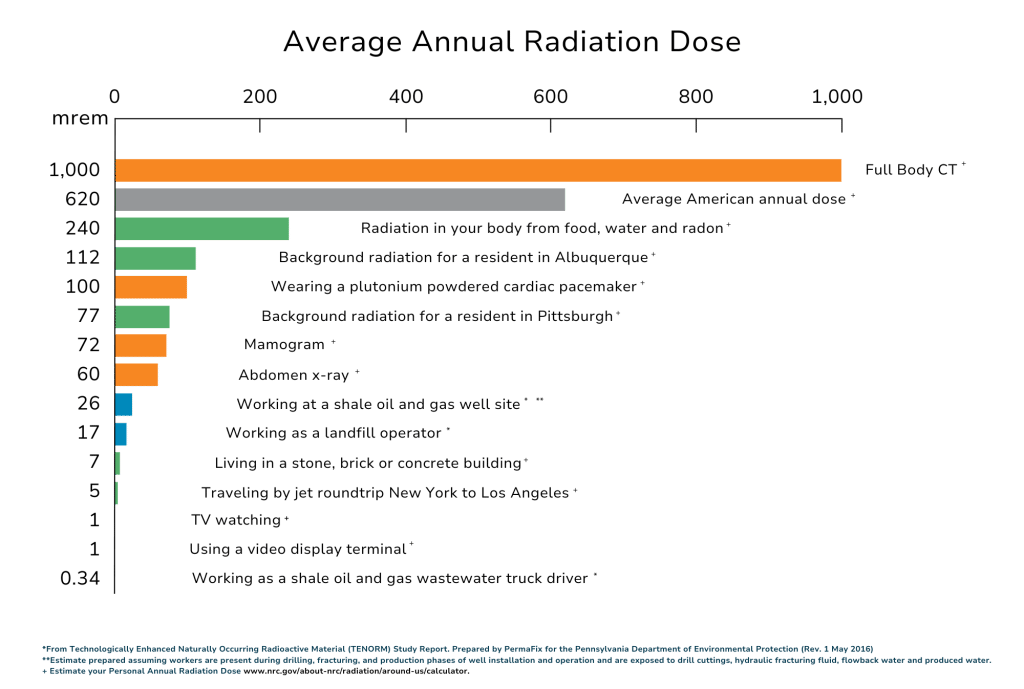
When considering radiation doses from oil and gas operations, we can use the Technologically Enhanced Naturally Occurring Radioactive Materials (TENORM) Study
by the PA Department of Environmental Protection to compare to other real-world doses, assuming workers are present during drilling, fracturing, and production phases of operations and are exposed to drill cuttings, hydraulic fracturing fluid, flowback water, and produced water.
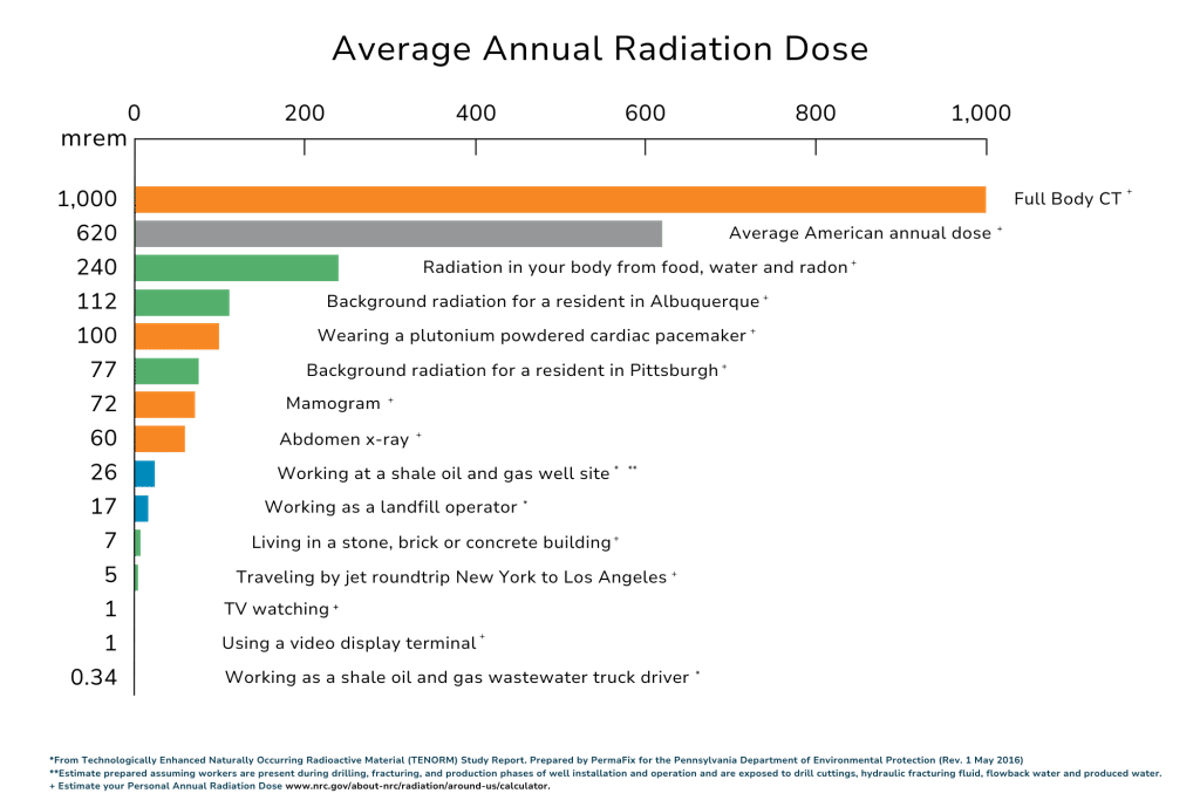
The graphic above provides a summary of estimates of the radiation dose associated with various activities. In any given setting, the actual doses are expected to vary somewhat from the estimates provided. Even so, we can assume that the annual radiation dose resulting from driving a shale oil and gas wastewater truck is likely to be less than 1 mrem, or less than one-tenth of the dose from a single abdomen x-ray. Similarly, the annual radiation exposure to workers at a shale oil and gas well site is expected to be less than 30 mrem, or about one-quarter of the expected annual dose experienced by a resident of Albuquerque.
Hey Carrie, what does CNX do to monitor and mitigate radiation risks?
This same study determined that NORM and TENORM materials associated with the oil and gas industry are well-managed and do not present a risk to the public. The scientific consensus is that there is “little potential for significant radiological exposure to workers and members of the general public related to E&P operations”2. Even so, CNX applies rigorous monitoring and mitigation measures to manage radiation risks effectively. Personnel receive specialized training in radiation protection, proper handling, and proper disposal of NORM and TENORM containing waste. These practices are guided by the CNX Comprehensive Radiation Protection Plan (CRPP), in conformance with 25 PA Code 293.111 requirements.
CNX’s CRPP
(publicly available on CNX’s “Radiation Protection and Monitoring” webpage
) provides guidance for radiological monitoring, safety protocols and procedures, and regulatory requirements for personnel working at CNX locations. It provides a practical approach to radiation hazard identification and mitigation.
The CRPP outlines CNX’s best‑practice approach to monitoring radiation, training workers, managing waste, and documenting and reviewing performance. This includes:
- Conducting routine radiation surveys of equipment, waste streams, and work areas using dose-rate and contamination meters.
- Training workers on radiation hazards, ALARA principles3, safe work practices, and “stop work” authority.
- Classifying, handling, and disposing of NORM/TENORM containing waste at appropriately permitted facilities under state and EPA regulations.
- Maintaining records, reporting any exceedances to regulators, and periodically auditing the program for continuous improvement.
We hope this helps answer common questions about radiation associated with gas operations and protection measures CNX has in place. Stay tuned for more information as CNX advances its Radical Transparency program and continues to share data and practices openly.
1 “Technologically enhanced” refers to a relative increase in radionuclide concentrations above background radiation levels as a result of changes when human activities alter the radiological, physical, and/or chemical properties of the radioactive material.
2 Pennsylvania Department of Environmental Protection. Technologically Enhanced Naturally Occurring Radioactive Materials (TENORM) Study Report. Rev. 1. Harrisburg, PA: Pennsylvania DEP, May 2016. https://www.pa.gov/agencies/dep/programs-and-services/oil-and-gas/related-topics/radiation-protection
3 ALARA stands for “as low as reasonably achievable.” Read more on “Guidelines for ALARA” from the U.S. Centers for Disease Control and Prevention at https://www.cdc.gov/radiation-health/safety/alara.html
.
Read more from the Context Corner Series:

Posted in Uncategorized
Comments are closed.
Post Navigation
← Next
Previous →


Back to Top


 View original content to download multimedia:






 View original content to download multimedia: