Saul Centers, Inc. is a real estate investment trust that operates and manages a portfolio of community and neighborhood shopping centers, office properties, and mixed-use developments. The company focuses on the Washington, DC, Baltimore, and Virginia metropolitan areas, with a strategy centered on developing transit-oriented residential mixed-use projects and expanding grocery-anchored shopping centers. Its portfolio includes properties such as Kentlands, Seven Corners, and Ashland Square, which feature retail, office, and multi-family residential uses. Saul Centers conducts its business through its Operating Partnership and wholly-owned subsidiaries, managing leasing, property maintenance, and development activities internally. The company was incorporated in 1993 to continue the shopping center business previously owned by the B. F. Saul Real Estate Investment Trust and the B. F. Saul Company. It serves local retail tenants and residential customers in the Mid-Atlantic region, with a development pipeline for apartment units and retail space near Metro stations.

Summarised from the company's own disclosures, fiscal year ended Feb 2026

Industry REIT - Retail Homepage saulcenters.com
Sector Real Estate IR page ir.saulcenters.com
Tags
shopping centers, mixed-use developments, grocery-anchored retail, transit-oriented development, property management, real estate development, Kentlands, Seven Corners, Ashland Square, Briggs Chaney MarketPlace, Burtonsville Town Square, Cranberry Square, Flagship Center, Germantown, Hampden House, Hampshire Langley, Metro Pike Shopping Center, Olde Forte Village, Olney, Ravenwood, Shops at Monocacy, Severna Park Marketplace, Smallwood Village Center, Southdale, Twinbrook Quarter, Twinbrook Rockville Pike, Westview Village, White Oak, Park Van Ness, 601 Pennsylvania Avenue, Ashbrook Marketplace, Ashburn Village, Beacon Center, Broadlands Village, Clarendon Center, Countryside Marketplace, The Glen, Great Falls Center, Lansdowne Town Center, Leesburg Pike Plaza, Northrock, Shops at Fairfax/Boulevard, Southside Plaza, Village Center, Washington Square, The Waycroft, Avenel Business Park, B. F. Saul Real Estate Investment Trust, B. F. Saul Company, Saul Holdings Limited Partnership, Publix
Press page —

Metrics

Valuation  
Market cap $ 746.575M
Market cap (USD) $ 746.575M
P/E 32.70
PEG —
P/BV 2.56
P/S 2.42
P/OCF 7.76
P/FCF 7.48
Dividend yield 0.27%
Turnover / mcap —
Returns  
ROE 11.7%
ROI 4.1%
ROIC 15.9%
Profit margin 12.9%
Growth  
Revenue growing Yes
Profits growing No
Revenue up 3y Yes
Revenue up 5y Yes
Earnings growth 3y (net profit CAGR) -12.3%
Quality  
Profitable Yes
Margin expanding No
Buying back stock No
Diluting (TTM) Yes
Debt/Equity 557.8%
Podcast bulls (TTM) Sign up
Podcast bears (TTM) Sign up
Podcast sentiment (TTM) Sign up
Podcast sentiment % (TTM) Sign up
News sentiment (TTM) 8
Quality score 22.2%
Insiders  
Buys, 1w Sign up
Buys, 1m Sign up
Buys, 1y Sign up
Sells, 1w Sign up
Sells, 1m Sign up
Sells, 1y Sign up

Sign up to see this company's insider trades

Figure FY 2025 FY 2024 FY 2023 FY 2022 FY 2021 FY 2020 FY 2019 FY 2018 FY 2017 FY 2016 FY 2015 FY 2014 FY 2013 FY 2012 FY 2011 FY 2010 FY 2009 FY 2008 FY 2007 FY 2006 FY 2005 FY 2004 FY 2003 FY 2002 FY 2001 FY 2000
Revenue 289.843M 268.847M 257.207M 245.86M 239.225M 225.207M 231.525M 227.904M 227.285M 217.07M 209.077M 207.092M 197.897M 190.092M 174.36M 163.546M 161.113M 160.345M 150.585M 137.978M 127.015M 112.842M 97.884M 93.963M 86.308M 79.029M
Net profit 37.511M 50.649M 52.689M 50.194M 48.389M 40.382M 51.723M 50.554M 48.257M 45.279M 42.468M 46.943M 30.872M 33.374M 26.733M 36.763M 36.713M 39.694M 36.703M 32.68M 29.227M 26.174M 19.242M 19.566M 17.314M 14.045M
Free cash flow 99.796M 121.224M 117.727M 4.263M 62.509M 22.215M -20.28M -18.311M -16.544M -1.955M 19.277M -3.7M 47.088M — — — — — — — — — — — — —

Figure FY 2025 FY 2024 FY 2023 FY 2022 FY 2021 FY 2020 FY 2019 FY 2018 FY 2017 FY 2016 FY 2015 FY 2014 FY 2013 FY 2012 FY 2011 FY 2010 FY 2009 FY 2008 FY 2007 FY 2006 FY 2005 FY 2004 FY 2003 FY 2002 FY 2001 FY 2000
Share price 31.53 38.8 39.27 40.68 53.02 31.68 52.78 47.22 61.75 66.61 51.27 57.19 47.73 42.8 33.12 48.22 32.29 37.17 51 56.14 — — — — — —
Price performance 12m -0.19 -0.01 -0.03 -0.23 0.67 -0.4 0.12 -0.24 -0.07 0.3 -0.1 0.2 0.12 0.29 -0.31 0.49 -0.13 -0.27 -0.09 — — — — — — —

Filed figures

Figure Dec 2016 Dec 2017 Dec 2018 Dec 2019 Dec 2020 Dec 2021 Dec 2022 Dec 2023 Dec 2024 Dec 2025
Balance sheet detail
Lease liabilities (USD) — — — 1.6M 900,000 100,000 3.2M 2.6M 1.8M 1M
Cash and deposits (USD) 8.32M 10.9M 14.6M 13.9M 26.9M 14.6M 13.3M 8.41M 10.3M 8.74M
Right-of-use assets (USD) — — — 1.6M 900,000 100,000 3.2M 2.5M 1.7M 900,000
Cash flow detail
Operating cash flow (USD) 89.1M 103M 110M 115M 78.4M 118M 121M 118M 121M 99.8M
Purchases of property, plant and equipment (USD) -91M -120M -129M -136M -56.2M -55.9M -117M — — —
Change in receivables (cash effect) (USD) -3.52M -1.64M -336,000 339,000 -17.8M 5.45M 2.42M -243,000 4.22M -11.6M
Dividends paid (cash effect) (USD) -39.5M -44.6M -46.3M -48.6M -49.4M -51M -55.5M -56.7M -56.9M -57.1M
Interest paid (cash effect) (USD) -44.1M -45.7M -43.6M -40.4M -45M -44.6M -40.7M -46.1M -51.6M -67.9M
Share-based compensation (USD) 1.6M 1.67M 1.77M 1.86M 1.44M 1.56M 1.52M 1.42M 1.72M 1.98M
Operating cash flow before change in receivables (USD) 92.6M 105M 111M 115M 96.2M 113M 119M 118M 117M 111M
Free cash flow (OCF - PPE - intangibles) (USD) -1.96M -16.5M -18.3M -20.3M 22.2M 62.5M 4.26M — — —
Income detail
Total comprehensive income (USD) 57.4M 61.5M 63.7M 64.3M 50.3M 61.6M 69.4M 67.8M 69.1M 46.5M
Comprehensive income to owners (USD) 45.8M 48.9M 51M 51.7M 40.4M 48.4M 53M 51.9M 51.6M 35.6M
Reported Mar 7, 2017 Feb 27, 2018 Feb 26, 2019 Feb 27, 2020 Feb 25, 2021 Feb 24, 2022 Mar 2, 2023 Feb 29, 2024 Feb 28, 2025 Feb 27, 2026

Sign up to see institutional holdings

Sign Up

Podcast Mentions

Sign up to see podcast mentions and sentiment

Sign Up

Company Release - 11/5/2026 4:12 PM ET

Download the PDF version PDF Format (opens in new window)

BETHESDA, Md., Nov. 5, 2026 /PRNewswire/ -- Saul Centers, Inc. (NYSE: BFS) (the "Company"), an equity real estate investment trust ("REIT"), announced operating results for the quarter ended September 30, 2026 ("2026 Quarter").  Total revenue for the 2026 Quarter increased to $78.4 million from $72.0 million for the quarter ended September 30, 2025 ("2025 Quarter").  Net income decreased to $12.6 million for the 2026 Quarter from $14.0 million for the 2025 Quarter.

During the 2026 Quarter, the Company continued to lease residential units at Hampden House. As of November 2, 2026, 267 (73.0%) of the 366 residential units were leased and occupied and 100% of the retail space was leased. Concurrent with the opening of Hampden House on October 1, 2025, interest, real estate taxes, depreciation and all other costs associated with the residential portion and the majority of the retail portion of the property began to be charged to expense, while revenue continues to grow as occupancy increases. As a result, compared to the 2025 Quarter, net income for the 2026 Quarter was adversely impacted by $3.7 million due to the initial operations of Hampden House, of which $2.9 million is related to interest expense, net. Exclusive of Hampden House, net income increased by $2.3 million primarily due to higher commercial base rent of $2.0 million. Net income available to common stockholders decreased to $6.7 million, or $0.27 per basic and diluted share, for the 2026 Quarter from $7.7 million, or $0.32 per basic and diluted share, for the 2025 Quarter. Compared to the 2025 Quarter, net income available to common stockholders for the 2026 Quarter was adversely impacted by $1.6 million, or $0.07 per basic and diluted share, due to the initial operations of Hampden House.

Same property revenue increased $3.5 million, or 4.9%, and same property net operating income increased $2.5 million, or 5.0%, for the 2026 Quarter compared to the 2025 Quarter. Same property revenue was favorably impacted by $1.2 million due to the lease up of Twinbrook Quarter Phase I. Exclusive of Twinbrook Quarter Phase I, same property revenue increased $2.3 million primarily due to (a) higher commercial base rent of $1.2 million and (b) higher expense recoveries of $0.7 million.  Same property net operating income was favorably impacted by $1.1 million due to the lease up of Twinbrook Quarter Phase I. Exclusive of Twinbrook Quarter Phase I, same property net operating income increased $1.4 million primarily due to higher commercial base rent of $1.2 million. Shopping Center same property net operating income for the 2026 Quarter totaled $37.4 million, a 4.6% increase compared to the 2025 Quarter. Shopping Center same property net operating income increased primarily due to (a) higher base rent of $1.3 million and (b) lower credit losses on operating lease receivables, net, of $0.4 million.  Mixed-Use same property net operating income for the 2026 Quarter totaled $14.9 million, a 6.1% increase compared to the 2025 Quarter. Mixed-Use same property net operating income increased primarily due to the lease up of Twinbrook Quarter Phase I of $1.1 million. Exclusive of Twinbrook Quarter Phase I, Mixed-Use same property net operating income decreased $0.2 million primarily due to lower expense recoveries, net of expenses, of $0.2 million. One property, Hampden House, which commenced operations on October 1, 2025, was excluded from same property results.  Reconciliations of (a) total revenue to same property revenue and (b) net income to same property net operating income are attached to this press release. 

Same property revenue and same property net operating income are non-GAAP financial measures of performance that management believes improve the comparability of reporting periods by excluding the results of properties that were not in operation for the entirety of the comparable reporting periods. We define same property revenue as total revenue less straight-line base rent and amortization of above/below market premiums and discounts related to leases acquired in connection with purchased real estate investment properties minus the revenue of properties not in operation for the entirety of the comparable reporting periods. We define same property net operating income as net income plus (a) interest expense, net, (b) depreciation and amortization, (c) general and administrative expenses, (d) change in fair value of derivatives and (e) loss on the early extinguishment of debt minus (f) gains on property dispositions, (g) straight-line base rent, (h) amortization of above/below market premiums and discounts related to leases acquired in connection with purchased real estate investment properties and (i) the net operating income of properties that were not in operation for the entirety of the comparable periods.

Funds from operations ("FFO") available to common stockholders and noncontrolling interests (after deducting preferred stock dividends) increased to $25.9 million, or $0.72 per basic and diluted share, in the 2026 Quarter compared to $25.3 million, or $0.72 per basic and diluted share, in the 2025 Quarter. FFO is a non-GAAP supplemental earnings measure that management considers meaningful in measuring operating performance. A definition of FFO and reconciliation of net income to FFO is attached to this press release as page 9.  FFO available to common stockholders and noncontrolling interests was adversely impacted by $2.1 million, or $0.06 per basic and diluted share, due to the initial operations of Hampden House. Exclusive of Hampden House, FFO available to common stockholders and noncontrolling interests increased by $2.7 million primarily due to (a) higher commercial base rent of $2.0 million and (b) higher residential base rent of $0.6 million.

Excluding Hampden House, the Residential portfolio was 97.1% leased at September 30, 2026 and September 30, 2025.

For the nine months ended September 30, 2026 ("2026 Period"), total revenue increased to $233.5 million from $214.7 million for the nine months ended September 30, 2025 ("2025 Period").  Net income decreased to $36.2 million for the 2026 Period from $41.0 million for the 2025 Period.  The primary reason for the decline was the $12.5 million adverse impact of the initial operations of Hampden House. Exclusive of Hampden House, net income increased by $7.7 million primarily due to (a) higher commercial base rent of $4.8 million and (b) higher residential base rent of $4.1 million partially offset by (c) higher general and administrative costs of $0.9 million. Net income available to common stockholders decreased to $18.9 million, or $0.78 per basic and diluted share, for the 2026 Period compared to $22.6 million, or $0.93 per basic and diluted share, for the 2025 Period. Compared to the 2025 Period, net income available to common stockholders for the 2026 Period was adversely impacted by $5.8 million, or $0.24 per basic and diluted share, due to the initial operations of Hampden House.

Same property revenue increased $13.3 million, or 6.4%, and same property net operating income increased $10.2 million, or 7.0%, for the 2026 Period compared to the 2025 Period.  Same property revenue was favorably impacted by $7.1 million due to the lease up of Twinbrook Quarter Phase I. Exclusive of Twinbrook Quarter Phase I, same property revenue increased $6.2 million primarily due to (a) higher commercial base rent of $3.3 million, (b) higher expense recoveries of $2.3 million, (c) lower credit losses on operating lease receivables, net, of $0.4 million and (d) higher residential base rent of $0.3 million. Same property net operating income was favorably impacted by $6.7 million due to the lease up of Twinbrook Quarter Phase I. Exclusive of Twinbrook Quarter Phase I, same property net operating income increased $3.5 million primarily due to higher commercial base rent of $3.3 million. Shopping Center same property net operating income increased $4.1 million, or 3.9%, and Mixed-Use same property net operating income increased $6.1 million, or 15.2%. Shopping Center same property net operating income increased primarily due to (a) higher base rent of $3.4 million and (b) lower credit losses on operating lease receivables, net, of $0.8 million. Mixed-Use same property net operating income was favorably impacted by $6.7 million due to the lease up of Twinbrook Quarter Phase I. Exclusive of Twinbrook Quarter Phase I, Mixed-Use same property net operating income decreased by $0.6 million primarily due to lower expense recoveries, net of expenses, of $0.4 million. One property, Hampden House, was excluded from same property results.

FFO available to common stockholders and noncontrolling interests, after deducting preferred stock dividends, totaled $75.9 million, or $2.12 per basic and diluted share, for the 2026 Period compared to $75.2 million, or $2.16 per basic and diluted share, for the 2025 Period. FFO available to common stockholders and noncontrolling interests was adversely impacted by $7.7 million, or $0.22 per basic and diluted share, due to the initial operations of Hampden House. Exclusive of Hampden House, FFO available to common stockholders and noncontrolling interests increased by $8.3 million primarily due to (a) higher commercial base rent of $4.8 million, (b) higher residential base rent of $4.1 million and (c) lower credit losses on operating receivables, net, of $0.4 million partially offset by (d) higher general and administrative costs of $0.9 million.

Saul Centers, Inc. is a self-managed, self-administered equity REIT headquartered in Bethesda, Maryland, which currently operates and manages a real estate portfolio of 62 properties, which includes (a) 50 community and neighborhood shopping centers and nine mixed-use properties with approximately 10.6 million square feet of leasable area and (b) three non-operating land and development properties. Over 85% of the Saul Centers' property net operating income is generated by properties in the Washington, D.C./Baltimore metropolitan area.

Safe Harbor Statement

Certain matters discussed within this press release may be deemed to be forward-looking statements within the meaning of the federal securities laws.  For these statements, we claim the protection of the safe harbor for forward-looking statements contained in the Private Securities Litigation Reform Act of 1995.  Although the Company believes the expectations reflected in the forward-looking statements are based on reasonable assumptions, it can give no assurance that its expectations will be attained.  These factors include, but are not limited to, the risk factors described in our Annual Report on Form 10-K for the year ended December 31, 2025 and other periodic or current reports filed with the SEC and include the following: (i) macroeconomic conditions, including geopolitical instability (such as the ongoing conflicts in the Middle East and Ukraine) and changes in tariff and trade policy, which may lead to a disruption of, or lack of access to, sources of funding and rising inflation, (ii) the ability of our tenants to pay rent, (iii) our reliance on shopping center "anchor" tenants and other significant tenants, (iv) our substantial relationships with members of the B. F. Saul Company and certain other affiliated entities, each of which is controlled by B. Francis Saul II and his family members, (v) financing risks, such as increases in interest rates, restrictions imposed by our debt, our ability to meet existing financial covenants and our ability to consummate planned and additional financings on acceptable terms or at all, (vi) our access to additional capital, (vii) our development activities, (viii) our ability to successfully complete additional acquisitions, developments or redevelopments, or if they are consummated, whether such acquisitions, developments or redevelopments perform as expected, (ix) adverse trends in the retail, office and residential real estate sectors, (x) risks relating to cybersecurity and potential future uses of artificial intelligence, including disruption to our business and operations, reputational risk, regulatory risk, and exposure to liabilities from tenants, employees, capital providers, and other third parties, (xi) risks generally incident to the ownership of real property, including adverse changes in economic conditions, changes in the investment climate for real estate, changes in real estate taxes and other operating expenses, adverse changes in governmental rules and fiscal policies, the relative illiquidity of real estate and environmental risks, and (xii) risks related to our status as a REIT for federal income tax purposes, such as the existence of complex regulations relating to our status as a REIT, the effect of future changes to REIT requirements as a result of new legislation and the adverse consequences of any failure to qualify as a REIT.  Given these uncertainties, readers are cautioned not to place undue reliance on any forward-looking statements that we make, including those in this press release.  Except as may be required by law, we make no promise to update any of the forward-looking statements as a result of new information, future events or otherwise. You should carefully review the risks and risk factors included in our Annual Report on Form 10-K for the year ended December 31, 2025 and other periodic or current reports filed with the SEC.

Saul Centers, Inc.Consolidated Balance Sheets(Unaudited)
(Dollars in thousands, except per share amounts) September 30,2026 December 31,2025
Assets
Real estate investments
Land $          597,402 $          595,514
Buildings and equipment 2,187,331 2,162,135
Construction in progress 112,054 109,950
2,896,787 2,867,599
Accumulated depreciation (854,937) (812,035)
Total real estate investments, net 2,041,850 2,055,564
Cash and cash equivalents 8,545 8,741
Accounts receivable and accrued income, net 68,916 60,799
Deferred leasing costs, net 25,795 25,847
Other assets 27,362 11,727
Total assets $        2,172,468 $        2,162,678
Liabilities
Mortgage notes payable, net $        1,099,923 $        1,063,530
Revolving credit facility payable, net 112,582 144,678
Term loan facility payable, net 139,198 138,870
Construction loans payable, net 271,895 254,724
Accounts payable, accrued expenses and other liabilities 35,499 36,617
Deferred income 21,525 22,840
Dividends and distributions payable 24,908 24,162
Total liabilities 1,705,530 1,685,421
Equity
Preferred stock, 1,000,000 shares authorized:
Series D Cumulative Redeemable, 30,000 shares issued and outstanding 75,000 75,000
Series E Cumulative Redeemable, 44,000 shares issued and outstanding 110,000 110,000
Common stock, $0.01 par value, 50,000,000 shares authorized,24,819,641 and 24,551,168 shares issued and outstanding, respectively 248 245
Additional paid-in capital 465,394 459,222
Distributions in excess of accumulated earnings (362,408) (337,708)
Accumulated other comprehensive income 2,861 1,061
Total Saul Centers, Inc. equity 291,095 307,820
Noncontrolling interests 175,843 169,437
Total equity 466,938 477,257
Total liabilities and equity $        2,172,468 $        2,162,678
Saul Centers, Inc.Consolidated Statements of Operations(Unaudited)
Three Months EndedSeptember 30, Nine Months EndedSeptember 30,
(In thousands, except per share amounts) 2026 2025 2026 2025
Revenues
Rental revenue $       76,953 $       70,679 $      229,153 $      210,652
Other 1,464 1,325 4,314 4,042
Total revenue 78,417 72,004 233,467 214,694
Expenses
Property operating expenses 13,926 12,024 43,217 37,190
Real estate taxes 8,716 8,154 25,991 24,154
Interest expense, net 20,266 17,066 59,950 50,633
Depreciation and amortization 16,148 14,106 48,102 42,727
General and administrative 6,772 6,658 20,029 19,085
Total expenses 65,828 58,008 197,289 173,789
Gain on disposition of property 53 — 53 120
Net income 12,642 13,996 36,231 41,025
Noncontrolling interests
Income attributable to noncontrolling interests (3,169) (3,507) (8,887) (10,017)
Net income attributable to Saul Centers, Inc. 9,473 10,489 27,344 31,008
Preferred stock dividends (2,798) (2,798) (8,395) (8,395)
Net income available to common stockholders $        6,675 $        7,691 $       18,949 $       22,613
Per share net income available to common stockholders
Basic and diluted $          0.27 $          0.32 $          0.78 $          0.93
Reconciliation of net income to FFO available to common stockholders andnoncontrolling interests (1)
Three Months EndedSeptember 30, Nine Months EndedSeptember 30,
(In thousands, except per share amounts) 2026 2025 2026 2025
Net income $       12,642 $       13,996 $       36,231 $       41,025
Subtract:
Gain on disposition of property (53) — (53) (120)
Add:
Real estate depreciation and amortization 16,148 14,106 48,102 42,727
FFO 28,737 28,102 84,280 83,632
Subtract:
Preferred stock dividends (2,798) (2,798) (8,395) (8,395)
FFO available to common stockholders and noncontrolling interests $       25,939 $       25,304 $       75,885 $       75,237
Weighted average shares and units:
Basic 35,992 35,057 35,760 34,863
Diluted 36,031 35,069 35,805 34,880
Basic and diluted FFO per share available to common stockholders and noncontrolling interests $          0.72 $          0.72 $          2.12 $          2.16
(1) The National Association of Real Estate Investment Trusts ("Nareit") developed FFO as a relative non-GAAP financial measure of performance of an equity REIT in order to recognize that income-producing real estate historically has not depreciated on the basis determined under GAAP. FFO is defined by Nareit as net income, computed in accordance with GAAP, plus real estate depreciation and amortization, and excluding impairment charges on depreciable real estate assets and gains or losses from property dispositions. FFO does not represent cash generated from operating activities in accordance with GAAP and is not necessarily indicative of cash available to fund cash needs, which is disclosed in the Company's Consolidated Statements of Cash Flows for the applicable periods. FFO should not be considered as an alternative to net income, its most directly comparable GAAP measure, as an indicator of the Company's operating performance, or as an alternative to cash flows as a measure of liquidity. Management considers FFO a meaningful supplemental measure of operating performance because it primarily excludes the assumption that the value of the real estate assets diminishes predictably over time (i.e. depreciation), which is contrary to what the Company believes occurs with its assets, and because industry analysts have accepted it as a performance measure. FFO may not be comparable to similarly titled measures employed by other REITs.
Reconciliation of revenue to same property revenue (2)
Three Months EndedSeptember 30, Nine Months EndedSeptember 30,
(In thousands) 2026 2025 2026 2025
Total revenue $       78,417 $       72,004 $      233,467 $      214,694
Revenue adjustments (1) (2,726) (2,050) (7,568) (7,145)
Acquisitions, dispositions and development properties (2,283) — (5,053) —
Total same property revenue $       73,408 $       69,954 $      220,846 $      207,549
Shopping Centers $       48,626 $       46,204 $      146,222 $      139,780
Mixed-Use properties 24,782 23,750 74,624 67,769
Total same property revenue $       73,408 $       69,954 $      220,846 $      207,549
Total Shopping Center revenue $       48,626 $       46,204 $      146,222 $      139,780
Shopping Center acquisitions, dispositions and development properties — — — —
Total Shopping Center same property revenue $       48,626 $       46,204 $      146,222 $      139,780
Total Mixed-Use property revenue $       27,065 $       23,750 $       79,677 $       67,769
Mixed-Use acquisitions, dispositions and development properties (2,283) — (5,053) —
Total Mixed-Use same property revenue $       24,782 $       23,750 $       74,624 $       67,769
(1) Revenue adjustments are straight-line base rent and amortization of premiums and discounts related to above/below market leases.
(2) Same property revenue is a non-GAAP financial measure of performance that management believes improves the comparability of reporting periods by excluding the results of properties that were not in operation for the entirety of the comparable reporting periods.  We define same property revenue as total revenue less straight-line base rent and amortization of above/below market premiums and discounts related to leases acquired in connection with purchased real estate investment properties minus the revenue of properties not in operation for the entirety of the comparable reporting periods.  Same property revenue is a measure of the operating performance of the Company's properties but does not measure the Company's performance as a whole.  Same property revenue should not be considered as an alternative to total revenue, its most directly comparable GAAP measure, as an indicator of the Company's operating performance.  Management considers same property revenue a meaningful supplemental measure of operating performance because it is not affected by the cost of the Company's funding, the impact of depreciation and amortization expenses, gains or losses from the acquisition and sale of operating real estate assets, general and administrative expenses or other gains and losses that relate to ownership of the Company's properties.  Management believes the exclusion of these items from same property revenue is useful because the resulting measure captures the actual revenue generated by operating the Company's properties.  Other REITs may use different methodologies for calculating same property revenue.  Accordingly, the Company's same property revenue may not be comparable to those of other REITs.
Mixed-Use same property revenue is composed of the following:
Three Months EndedSeptember 30, Nine Months EndedSeptember 30,
(In thousands) 2026 2025 2026 2025
Residential Mixed-Use properties (residential activity) (1) $       13,120 $       12,298 $       39,576 $       34,422
Office Mixed-Use properties (2) 9,456 9,673 28,671 29,251
Residential Mixed-Use properties (retail activity) (3) 2,206 1,779 6,377 4,096
Total Mixed-Use same property revenue $       24,782 $       23,750 $       74,624 $       67,769
(1) Includes Clarendon South Block, The Waycroft, Park Van Ness and The Milton at Twinbrook Quarter.
(2) Includes Avenel Business Park, Clarendon Center – North and South Blocks, 601 Pennsylvania Avenue and Washington Square.
(3) Includes The Waycroft, Park Van Ness and Twinbrook Quarter Phase I.
Reconciliation of net income to same property net operating income (2)
Three Months EndedSeptember 30, Nine Months EndedSeptember 30,
(In thousands) 2026 2025 2026 2025
Net income $       12,642 $       13,996 $       36,231 $       41,025
Interest expense, net 20,266 17,066 59,950 50,633
Depreciation and amortization 16,148 14,106 48,102 42,727
General and administrative 6,772 6,658 20,029 19,085
Gain on disposition of property (53) — (53) (120)
Revenue adjustments (1) (2,726) (2,050) (7,568) (7,145)
Total property net operating income 53,049 49,776 156,691 146,205
Acquisitions, dispositions, and development properties (761) — (308) —
Total same property net operating income $       52,288 $       49,776 $      156,383 $      146,205
Shopping Centers $       37,416 $       35,759 $      110,449 $      106,328
Mixed-Use properties 14,872 14,017 45,934 39,877
Total same property net operating income $       52,288 $       49,776 $      156,383 $      146,205
Shopping Center property net operating income $       37,416 $       35,759 $      110,449 $      106,328
Shopping Center acquisitions, dispositions and development properties — — — —
Total Shopping Center same property net operating income $       37,416 $       35,759 $      110,449 $      106,328
Mixed-Use property net operating income $       15,633 $       14,017 $       46,242 $       39,877
Mixed-Use acquisitions, dispositions and development properties (761) — (308) —
Total Mixed-Use same property net operating income $       14,872 $       14,017 $       45,934 $       39,877
(1) Revenue adjustments are straight-line base rent and amortization of premiums and discounts related to above/below market leases.
(2) Same property net operating income is a non-GAAP financial measure of performance that management believes improves the comparability of reporting periods by excluding the results of properties that were not in operation for the entirety of the comparable reporting periods.  We define same property net operating income as net income plus (a) interest expense, net, (b) depreciation and amortization, (c) general and administrative expenses, (d) change in fair value of derivatives, and (e) loss on the early extinguishment of debt minus (f) gains on property dispositions, (g) straight-line base rent, (h) amortization of above/below market premiums and discounts related to leases acquired in connection with purchased real estate investment properties and (i) the net operating income of properties that were not in operation for the entirety of the comparable periods.  Same property net operating income is a measure of the operating performance of the Company's properties but does not measure the Company's performance as a whole.  Same property net operating income should not be considered as an alternative to net income, its most directly comparable GAAP measure, as an indicator of the Company's operating performance.  Management considers same property net operating income a meaningful supplemental measure of operating performance because it is not affected by the cost of the Company's funding, the impact of depreciation and amortization expenses, gains or losses from the acquisition and sale of operating real estate assets, general and administrative expenses or other gains and losses that relate to ownership of the Company's properties.  Management believes the exclusion of these items from property net operating income is useful because the resulting measure captures the actual revenue generated and actual expenses incurred by operating the Company's properties.  Other REITs may use different methodologies for calculating same property net operating income.  Accordingly, same property net operating income may not be comparable to those of other REITs.
Mixed-Use same property net operating income is composed of the following:
Three Months EndedSeptember 30, Nine Months EndedSeptember 30,
(In thousands) 2026 2025 2026 2025
Residential Mixed-Use properties (residential activity) (1) $        7,730 $        7,097 $       23,834 $       19,329
Office Mixed-Use properties (2) 5,593 5,856 17,696 18,182
Residential Mixed-Use properties (retail activity) (3) 1,549 1,064 4,404 2,367
Total Mixed-Use same property net operating income $       14,872 $       14,017 $       45,934 $       39,878
(1) Includes Clarendon South Block, The Waycroft, Park Van Ness and The Milton at Twinbrook Quarter.
(2) Includes Avenel Business Park, Clarendon Center – North and South Blocks, 601 Pennsylvania Avenue and Washington Square.
(3) Includes The Waycroft, Park Van Ness and Twinbrook Quarter Phase I.

Cision View original content:https://www.prnewswire.com/news-releases/saul-centers-inc-reports-third-quarter-2026-earnings-302931355.html

SOURCE Saul Centers, Inc.

View all news

NYSE: BFS

Loading ...

Latest

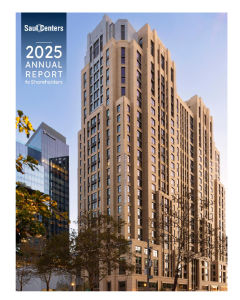
Annual Report to Security Holders
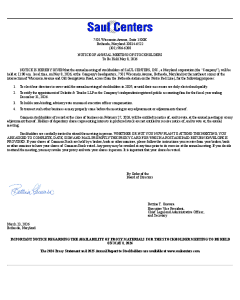
Latest Proxy
Copyright 2026, © Powered By Q4 Inc.


Saul Centers, Inc. | 7501 Wisconsin Ave., Suite 1500E | Bethesda, MD 20814 | 301-986-6200 | 301-986-6079 Fax © Copyright 2021

REQUEST A MEETING WITH MANAGEMENT

Close menu

Saul Centers Declares Quarterly Dividends Bull 0 Bear 0 Capital return

Company Release - 9/17/2026 4:05 PM ET

Download the PDF version PDF Format (opens in new window)

BETHESDA, Md., Sept. 17, 2026 /PRNewswire/ -- Saul Centers, Inc. (NYSE: BFS) has declared a quarterly dividend of $0.59 per share on its common stock, to be paid on October 30, 2026, to holders of record on October 15, 2026. The common dividend is unchanged from the amount paid in the previous quarter and the amount paid in the prior year's comparable quarter.

The Company also declared quarterly dividends on (a) its 6.125% Series D Cumulative Redeemable Preferred Stock, in the amount of $0.3828125 per depositary share and (b) its 6.000% Series E Cumulative Redeemable Preferred Stock, in the amount of $0.3750000 per depositary share. The preferred dividends will be paid on October 15, 2026, to holders of record on October 1, 2026.

Saul Centers is a self-managed, self-administered equity REIT headquartered in Bethesda, Maryland. Saul Centers currently operates and manages a real estate portfolio comprised of 62 properties, which includes (a) 50 community and neighborhood shopping centers and nine mixed-use properties with approximately 10.6 million square feet of leasable area and (b) three non-operating land and development properties. Over 85% of the Saul Centers' property operating income is generated by properties in the Washington, DC/Baltimore metropolitan area.

More information about Saul Centers is available on the Company's website at www.saulcenters.com .

Safe Harbor Statement

Certain matters discussed within this press release may be deemed to be forward-looking statements within the meaning of the federal securities laws. For these statements, we claim the protection of the safe harbor for forward-looking statements contained in the Private Securities Litigation Reform Act of 1995. Although the Company believes the expectations reflected in the forward-looking statements are based on reasonable assumptions, it can give no assurance that its expectations will be attained. These factors include, but are not limited to, the risk factors described in our Annual Report on Form 10-K for the year ended December 31, 2025 and other periodic or current reports filed with the SEC and include the following: (i) macroeconomic conditions, including geopolitical, global trade and international conflict disruptions, which may lead to a disruption of, or lack of access to, sources of funding and rising inflation, (ii) the ability of our tenants to pay rent, (iii) our reliance on shopping center "anchor" tenants and other significant tenants, (iv) our substantial relationships with members of the B. F. Saul Company and certain other affiliated entities, each of which is controlled by B. Francis Saul II and his family members, (v) financing risks, such as increases in interest rates, restrictions imposed by our debt, our ability to meet existing financial covenants and our ability to consummate planned and additional financings on acceptable terms or at all, (vi) our access to additional capital, (vii) our development activities, (viii) our ability to successfully complete additional acquisitions, developments or redevelopments, or if they are consummated, whether such acquisitions, developments or redevelopments perform as expected, (ix) adverse trends in the retail, office and residential real estate sectors, (x) risks relating to cybersecurity and potential future uses of artificial intelligence, including disruption to our business and operations, reputational risk, regulatory risk, and exposure to liabilities from tenants, employees, capital providers, and other third parties, (xi) risks generally incident to the ownership of real property, including adverse changes in economic conditions, changes in the investment climate for real estate, changes in real estate taxes and other operating expenses, adverse changes in governmental rules and fiscal policies, the relative illiquidity of real estate and environmental risks, and (xii) risks related to our status as a REIT for federal income tax purposes, such as the existence of complex regulations relating to our status as a REIT, the effect of future changes to REIT requirements as a result of new legislation and the adverse consequences of any failure to qualify as a REIT.  Given these uncertainties, readers are cautioned not to place undue reliance on any forward-looking statements that we make, including those in this press release. Except as may be required by law, we make no promise to update any of the forward-looking statements as a result of new information, future events or otherwise. You should carefully review the risks and risk factors included in our Annual Report on Form 10-K for the year ended December 31, 2025 and other periodic or current reports filed with the SEC.  

Cision View original content:https://www.prnewswire.com/news-releases/saul-centers-declares-quarterly-dividends-302882614.html

SOURCE Saul Centers, Inc.

View all news

NYSE: BFS

Loading ...

Latest

Annual Report to Security Holders

Latest Proxy

Copyright 2026, © Powered By Q4 Inc.


Saul Centers, Inc. | 7501 Wisconsin Ave., Suite 1500E | Bethesda, MD 20814 | 301-986-6200 | 301-986-6079 Fax © Copyright 2021

REQUEST A MEETING WITH MANAGEMENT

Close menu

Company Release - 8/6/2026 4:09 PM ET

Download the PDF version PDF Format (opens in new window)

BETHESDA, Md., Aug. 6, 2026 /PRNewswire/ -- Saul Centers, Inc. (NYSE: BFS) (the "Company"), an equity real estate investment trust ("REIT"), announced operating results for the quarter ended June 30, 2026 ("2026 Quarter").  Total revenue for the 2026 Quarter increased to $76.8 million from $70.8 million for the quarter ended June 30, 2025 ("2025 Quarter").  Net income decreased to $11.5 million for the 2026 Quarter from $14.2 million for the 2025 Quarter. During the 2026 Quarter, the Company continued to lease residential units at Hampden House. As of August 3, 2026, 235 of the 366 (64.2%) residential units were leased and occupied and 8,600 square feet of the 10,100 (85.1%) square feet of retail space is leased and occupied.

Concurrent with the opening of Hampden House on October 1, 2025, interest, real estate taxes, depreciation and all other costs associated with the residential portion and the majority of the retail portion of the property began to be charged to expense, while revenue continues to grow as occupancy increases. As a result, compared to the 2025 Quarter, net income for the 2026 Quarter was adversely impacted by $4.0 million due to the initial operations of Hampden House, of which $2.9 million is related to interest expense, net and amortization of deferred debt costs. Exclusive of Hampden House, net income increased by $1.3 million primarily due to (a) higher residential base rent of $1.4 million and (b) higher commercial base rent of $1.2 million partially offset by (c) higher general and administrative costs of $0.4 million, (d) higher interest expense, net and amortization of deferred debt costs of $0.3 million and (e) higher depreciation and amortization of deferred leasing costs of $0.3 million. Net income available to common stockholders decreased to $6.0 million, or $0.24 per basic and diluted share, for the 2026 Quarter from $7.9 million, or $0.33 per basic and diluted share, for the 2025 Quarter. Compared to the 2025 Quarter, net income available to common stockholders for the 2026 Quarter was adversely impacted by $1.9 million, or $0.08 per basic and diluted share, due to the initial operations of Hampden House.

Same property revenue increased $4.7 million, or 6.9%, and same property net operating income increased $3.4 million, or 6.9%, for the 2026 Quarter compared to the 2025 Quarter. Same property revenue was favorably impacted by $2.7 million due to the lease up of Twinbrook Quarter Phase I. Exclusive of Twinbrook Quarter Phase I, same property revenue increased $2.0 million primarily due to (a) higher commercial base rent of $1.3 million and (b) higher expense recoveries of $0.9 million. Same property net operating income was favorably impacted by $2.5 million due to the lease up of Twinbrook Quarter Phase I. Exclusive of Twinbrook Quarter Phase I, same property net operating income increased $0.9 million, primarily due to (a) higher commercial base rent of $1.3 million partially offset by (b) lower expense recoveries, net of expenses, of $0.4 million. Shopping Center same property net operating income for the 2026 Quarter totaled $36.6 million, a 3.6% increase compared to the 2025 Quarter. Shopping Center same property net operating income increased primarily due to higher base rent of $1.2 million.  Mixed-Use same property net operating income for the 2026 Quarter totaled $15.5 million, a 15.7% increase compared to the 2025 Quarter. Mixed-Use same property net operating income increased primarily due to the lease up of Twinbrook Quarter Phase I of $2.5 million. Exclusive of Twinbrook Quarter Phase I, Mixed-Use same property net operating income decreased by $0.4 million primarily due to lower expense recoveries, net of expenses, of $0.3 million. One property, Hampden House, which commenced operations on October 1, 2025, was excluded from same property results.  Reconciliations of (a) total revenue to same property revenue and (b) net income to same property net operating income are attached to this press release. 

Same property revenue and same property net operating income are non-GAAP financial measures of performance that management believes improve the comparability of reporting periods by excluding the results of properties that were not in operation for the entirety of the comparable reporting periods. We define same property revenue as total revenue less straight-line base rent and amortization of above/below market premiums and discounts related to leases acquired in connection with purchased real estate investment properties minus the revenue of properties not in operation for the entirety of the comparable reporting periods. We define same property net operating income as net income plus (a) interest expense, net and amortization of deferred debt costs, (b) depreciation and amortization of deferred leasing costs, (c) general and administrative expenses, (d) change in fair value of derivatives and (e) loss on the early extinguishment of debt minus (f) gains on property dispositions, (g) straight-line base rent, (h) amortization of above/below market premiums and discounts related to leases acquired in connection with purchased real estate investment properties and (i) the net operating income of properties that were not in operation for the entirety of the comparable periods.

Funds from operations ("FFO") available to common stockholders and noncontrolling interests (after deducting preferred stock dividends) decreased to $24.8 million, or $0.69 per basic and diluted share, in the 2026 Quarter compared to $25.4 million, or $0.73 per basic and diluted share, in the 2025 Quarter. FFO is a non-GAAP supplemental earnings measure that management considers meaningful in measuring operating performance. A definition of FFO and reconciliation of net income to FFO is attached to this press release as page 9.  FFO available to common stockholders and noncontrolling interests was adversely impacted by $2.4 million, or $0.07 per basic and diluted share, due to the initial operations of Hampden House. Exclusive of Hampden House, FFO available to common stockholders and noncontrolling interests increased by $1.8 million primarily due to (a) higher residential base rent of $1.4 million and (b) higher commercial base rent of $1.2 million partially offset by (c) higher general and administrative costs of $0.4 million and (d) higher interest expense, net and amortization of deferred debt costs of $0.3 million.

On a same property basis, excluding Hampden House, the Residential portfolio was 97.3% leased at June 30, 2026 compared to 90.5% at June 30, 2025. The 6.8 percentage point increase is primarily due to increased occupancy at The Milton at Twinbrook Quarter, which was 96.7% leased at June 30, 2026 compared to 77.0% at June 30, 2025. Excluding The Milton at Twinbrook Quarter and Hampden House, the Residential portfolio was 97.6% leased at June 30, 2026 compared to 96.6% at June 30, 2025.

For the six months ended June 30, 2026 ("2026 Period"), total revenue increased to $155.1 million from $142.7 million for the six months ended June 30, 2025 ("2025 Period").  Net income decreased to $23.6 million for the 2026 Period from $27.0 million for the 2025 Period.  The decrease in net income was primarily due to the initial operations of Hampden House, which adversely impacted net income by $8.8 million, of which $5.7 million is related to interest expense, net and amortization of deferred debt costs. Exclusive of Hampden House, net income increased $5.4 million primarily due to (a) higher residential base rent of $3.5 million and (b) higher commercial base rent of $2.8 million partially offset by (c) higher general and administrative costs of $0.8 million. Net income available to common stockholders decreased to $12.3 million, or $0.50 per basic and diluted share, for the 2026 Period compared to $14.9 million, or $0.62 per basic and diluted share, for the 2025 Period. Compared to the 2025 Period, net income available to common stockholders for the 2026 Period was adversely impacted by $4.2 million, or $0.18 per basic and diluted share, due to the initial operations of Hampden House.

Same property revenue increased $9.8 million, or 7.2%, and same property net operating income increased $7.7 million, or 7.9%, for the 2026 Period compared to the 2025 Period.  Same property revenue was favorably impacted by $5.8 million due to the lease up of Twinbrook Quarter Phase I. Exclusive of Twinbrook Quarter Phase I, same property revenue increased $4.0 million primarily due to (a) higher commercial base rent of $2.1 million, (b) higher expense recoveries of $1.6 million and (c) higher residential base rent of $0.3 million. Same property net operating income was favorably impacted by $5.6 million due to the lease up of Twinbrook Quarter Phase I. Exclusive of Twinbrook Quarter Phase I, same property net operating income increased $2.1 million, primarily due to higher commercial base rent of $2.1 million. Shopping Center same property net operating income increased $2.5 million, or 3.5%, and Mixed-Use same property net operating income increased $5.2 million, or 20.1%. Shopping Center same property net operating income increased primarily due to (a) higher base rent of $2.1 million and (b) lower credit loss on operating lease receivables, net, of $0.5 million. Mixed-Use same property net operating income was favorably impacted by $5.6 million due to the lease up of Twinbrook Quarter Phase I. Exclusive of Twinbrook Quarter Phase I, Mixed-Use same property net operating income decreased by $0.4 million primarily due to higher credit losses on operating lease receivables, net, of $0.4 million. One property, Hampden House, was excluded from same property results.

FFO available to common stockholders and noncontrolling interests, after deducting preferred stock dividends, totaled $49.9 million, or $1.40 per basic and diluted share, for the 2026 Period compared to $49.9 million, or $1.44 per basic and diluted share, for the 2025 Period. FFO available to common stockholders and noncontrolling interests was adversely impacted by $5.6 million, or $0.16 per basic and diluted share, due to the initial operations of Hampden House. Exclusive of Hampden House, FFO available to common stockholders and noncontrolling interests increased by $5.6 million primarily due to (a) higher residential base rent of $3.5 million and (b) higher commercial base rent of $2.8 million partially offset by (c) higher general and administrative costs of $0.8 million.

Saul Centers, Inc. is a self-managed, self-administered equity REIT headquartered in Bethesda, Maryland, which currently operates and manages a real estate portfolio of 62 properties, which includes (a) 50 community and neighborhood shopping centers and nine mixed-use properties with approximately 10.6 million square feet of leasable area and (b) three non-operating land and development properties. Over 85% of the Saul Centers' property net operating income is generated by properties in the Washington, D.C./Baltimore metropolitan area.

Safe Harbor Statement

Certain matters discussed within this press release may be deemed to be forward-looking statements within the meaning of the federal securities laws.  For these statements, we claim the protection of the safe harbor for forward-looking statements contained in the Private Securities Litigation Reform Act of 1995.  Although the Company believes the expectations reflected in the forward-looking statements are based on reasonable assumptions, it can give no assurance that its expectations will be attained.  These factors include, but are not limited to, the risk factors described in our Annual Report on Form 10-K for the year ended December 31, 2025 and other periodic or current reports filed with the SEC and include the following: (i) macroeconomic conditions, including geopolitical instability (such as the ongoing conflicts in the Middle East and Ukraine) and changes in tariff and trade policy, which may lead to a disruption of, or lack of access to, sources of funding and rising inflation, (ii) the ability of our tenants to pay rent, (iii) our reliance on shopping center "anchor" tenants and other significant tenants, (iv) our substantial relationships with members of the B. F. Saul Company and certain other affiliated entities, each of which is controlled by B. Francis Saul II and his family members, (v) financing risks, such as increases in interest rates, restrictions imposed by our debt, our ability to meet existing financial covenants and our ability to consummate planned and additional financings on acceptable terms or at all, (vi) our access to additional capital, (vii) our development activities, (viii) our ability to successfully complete additional acquisitions, developments or redevelopments, or if they are consummated, whether such acquisitions, developments or redevelopments perform as expected, (ix) adverse trends in the retail, office and residential real estate sectors, (x) risks relating to cybersecurity and potential future uses of artificial intelligence, including disruption to our business and operations, reputational risk, regulatory risk, and exposure to liabilities from tenants, employees, capital providers, and other third parties, (xi) risks generally incident to the ownership of real property, including adverse changes in economic conditions, changes in the investment climate for real estate, changes in real estate taxes and other operating expenses, adverse changes in governmental rules and fiscal policies, the relative illiquidity of real estate and environmental risks, and (xii) risks related to our status as a REIT for federal income tax purposes, such as the existence of complex regulations relating to our status as a REIT, the effect of future changes to REIT requirements as a result of new legislation and the adverse consequences of any failure to qualify as a REIT.  Given these uncertainties, readers are cautioned not to place undue reliance on any forward-looking statements that we make, including those in this press release.  Except as may be required by law, we make no promise to update any of the forward-looking statements as a result of new information, future events or otherwise. You should carefully review the risks and risk factors included in our Annual Report on Form 10-K for the year ended December 31, 2025 and other periodic or current reports filed with the SEC.

Saul Centers, Inc.Consolidated Balance Sheets(Unaudited)
(Dollars in thousands, except per share amounts) June 30,2026 December 31,2025
Assets
Real estate investments
Land $          595,514 $          595,514
Buildings and equipment 2,174,092 2,162,135
Construction in progress 116,416 109,950
2,886,022 2,867,599
Accumulated depreciation (841,335) (812,035)
Total real estate investments, net 2,044,687 2,055,564
Cash and cash equivalents 5,877 8,741
Accounts receivable and accrued income, net 62,792 60,799
Deferred leasing costs, net 25,863 25,847
Other assets 20,251 11,727
Total assets $        2,159,470 $        2,162,678
Liabilities
Mortgage notes payable, net $        1,107,956 $        1,063,530
Revolving credit facility payable, net 85,281 144,678
Term loan facility payable, net 139,089 138,870
Construction loans payable, net 271,816 254,724
Accounts payable, accrued expenses and other liabilities 42,352 36,617
Deferred income 18,831 22,840
Dividends and distributions payable 24,589 24,162
Total liabilities 1,689,914 1,685,421
Equity
Preferred stock, 1,000,000 shares authorized:
Series D Cumulative Redeemable, 30,000 shares issued and outstanding 75,000 75,000
Series E Cumulative Redeemable, 44,000 shares issued and outstanding 110,000 110,000
Common stock, $0.01 par value, 50,000,000 shares authorized,24,777,583 and 24,551,168 shares issued and outstanding, respectively 248 245
Additional paid-in capital 463,289 459,222
Distributions in excess of accumulated earnings (354,452) (337,708)
Accumulated other comprehensive income 1,824 1,061
Total Saul Centers, Inc. equity 295,909 307,820
Noncontrolling interests 173,647 169,437
Total equity 469,556 477,257
Total liabilities and equity $        2,159,470 $        2,162,678
Saul Centers, Inc.Consolidated Statements of Operations(Unaudited)
Three Months EndedJune 30, Six Months EndedJune 30,
(In thousands, except per share amounts) 2026 2025 2026 2025
Revenues
Rental revenue $       75,378 $       69,426 $      152,200 $      139,973
Other 1,413 1,408 2,850 2,717
Total revenue 76,791 70,834 155,050 142,690
Expenses
Property operating expenses 13,552 11,424 29,291 25,166
Real estate taxes 8,811 8,016 17,275 16,000
Interest expense, net and amortization of deferred debt costs 20,034 16,820 39,684 33,567
Depreciation and amortization of deferred leasing costs 16,038 14,098 31,954 28,621
General and administrative 6,810 6,415 13,257 12,427
Total expenses 65,245 56,773 131,461 115,781
Gain on disposition of property — 120 — 120
Net income 11,546 14,181 23,589 27,029
Noncontrolling interests
Income attributable to noncontrolling interests (2,793) (3,461) (5,718) (6,510)
Net income attributable to Saul Centers, Inc. 8,753 10,720 17,871 20,519
Preferred stock dividends (2,799) (2,799) (5,597) (5,597)
Net income available to common stockholders $        5,954 $        7,921 $       12,274 $       14,922
Per share net income available to common stockholders
Basic and diluted $          0.24 $          0.33 $          0.50 $          0.62
Reconciliation of net income to FFO available to common stockholders andnoncontrolling interests (1)
Three Months EndedJune 30, Six Months EndedJune 30,
(In thousands, except per share amounts) 2026 2025 2026 2025
Net income $       11,546 $       14,181 $       23,589 $       27,029
Subtract:
Gain on disposition of property — (120) — (120)
Add:
Real estate depreciation and amortization 16,038 14,098 31,954 28,621
FFO 27,584 28,159 55,543 55,530
Subtract:
Preferred stock dividends (2,799) (2,799) (5,597) (5,597)
FFO available to common stockholders and noncontrolling interests $       24,785 $       25,360 $       49,946 $       49,933
Weighted average shares and units:
Basic 35,762 34,845 35,644 34,765
Diluted 35,816 34,866 35,691 34,786
Basic and diluted FFO per share available to common stockholders and noncontrolling interests $          0.69 $          0.73 $          1.40 $          1.44
(1) The National Association of Real Estate Investment Trusts ("Nareit") developed FFO as a relative non-GAAP financial measure of performance of an equity REIT in order to recognize that income-producing real estate historically has not depreciated on the basis determined under GAAP. FFO is defined by Nareit as net income, computed in accordance with GAAP, plus real estate depreciation and amortization, and excluding impairment charges on depreciable real estate assets and gains or losses from property dispositions. FFO does not represent cash generated from operating activities in accordance with GAAP and is not necessarily indicative of cash available to fund cash needs, which is disclosed in the Company's Consolidated Statements of Cash Flows for the applicable periods. FFO should not be considered as an alternative to net income, its most directly comparable GAAP measure, as an indicator of the Company's operating performance, or as an alternative to cash flows as a measure of liquidity. Management considers FFO a meaningful supplemental measure of operating performance because it primarily excludes the assumption that the value of the real estate assets diminishes predictably over time (i.e. depreciation), which is contrary to what the Company believes occurs with its assets, and because industry analysts have accepted it as a performance measure. FFO may not be comparable to similarly titled measures employed by other REITs.
Reconciliation of revenue to same property revenue (2)
Three Months EndedJune 30, Six Months EndedJune 30,
(In thousands) 2026 2025 2026 2025
Total revenue $       76,791 $       70,834 $      155,050 $      142,690
Revenue adjustments (1) (2,435) (2,739) (4,842) (5,095)
Acquisitions, dispositions and development properties (1,554) — (2,770) —
Total same property revenue $       72,802 $       68,095 $      147,438 $      137,595
Shopping Centers $       47,798 $       45,578 $       97,596 $       93,576
Mixed-Use properties 25,004 22,517 49,842 44,019
Total same property revenue $       72,802 $       68,095 $      147,438 $      137,595
Total Shopping Center revenue $       47,798 $       45,578 $       97,596 $       93,576
Shopping Center acquisitions, dispositions and development properties — — — —
Total Shopping Center same property revenue $       47,798 $       45,578 $       97,596 $       93,576
Total Mixed-Use property revenue $       26,558 $       22,517 $       52,612 $       44,019
Mixed-Use acquisitions, dispositions and development properties (1,554) — (2,770) —
Total Mixed-Use same property revenue $       25,004 $       22,517 $       49,842 $       44,019
(1) Revenue adjustments are straight-line base rent and amortization of premiums and discounts related to above/below market leases.
(2) Same property revenue is a non-GAAP financial measure of performance that management believes improves the comparability of reporting periods by excluding the results of properties that were not in operation for the entirety of the comparable reporting periods.  We define same property revenue as total revenue less straight-line base rent and amortization of above/below market premiums and discounts related to leases acquired in connection with purchased real estate investment properties minus the revenue of properties not in operation for the entirety of the comparable reporting periods.  Same property revenue is a measure of the operating performance of the Company's properties but does not measure the Company's performance as a whole.  Same property revenue should not be considered as an alternative to total revenue, its most directly comparable GAAP measure, as an indicator of the Company's operating performance.  Management considers same property revenue a meaningful supplemental measure of operating performance because it is not affected by the cost of the Company's funding, the impact of depreciation and amortization expenses, gains or losses from the acquisition and sale of operating real estate assets, general and administrative expenses or other gains and losses that relate to ownership of the Company's properties.  Management believes the exclusion of these items from same property revenue is useful because the resulting measure captures the actual revenue generated by operating the Company's properties.  Other REITs may use different methodologies for calculating same property revenue.  Accordingly, the Company's same property revenue may not be comparable to those of other REITs.
Mixed-Use same property revenue is composed of the following:
Three Months EndedJune 30, Six Months EndedJune 30,
(In thousands) 2026 2025 2026 2025
Residential Mixed-Use properties (residential activity) (1) $       13,263 $       11,529 $       26,456 $       22,125
Office Mixed-Use properties (2) 9,586 9,797 19,215 19,578
Residential Mixed-Use properties (retail activity) (3) 2,155 1,191 4,171 2,316
Total Mixed-Use same property revenue $       25,004 $       22,517 $       49,842 $       44,019
(1) Includes Clarendon South Block, The Waycroft, Park Van Ness and The Milton at Twinbrook Quarter.
(2) Includes Avenel Business Park, Clarendon Center – North and South Blocks, 601 Pennsylvania Avenue and Washington Square.
(3) Includes The Waycroft, Park Van Ness and Twinbrook Quarter Phase I.
Reconciliation of net income to same property net operating income (2)
Three Months EndedJune 30, Six Months EndedJune 30,
(In thousands) 2026 2025 2026 2025
Net income $       11,546 $       14,181 $       23,589 $       27,029
Interest expense, net and amortization of deferred debt costs 20,034 16,820 39,684 33,567
Depreciation and amortization of deferred leasing costs 16,038 14,098 31,954 28,621
General and administrative 6,810 6,415 13,257 12,427
Gain on disposition of property — (120) — (120)
Revenue adjustments (1) (2,435) (2,739) (4,842) (5,095)
Total property net operating income 51,993 48,655 103,642 96,429
Acquisitions, dispositions, and development properties 14 — 453 —
Total same property net operating income $       52,007 $       48,655 $      104,095 $       96,429
Shopping Centers $       36,555 $       35,296 $       73,033 $       70,569
Mixed-Use properties 15,452 13,359 31,062 25,860
Total same property net operating income $       52,007 $       48,655 $      104,095 $       96,429
Shopping Center property net operating income $       36,555 $       35,296 $       73,033 $       70,569
Shopping Center acquisitions, dispositions and development properties — — — —
Total Shopping Center same property net operating income $       36,555 $       35,296 $       73,033 $       70,569
Mixed-Use property net operating income $       15,438 $       13,359 $       30,609 $       25,860
Mixed-Use acquisitions, dispositions and development properties 14 — 453 —
Total Mixed-Use same property net operating income $       15,452 $       13,359 $       31,062 $       25,860
(1) Revenue adjustments are straight-line base rent and amortization of premiums and discounts related to above/below market leases.
(2) Same property net operating income is a non-GAAP financial measure of performance that management believes improves the comparability of reporting periods by excluding the results of properties that were not in operation for the entirety of the comparable reporting periods.  We define same property net operating income as net income plus (a) interest expense, net and amortization of deferred debt costs, (b) depreciation and amortization of deferred leasing costs, (c) general and administrative expenses, (d) change in fair value of derivatives, and (e) loss on the early extinguishment of debt minus (f) gains on property dispositions, (g) straight-line base rent, (h) amortization of above/below market premiums and discounts related to leases acquired in connection with purchased real estate investment properties and (i) the net operating income of properties that were not in operation for the entirety of the comparable periods.  Same property net operating income is a measure of the operating performance of the Company's properties but does not measure the Company's performance as a whole.  Same property net operating income should not be considered as an alternative to net income, its most directly comparable GAAP measure, as an indicator of the Company's operating performance.  Management considers same property net operating income a meaningful supplemental measure of operating performance because it is not affected by the cost of the Company's funding, the impact of depreciation and amortization expenses, gains or losses from the acquisition and sale of operating real estate assets, general and administrative expenses or other gains and losses that relate to ownership of the Company's properties.  Management believes the exclusion of these items from property net operating income is useful because the resulting measure captures the actual revenue generated and actual expenses incurred by operating the Company's properties.  Other REITs may use different methodologies for calculating same property net operating income.  Accordingly, same property net operating income may not be comparable to those of other REITs.
Mixed-Use same property net operating income is composed of the following:
Three Months EndedJune 30, Six Months EndedJune 30,
(In thousands) 2026 2025 2026 2025
Residential Mixed-Use properties (residential activity) (1) $        8,086 $        6,500 $       16,104 $       12,232
Office Mixed-Use properties (2) 5,963 6,208 12,103 12,326
Residential Mixed-Use properties (retail activity) (3) 1,403 651 2,855 1,302
Total Mixed-Use same property net operating income $       15,452 $       13,359 $       31,062 $       25,860
(1) Includes Clarendon South Block, The Waycroft, Park Van Ness and The Milton at Twinbrook Quarter.
(2) Includes Avenel Business Park, Clarendon Center – North and South Blocks, 601 Pennsylvania Avenue and Washington Square.
(3) Includes The Waycroft, Park Van Ness and Twinbrook Quarter Phase I.

Cision View original content:https://www.prnewswire.com/news-releases/saul-centers-inc-reports-second-quarter-2026-earnings-302845418.html

SOURCE Saul Centers, Inc.

View all news

NYSE: BFS

Loading ...

Latest

Annual Report to Security Holders

Latest Proxy

Copyright 2026, © Powered By Q4 Inc.


Saul Centers, Inc. | 7501 Wisconsin Ave., Suite 1500E | Bethesda, MD 20814 | 301-986-6200 | 301-986-6079 Fax © Copyright 2021

REQUEST A MEETING WITH MANAGEMENT

Close menu

Prompts

Saul Centers, Inc. (ticker BFS), listed in United States.

ETFs Holding Saul Centers, Inc.

ETF Weight in ETF Shares Market value As of
BYRE 1.21% 8,260 $ 308.841K Jun 30, 2026
SIXL 0.35% 25,981 $ 738.9K Nov 12, 2026
DFAR 0.03% 90,468 $ 2.573M Nov 12, 2026
DFGR 0.02% 26,668 $ 758.438K Nov 12, 2026

Securities

Ticker Type Class Market Exchange Last price Price date
BFS canonical Common share — US nyse 30.08 USD 2026-09-30
BFS$D Preferred — US nyse — —
BFS$E Preferred — US nyse — —