Bread Financial Holdings, Inc. is a financial services company that provides payment, lending, and saving solutions to U.S. consumers. The company operates through a single reportable segment, generating revenue primarily from interest and fees on loans. Its core business involves issuing co-brand and private label credit cards in partnership with major consumer brands, alongside direct-to-consumer general purpose credit cards. Key product lines include Bread Pay, which offers installment loans and pay-over-time financing, and Bread Savings, which provides high-yield savings accounts and certificates of deposit. The company also offers individual retirement accounts. Bread Financial partners with numerous well-known brands across travel, entertainment, apparel, health and beauty, jewelry, and technology sectors. Notable partners include AAA, Academy Sports + Outdoors, Caesars, Dell Technologies, Hard Rock International, the NFL, Raymour & Flanigan, Saks Fifth Avenue, Signet, Ulta, and Victoria’s Secret. The company serves a diverse customer base ranging from Gen Z to Baby Boomers, tailoring products such as cash flow management tools for younger demographics and rewards-based credit cards for older demographics. Bread Savings products are issued through Comenity Capital Bank, a subsidiary of the company.

Summarised from the company's own disclosures, fiscal year ended Feb 2026

Industry Credit Services Homepage breadfinancial.com
Sector Financial Services IR page investor.breadfinancial.com
Tags
credit card issuing, private label credit, co-brand credit, installment loans, pay-over-time financing, savings accounts, certificates of deposit, retail finance, consumer lending, direct-to-consumer banking, Bread Financial, Bread Pay, Bread Savings, Bread Cashback, Comenity Capital Bank, AAA, Academy Sports + Outdoors, Caesars, Dell Technologies, Hard Rock International, NFL, Raymour & Flanigan, Saks Fifth Avenue, Signet, Ulta, Victoria’s Secret, Ross Dress for Less, HP
Press page —

Metrics

Valuation  
Market cap $ 858.8M
Market cap (USD) $ 858.8M
P/E 1.78
PEG 0.05
P/BV 0.25
P/S 0.22
P/OCF 0.39
P/FCF 0.41
Dividend yield 4.1%
Turnover / mcap —
Returns  
ROE 16.2%
ROI 6.8%
ROIC 6.8%
Profit margin 13.5%
Growth  
Revenue growing No
Profits growing No
Revenue up 3y No
Revenue up 5y No
Earnings growth 3y (net profit CAGR) 32.7%
Quality  
Profitable Yes
Margin expanding No
Buying back stock Yes
Diluting (TTM) No
Debt/Equity 129.5%
Podcast bulls (TTM) Sign up
Podcast bears (TTM) Sign up
Podcast sentiment (TTM) Sign up
Podcast sentiment % (TTM) Sign up
News sentiment (TTM) 21
Quality score 36.8%
Insiders  
Buys, 1w Sign up
Buys, 1m Sign up
Buys, 1y Sign up
Sells, 1w Sign up
Sells, 1m Sign up
Sells, 1y Sign up

Sign up to see this company's insider trades

Figure FY 2025 FY 2024 FY 2023 FY 2022 FY 2021 FY 2020 FY 2019 FY 2018 FY 2017 FY 2016 FY 2015 FY 2014 FY 2013 FY 2012 FY 2011 FY 2010 FY 2009 FY 2008 FY 2007 FY 2006 FY 2005 FY 2004 FY 2003 FY 2002 FY 2001 FY 2000
Revenue 3.845B 3.838B 4.295B 3.87B 3.27B 577.2M 840.2M 3.085B 7.719B 7.138B 6.44B 5.303B 4.319B 3.641B 3.173B 2.791B 1.964B 2.025B 2.291B 1.999B 1.552B 1.257B 1.049B 871.451M 777.351M 678.195M
Net profit 518M 277M 718M 223M 801M 213.7M 278M 963.1M 788.7M 517.6M 605.428M 516.14M 496.17M 422.256M 315.286M 193.737M 143.734M 217.393M 164.061M 189.605M 138.745M 102.371M 67.298M 26.203M -8.232M -21.323M
Free cash flow 2.092B 1.859B 1.987B 1.78B 1.459B 1.829B 1.075B 2.555B 2.384B 1.881B 1.514B 1.185B 868.116M 1.018B 937.845M 833.954M 305.444M 401.463M 454.869M 368.428M 43.181M 304.738M 78.849M 85.383M 133.044M 54.1M

Figure FY 2025 FY 2024 FY 2023 FY 2022 FY 2021 FY 2020 FY 2019 FY 2018 FY 2017 FY 2016 FY 2015 FY 2014 FY 2013 FY 2012 FY 2011 FY 2010 FY 2009 FY 2008 FY 2007 FY 2006 FY 2005 FY 2004 FY 2003 FY 2002 FY 2001 FY 2000
Share price 74.03 61.06 32.94 37.66 66.57 74.1 112.2 150.08 253.48 228.5 276.57 286.05 262.93 144.76 103.84 70.88 64.59 — — — — — — — — —
Price performance 12m 0.21 0.85 -0.13 -0.43 -0.1 -0.34 -0.25 -0.41 0.11 -0.17 -0.03 0.09 0.82 0.39 0.47 0.1 — — — — — — — — — —

Filed figures

Figure Dec 2016 Dec 2017 Dec 2018 Dec 2019 Dec 2020 Dec 2021 Dec 2022 Dec 2023 Dec 2024 Dec 2025
Balance sheet detail
Trade receivables (USD) 797M 822M 924M 451M 384M — — — — —
↳ YoY growth +12.8% +3.1% +12.4% -51.2% -14.9%
↳ 5y CAGR +21.5% +17.3% +18.5% -9.5% -11.5%
Borrowings, current (USD) 815M 131M 145M — — — — — — —
Borrowings, non-current (USD) 4.79B 5.95B 5.59B — — — — — — —
Lease liabilities (USD) — — 533M 314M 300M 140M 126M 148M 128M 85M
Cash and deposits (USD) 1.86B 4.19B 3.86B 3.87B 3.08B 3.05B 3.89B 3.59B 3.68B 3.6B
Intangible assets (USD) 1B 801M 540M 153M 81.7M 53M 165M 128M 112M 82M
Right-of-use assets (USD) — — 451M 264M 233M 97M 88M 98M 87M 63M
Net debt (borrowings + leases - cash) (USD) 3.74B 1.89B 2.41B — — — — — — —
Cash flow detail
Operating cash flow (USD) 2.09B 2.61B 2.75B 1.22B 1.88B 1.54B 1.85B 1.99B 1.86B 2.09B
Purchases of property, plant and equipment (USD) -207M -225M -200M -142M -54M -84M -68M — — —
Change in receivables (cash effect) (USD) -95.6M -10.3M -93M 4.1M 64.9M — — — — —
Change in payables (cash effect) (USD) -35.6M 167M -93.7M -255M 62.1M — — — — —
Dividends paid (cash effect) (USD) -30M -116M -125M -127M -60.6M -42M -43M -42M -43M -40M
Share buybacks (cash effect) (USD) -799M -554M -443M -976M — 0.00 -12M -35M -55M -313M
Interest paid (cash effect) (USD) -405M -551M -720M -672M -488M -357M -466M -861M -922M -868M
Income taxes paid (cash effect) (USD) -467M -344M -234M -1.07B -268M -325M -338M -292M -227M -53M
Share-based compensation (USD) 76.5M 75.1M 80.8M 54.8M 21.3M 29M 33M 44M 54M 56M
Operating cash flow before change in receivables (USD) 2.18B 2.62B 2.85B 1.21B 1.82B — — — — —
Free cash flow (OCF - PPE - intangibles) (USD) 1.88B 2.38B 2.56B 1.08B 1.83B 1.46B 1.78B — — —
Income detail
Total comprehensive income (USD) 504M 799M 965M 316M 309M 804M 204M 720M 274M 524M
Comprehensive income to owners (USD) 503M 799M 965M 316M 309M 804M 204M 720M 274M 524M
Reported Feb 27, 2017 Feb 27, 2018 Feb 26, 2019 Feb 28, 2020 Feb 26, 2021 Feb 20, 2024 Feb 20, 2024 Feb 20, 2024 Feb 14, 2025 Feb 13, 2026

Sign up to see institutional holdings

Sign Up

Podcast Mentions

Sign up to see podcast mentions and sentiment

Sign Up

COLUMBUS, Ohio, November 10, 2026 – Bread Financial Holdings, Inc. (NYSE: BFH), a tech-forward financial services company that provides simple, personalized payment, lending, and saving solutions to millions of U.S. consumers, provided a performance update. The following tables present the Company’s Net principal loss rate and Delinquency rate for the periods indicated:

For the

month ended

October 31, 2026 For the

month ended

October 31, 2025

(dollars in millions)

End-of-period credit card and other loans

$ 18,961 $ 17,694

Average credit card and other loans

$ 18,846 $ 17,627

Year-over-year change in average credit card and other loans

6.9 % (1.3 %)

Net principal losses

$ 107 $ 112

Net principal loss rate

6.69 % 7.50 %

As of

October 31, 2026 As of

October 31, 2025

(dollars in millions)

30 days + delinquencies – principal

$ 939 $ 963

Period ended credit card and other loans – principal

$ 16,665 $ 15,903

Delinquency rate

5.64 % 6.05 %

About Bread Financial®

Bread Financial®(NYSE: BFH) is a tech-forward financial services company that provides simple, personalized payment, lending and saving solutions to millions of U.S. consumers.

Affordability in America QT

Quicktake: Consumer insights from Bread Financial

Learn more about working with Bread Financial

Share on Linkedin Share on Facebook Share on X Share via email

A majority (61%) of U.S. consumers are concerned about inflation. But the impact of rising prices isn’t felt evenly across all consumers: 64% of lower-income consumers completely agree they are focused more on buying what they need versus what they want, compared to 48% of higher income consumers.

How are consumers stretching their wallets? Nearly 40% claim to be trying to spend less overall, led by lower-income consumers at 46%, followed by middle-income consumers at 38% and higher-income consumers at 31%. Read on to find out more about how income influences consumers’ savings strategies.

Lower-income consumers are more willing to trade down
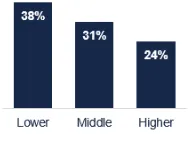
Nearly four in 10 (38%) of lower-income consumers completely agree they are willing to trade down on quality to save money on purchases, compared to 24% of higher-income consumers.
 

Trading quality for price

Image

Affordability in America QT

Sales-seeking is consistent across income groups
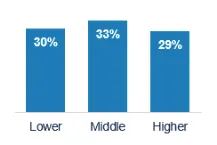
31% of consumers across income groups are shopping for sales and promotions more often. Here, middle-income consumers hold a slight lead at 33% while lower- and higher-income groups are at or near 30%.
 

Seeking sales and promotions

Image

Affordability in America QT

Middle- and higher-income consumers are more likely to delay large purchases
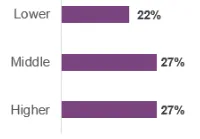
Middle- (27%) and higher-income (27%) consumers lead in delaying a major purchase (e.g., purchasing a car, furniture, home improvement, etc.).

Delaying large purchases

Image

Affordability in America QT

Key takeaway: Understand which savings lever your customers are using
Brands shouldn’t assume that higher income equates to a willingness to spend or that discounts only appeal to lower-income shoppers. The key is to tap into your customers’ savings behaviors.  Consider testing different offers to see which are more successful at driving incremental sales across your customer base. Where appropriate, focus on long-term value messaging and offer transparent payment choices to reduce consumer hesitancy, particularly in the big-ticket space.

Source: Bread Financial proprietary study, Consumers & Payments, October 2026.

Note: Lower income = $0 - $49,999 in annual HHI; Middle income = $50,000 - $149,999 in annual HHI; Higher income = $150,000+ in annual HHI

About Bread Financial®​ 

Bread Financial® (NYSE: BFH) is a tech-forward financial services company that provides simple, personalized payment, lending and saving solutions to millions of U.S. consumers. Our payment solutions deliver growth for some of the most recognized brands in travel & entertainment, health & beauty, technology, electronics, jewelry, home and specialty apparel through our co-brand and private label credit cards and pay-over-time products providing choice and value to our shared customers. Additionally, we offer Bread Financial general purpose credit cards and saving products that empower our customers and their passions for a better life.​ 

Bread Financial proudly marks 30 years of success in 2026. To learn more about our global associates, our performance and our sustainability progress, visit breadfinancial.com  or follow us on Instagram  and LinkedIn . 
 

Scroll back to the top

Related News

BTS Hindsight

Survey

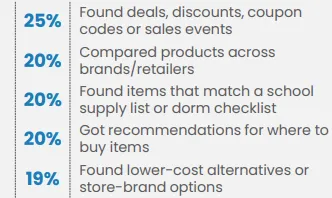
Quicktake: Inflation weighs on back-to-school shoppers

September 30, 2026
Woman paying at the pump

Survey

Quicktake: Fuel costs cause some shoppers to tap the brakes on spending

August 7, 2026
Holiday 2025

Survey

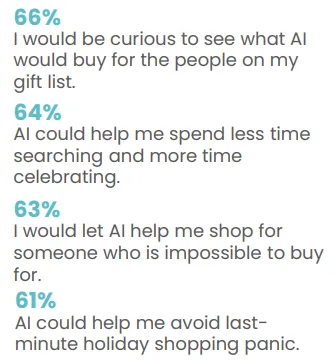
Holiday 2025: ChatGPT enters the conversation

November 3, 2025

BTS Hindsight

Survey

Quicktake: Inflation weighs on back-to-school shoppers

September 30, 2026

Woman paying at the pump

Survey

Quicktake: Fuel costs cause some shoppers to tap the brakes on spending

August 7, 2026

Holiday 2025

Survey

Holiday 2025: ChatGPT enters the conversation

November 3, 2025

Go to next slide

Jump to slide 1 Jump to slide 2 Jump to slide 3

Logo

Bread Finicial Homepage

Bread Financial Linkedin Bread Financial Facebook Bread Financial X

© 2026 Bread Financial. Comenity Capital Bank is a Bread Financial company.

People and Culture header. Dark blue background and bauhaus elements included.

Share on Linkedin Share on Facebook Share on X Share via email

The last three months at Bread Financial® brought many moments for our associates to come together and Pay It Forward.

Bread Financial recently celebrated its annual Giving Campaign,a two-week campaign that matches eligible associates 100%, which led to higher impact in recent months. Including the Giving Campaign’s record numbers, Bread Financial and its associates contributed over $3.5 million in the last quarter. On top of this, 459 associates volunteered nearly 2,500 hours across 107 nonprofits.

Learn more about the 2026 Giving Campaign

Volunteer spotlight: India associates support education through donation, volunteering
Bread Financial recently committed $10,000 USD to Makkala Jagrithi , a non-governmental organization (NGO) with a mission to empower youth through access to education. On top of the donation, Bread Financial's Sustainability Committee, which brings associates together to support environmental efforts through volunteering and awareness activities, partnered with Makkala Jagrithi to support a school adoption initiative at Government Higher Primary School, Devanahalli.

More than 50 volunteers assembled nearly 100 educational kits for students. The following day, a group of associates visited the school to distribute the kits and spend time engaging with students, creating a meaningful and memorable learning experience.

"It was inspiring to see associates come together for our sustainability event, packing and distributing educational kits for young learners," Sasikumar Ananthan, senior director, platform engineering, said. "It was a rewarding experience to see our commitment to giving back translated into meaningful action for the students and the school community. Together, we supported young learners through a simple initiative that reflects our commitment to education, sustainability and giving back."

Image

Q3 Community Impact

Bread Financial associates pictured packing educational kits for students.

Volunteer spotlight: People & Culture team develops skills-based learning with Canine Companions
Canine Companions , a nonprofit that provides service dogs to adults, children and veterans with disabilities, recently identified a need for additional staff training through its annual employee engagement survey. Bread Financial's People & Culture team helped bring that opportunity to life with a specialized training session for more than 40 of the nonprofit’s leaders.

The “Productive Conversations” session was tailored to the organization and focused on practical skills for navigating difficult conversations, listening to understand and validating emotions.

“I enjoyed the opportunity to use my professional skills in a way that could make a meaningful difference,” Chris Hammond, corporate trainer, people management and development, said. “Working with the leaders at Canine Companions reinforced how I can put my knowledge and experience to work in the community.”

The collaboration reflects Bread Financial’s growing focus on skills-based volunteer opportunities that allow associates to share their professional expertise with community partners. The series will continue in November with a “Cascading Communication” session.

Image

Q3 Community Impact

One of Canine Companion's service dogs pictured.

Company program spotlight: Help Right Here impacts those in need
Funded by associates, for associates, Help Right Here provides financial assistance to those facing unexpected hardship. Associates can apply for support following a natural disaster, catastrophic event or personal tragedy to help ease the financial burden. So far in 2026, the fund has provided nearly $70,000 in financial assistance to associates in need.

Maria Muñoz, an associate who was supported by the program following her breast cancer diagnosis shares, “I had to put money down for treatments each week. Having that financial assistance was a huge weight off my shoulders.”

Nonprofit partner spotlight: 2nd and 7 brightens volunteer space
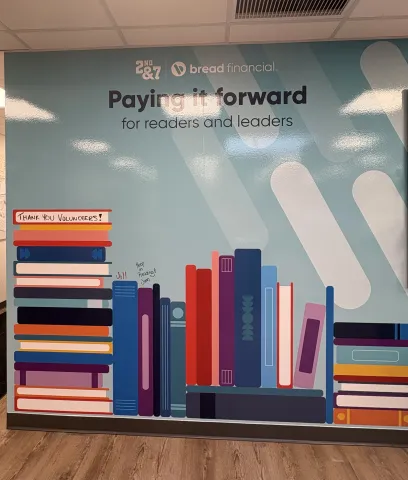
In August, Bread Financial built a special installation in the 2nd & 7 Columbus Kids’ Book Bank Volunteer Area. 2nd & 7 promotes a life-long love of reading for kids by providing free books and positive role models.

This new interactive wall art allows volunteers to sign their name or take pictures in the space while helping the next generation of readers. The mural represents Bread Financial's shared commitment to building early literacy and math skills.

"The mural is really going to liven up our volunteer space,” Mike Jones, director at the 2nd & 7 Columbus Kids' Book Bank, said. "It aligns with who we are and what we do at 2nd & 7. We’re excited for groups to come in, and as they’re sorting through thousands of books to get them out into the community, they’re going to be able to leave their mark.”

Image

Q3 Community Impact

The new volunteer space wall art located at the 2nd & 7 Columbus Kids' Book Bank.

About Bread Financial®​ 

Bread Financial® (NYSE: BFH) is a tech-forward financial services company that provides simple, personalized payment, lending and saving solutions to millions of U.S. consumers. Our payment solutions deliver growth for some of the most recognized brands in travel & entertainment, health & beauty, technology, electronics, jewelry, home and specialty apparel through our co-brand and private label credit cards and pay-over-time products providing choice and value to our shared customers. Additionally, we offer Bread Financial general purpose credit cards and saving products that empower our customers and their passions for a better life.​ 

Bread Financial proudly marks 30 years of success in 2026. To learn more about our global associates, our performance and our sustainability progress, visit breadfinancial.com  or follow us on Instagram  and LinkedIn . 
 

Scroll back to the top

Related News

Giving Campaign

Community

Giving Campaign raises $2.1 million for 1,000+ nonprofits

October 7, 2026
Bread Financial associates in India display tote bags created for a volunteer project.

Culture

Bread Financial® creates meaningful community impact through…

August 17, 2026
Graysen Sinkewicz

Culture

From the sidelines to center court: Graysen's Mile Champion journey

October 16, 2026

Giving Campaign

Community

Giving Campaign raises $2.1 million for 1,000+ nonprofits

October 7, 2026

Bread Financial associates in India display tote bags created for a volunteer project.

Culture

Bread Financial® creates meaningful community impact through…

August 17, 2026

Graysen Sinkewicz

Culture

From the sidelines to center court: Graysen's Mile Champion journey

October 16, 2026

Go to next slide

Jump to slide 1 Jump to slide 2 Jump to slide 3

Logo

Bread Finicial Homepage

Bread Financial Linkedin Bread Financial Facebook Bread Financial X

© 2026 Bread Financial. Comenity Capital Bank is a Bread Financial company.

Prompts

Bread Financial Holdings, Inc. (ticker BFH), listed in United States.

Company History

Date Change Detail
Mar 24, 2022 Renamed ALLIANCE DATA SYSTEMS CORP → BREAD FINANCIAL HOLDINGS, INC.
— Former tickers BDFNV

ETFs Holding Bread Financial Holdings, Inc.

ETF Weight in ETF Shares Market value As of
MVPA 5.99% 38,742 $ 4.198M Jun 30, 2026
CTEF 4.95% 298,829 $ 28.93M Nov 18, 2026
ALIL 2.43% 5,173 $ 500K Nov 18, 2026
CGV 1.56% 18,630 $ 2.013M Jul 31, 2026
SAWS 1.55% 1,120 $ 121.038K Jul 31, 2026
HDGE short -1.36% -6,000 $ -580.92K Nov 17, 2026
FSML 1.06% 12,281 $ 1.331M Jun 30, 2026
SYLD 0.98% 90,014 $ 9.728M Jul 31, 2026
MYLD 0.97% 3,057 $ 330.37K Jul 31, 2026
SURE 0.95% 5,625 $ 544.613K Nov 17, 2026
PSC 0.92% 198,161 $ 21.471M Jun 30, 2026
VAMO 0.90% 9,096 $ 983.005K Jul 31, 2026
FSEV 0.86% 530 $ 57.426K Jun 30, 2026
CLSE 0.82% 71,011 $ 7.419M Aug 31, 2026
OASC 0.79% 7,087 $ 740.379K Aug 31, 2026
BSVO 0.69% 170,936 $ 16.55M Nov 18, 2026
SMIZ 0.64% 16,860 $ 1.761M Aug 31, 2026
SEIS 0.62% 33,339 $ 3.612M Jun 30, 2026
HWSM 0.53% 135 $ 14.627K Jun 30, 2026
LITL 0.51% 299 $ 28.949K Nov 17, 2026
BRNY 0.50% 28,907 $ 2.8M Nov 18, 2026
BRES 0.49% 30,722 $ 2.97M Nov 18, 2026
AFSM 0.42% 6,302 $ 614.193K Nov 16, 2026
AVUV 0.40% 1,332,001 $ 129.817M Nov 16, 2026
DFSV 0.35% 985,805 $ 96.52M Nov 12, 2026
AVSC 0.26% 84,166 $ 8.203M Nov 16, 2026
RUSC 0.26% 1,878 $ 203.481K Jun 30, 2026
SQLV 0.23% 602 $ 65.227K Jun 30, 2026
DFAT 0.22% 717,177 $ 70.219M Nov 12, 2026
RESM 0.21% 72 $ 7,801.20 Jun 30, 2026
FTKI 0.20% 514 $ 50.094K Nov 16, 2026
MSSM 0.16% 10,913 $ 1.14M Aug 31, 2026
VFVA 0.15% 14,185 $ 1.482M Aug 31, 2026
GMOV 0.15% 1,491 $ 155.765K Aug 31, 2026
EBI 0.13% 8,832 $ 922.679K Aug 31, 2026
DFAS 0.11% 370,760 $ 36.301M Nov 12, 2026
FSCC 0.08% 2,655 $ 277.368K Aug 31, 2026
JMEE 0.07% 21,959 $ 2.126M Nov 17, 2026
SMDX 0.07% 911 $ 88.786K Nov 17, 2026
VFMO 0.06% 10,702 $ 1.118M Aug 31, 2026
DXUV 0.06% 36,967 $ 3.619M Nov 12, 2026
AVSU 0.04% 2,107 $ 205.348K Nov 16, 2026
VFQY 0.04% 1,800 $ 188.046K Aug 31, 2026
AVUS 0.03% 38,814 $ 3.783M Nov 16, 2026
DFUV 0.02% 37,991 $ 3.72M Nov 12, 2026
DFSU 0.02% 5,746 $ 562.591K Nov 12, 2026
DFAC 0.02% 191,395 $ 18.739M Nov 12, 2026
SFGV 0.02% 2,162 $ 210K Nov 18, 2026
DCOR 0.02% 86,385 $ 8.458M Nov 12, 2026
DFAU 0.01% 9,209 $ 901.653K Nov 12, 2026
DFUS 0.01% 11,738 $ 1.149M Nov 12, 2026
FESM 0.00% 1,846 $ 200.014K Jun 30, 2026
NTRL 0.00% 2,113 $ 0.00 Nov 16, 2026

Securities

Ticker Type Class Market Exchange Last price Price date
BFH canonical Common share — US nyse 22.60 USD 2026-11-10
BFH$A Preferred — US nyse — —
BFH$B Preferred — US nyse — —
BFH$C Preferred — US nyse — —