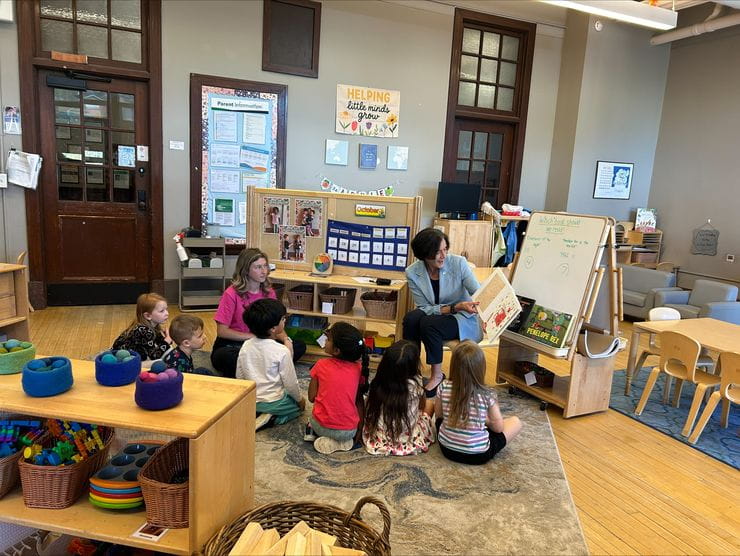
Bright Horizons Family Solutions Inc. is a provider of early education, child care, back-up care, and educational advisory services. The company operates in three reportable segments: full service center-based child care, back-up care, and educational advisory services. Its offerings include employer-sponsored child care centers, in-home and center-based back-up care, senior care, pet care, and workforce education solutions such as tuition assistance and college admissions advisory. Bright Horizons serves working families and employer-clients, primarily under multi-year contracts, across the United States, United Kingdom, Netherlands, Australia, and India. The company was founded in 1986 and formed its current structure through a 1998 merger of Bright Horizons, Inc. and Corporate Family Solutions, Inc.

Summarised from the company's own disclosures, fiscal year ended Feb 2026

Industry Education & Training Services Homepage brighthorizons.com
Sector Consumer Defensive IR page brighthorizons.com
Tags
early education, child care, back-up care, employer-sponsored benefits, workforce education, tuition assistance, senior care, preschool, employee benefits, educational advisory, EdAssist, Bright Horizons Family Solutions, Family Information Center, Bright Horizons Foundation for Children, Corporate Family Solutions Inc.
Press page brighthorizons.com/newsroom

Metrics

Valuation  
Market cap $ 3.066B
Market cap (USD) $ 3.066B
P/E -21.45
PEG —
P/BV 4.80
P/S 1.00
P/OCF 8.61
P/FCF 12.10
Dividend yield —
Turnover / mcap —
Returns  
ROE 14.8%
ROI 9.3%
ROIC 10.8%
Profit margin 6.6%
Growth  
Revenue growing Yes
Profits growing Yes
Revenue up 3y Yes
Revenue up 5y Yes
Earnings growth 3y (net profit CAGR) 34.0%
Quality  
Profitable Yes
Margin expanding Yes
Buying back stock Yes
Diluting (TTM) No
Debt/Equity 169.1%
Podcast bulls (TTM) Sign up
Podcast bears (TTM) Sign up
Podcast sentiment (TTM) Sign up
Podcast sentiment % (TTM) Sign up
News sentiment (TTM) 19
Quality score 50.0%
Insiders  
Buys, 1w Sign up
Buys, 1m Sign up
Buys, 1y Sign up
Sells, 1w Sign up
Sells, 1m Sign up
Sells, 1y Sign up

Sign up to see this company's insider trades

Figure FY 2025 FY 2024 FY 2023 FY 2022 FY 2021 FY 2020 FY 2019 FY 2018 FY 2017 FY 2016 FY 2015 FY 2014 FY 2013 FY 2012
Revenue 2.934B 2.686B 2.418B 2.02B 1.755B 1.515B 2.062B 1.903B 1.741B 1.57B 1.458B 1.353B 1.219B 1.071B
Net profit 193.116M 140.191M 74.223M 80.641M 70.459M 26.992M 180.386M 157.981M 156.963M 94.76M 93.927M 72.035M 12.623M 8.162M
Free cash flow 258.549M 240.151M 165.12M 117.915M 163.762M 124.832M 218.508M 202.256M 148.15M 137.963M 92.271M 108.103M 90.17M 37.896M

Figure FY 2025 FY 2024 FY 2023 FY 2022 FY 2021 FY 2020 FY 2019 FY 2018 FY 2017 FY 2016 FY 2015 FY 2014 FY 2013 FY 2012
Share price 101.4 110.85 94.24 63.1 125.88 172.99 150.29 111.45 94 70.02 66.8 47.01 36.74 —
Price performance 12m -0.09 0.18 0.49 -0.5 -0.27 0.15 0.35 0.19 0.34 0.05 0.42 0.28 — —

Filed figures

Figure Dec 2016 Dec 2017 Dec 2018 Dec 2019 Dec 2020 Dec 2021 Dec 2022 Dec 2023 Dec 2024 Dec 2025
Balance sheet detail
Trade receivables (USD) 97.2M 117M 131M 149M 177M 211M 217M 282M 283M 294M
↳ YoY growth -0.1% +20.5% +12.0% +13.5% +18.7% +19.5% +2.9% +29.7% +0.6% +3.8%
↳ 5y CAGR +9.9% +13.3% +10.8% +12.4% +12.7% +16.8% +13.1% +16.5% +13.7% +10.7%
Borrowings, current (USD) 10.8M 10.8M 10.8M 10.8M 10.8M 16M 16M 18.5M 28.5M 0.00
Borrowings, non-current (USD) 1.05B 1.05B 1.04B 1.03B 1.02B 976M 962M 944M 918M 748M
Lease liabilities (USD) — — 71.8M 769M 817M 791M 904M 897M 846M 813M
Cash and deposits (USD) 14.6M 23.2M 15.5M 27.9M 384M 261M 36.2M 71.6M 110M 140M
Intangible assets (USD) 375M 349M 323M 305M 275M 251M 246M 217M 198M 193M
Right-of-use assets (USD) — — 0.00 701M 718M 696M 802M 775M 726M 682M
Net debt (borrowings + leases - cash) (USD) 1.05B 1.03B 1.03B 1.78B 1.46B 1.52B 1.85B 1.79B 1.68B 1.42B
Cash flow detail
Operating cash flow (USD) 213M 236M 295M 330M 210M 227M 188M 256M 337M 351M
Purchases of property, plant and equipment (USD) -75.3M -88.1M -92.5M -112M -84.7M -63.5M -70.6M -91M -97.3M -92.2M
Change in receivables (cash effect) (USD) -78,000 -18.7M -14.5M -15.7M -27.5M -34.6M -4.88M -64.5M -993,000 -8.84M
Change in payables (cash effect) (USD) -6.86M 5.91M 15.9M 9.03M 23M 6.24M 20M 26M 30.6M -1.74M
Share buybacks (cash effect) (USD) -113M -162M -127M -31.6M -32.7M -214M -183M 0.00 -84.6M -225M
Interest paid (cash effect) (USD) -37.1M -44.5M -46.1M -43.1M -35.3M -32.2M -40.9M -74M -73.9M -55.9M
Income taxes paid (cash effect) (USD) -34.7M -31.3M -41.9M -50.6M -11M -31.7M -50.2M -58.7M -75.7M -72.6M
Share-based compensation (USD) 11.6M 12.1M 13.8M 17.3M 21M 23.1M 28.1M 28.8M 33.6M 30.6M
Operating cash flow before change in receivables (USD) 213M 255M 309M 346M 237M 262M 193M 321M 338M 360M
Free cash flow (OCF - PPE - intangibles) (USD) 138M 148M 202M 219M 125M 164M 118M 165M 240M 259M
Income detail
Total comprehensive income (USD) 44.6M 213M 129M 192M 50.3M 60.2M 47.4M 85.8M 89M 259M
Comprehensive income to owners (USD) — — 129M 192M 50.3M 60.2M 47.4M 85.8M 89M 259M
Provision for credit losses (USD) 839,000 2.54M 1.15M 840,000 2.59M 2.73M 1.28M 803,000 2.38M 1.41M
Credit cost ratio (credit losses / average receivables) (%) 0.9% 2.4% 0.9% 0.6% 1.6% 1.4% 0.6% 0.3% 0.8% 0.5%
Reported Mar 1, 2017 Feb 28, 2018 Mar 1, 2021 Mar 1, 2021 Mar 1, 2021 Feb 25, 2022 Feb 28, 2023 Feb 27, 2024 Feb 27, 2025 Feb 26, 2026

Sign up to see institutional holdings

Sign Up

Podcast Mentions

Sign up to see podcast mentions and sentiment

Sign Up

parents with baby

New research reveals 70% of working parents feel they are “always on” because of child care related logistics and responsibilities

November 5, 2026 –  When reliable child care is unavailable or changes unexpectedly, working parents face more than a logistical challenge. They carry a significant cognitive load, devoting substantial mental energy to securing care, coordinating schedules, anticipating disruptions, and making difficult decisions that affect both their professional productivity and their family’s well-being. 

This anxiety-ridden challenge for working parents is the focus of the latest 2026 Modern Family Index (MFI) research wave, commissioned by Bright Horizons Family Solutions Inc. (NYSE: BFAM) and conducted by The Harris Poll. This new MFI research found 70% of working parents feel like they are “always on” because of child care related logistics and responsibilities.

In fact, a recent study from nonprofit Moms First echoes these findings, with 90% of surveyed parents said they have experienced a workforce disruption because of child care challenges, costing U.S. businesses as much as $70 billion annually through lost productivity, turnover, and absenteeism.

“Our research continues to show that working families carry a substantial mental load as they navigate their caregiving responsibilities, and that burden often follows them into the workplace,” said Stephen Kramer, CEO of Bright Horizons. “When families do not have access to reliable, consistent child care, they often spend significant time and energy coordinating arrangements, preparing backup plans, and managing the uncertainty that comes with caregiving responsibilities. Employers have an opportunity to address these challenges, which will help build a more resilient and thriving workforce.” 

The MFI research revealed the following challenges working parents face:

• 91% of working parents have handled at least one child care-related task during working hours
• 82% report at least one negative impact from managing child care-related logistics, most commonly (37%) having difficulty concentrating at work and/or at home 
• 87% say having at least one employer-provided benefit would likely reduce the time or mental energy they spend managing child care
• 77% say reliable child care is essential to their ability to succeed at work, including their ability to focus and remain productive

In addition,

• 66% often worry about potential disruptions to their child care plans 
• 70% feel like they are “always on” because of child care-related logistics and responsibilities
• 66% feel mentally exhausted managing child care logistics 

Recognizing that child care challenges can create a constant source of stress for working parents, employers like Target offer a variety of comprehensive family support solutions for their working parent employees. By offering these benefits, parents no longer need to spend significant mental energy making sure their children are cared for, safe, and supported, whether through on-site early education and care, in-home and center-based back-up care when unexpected needs arise, coverage during school breaks and holiday closures, or summer camps and school-age programs.

“Supporting working parents isn't just a family issue; it's a workforce strategy,” added Kramer.  “When employers provide meaningful child care resources that help reduce this burden, employees can be more present, engaged, loyal, and effective at work, enabling them to succeed both personally and professionally.”

To download the latest Bright Horizons Modern Family Index, click here .

Research Methodology

This survey was conducted online within the United States by The Harris Poll on behalf of Bright Horizons from September 22-23, 2026, among 696 employed U.S. adults ages 18 and older who are parents of kids under 18. Data were weighted where necessary by age, gender, race/ethnicity, region, education, marital status, household size, household income, and political party affiliation, to bring them in line with their actual proportions in the population. Respondents are selected among those who have agreed to participate in our surveys. The sampling precision of Harris online polls is measured by using a Bayesian credible interval. The sample data is accurate to within +/- 4.4 percentage points using a 95% confidence level. This credible interval will be wider among subsets of the surveyed population of interest. All sample surveys and polls, whether or not they use probability sampling, are subject to other multiple sources of error which are most often not possible to quantify or estimate, including, but not limited to coverage error, error associated with nonresponse, error associated with question wording and response options, and post-survey weighting and adjustments.
**
About Bright Horizons Family Solutions Inc.**

Bright Horizons® is a leading provider of high-quality early education and child care, back-up care, and workforce education services. For 40 years, we have partnered with employers to support workforces by providing services that help working families and employees thrive personally and professionally. Bright Horizons operates approximately 1,000 early education and child care centers in the United States, the United Kingdom, the Netherlands, Australia and India, and serves more than 1,450 of the world’s leading employers. Bright Horizons’ early education and child care centers, back-up child and elder care, and workforce education programs help employees succeed at each life and career stage. For more information, go to www.brighthorizons.com .

,* Modern Family Index


#### Our Solutions
for Parents

#### Our Solutions
for Employers

Bright Horizons Family Solutions

Brokers and Consultants

EdAssist by Bright Horizons

Workforce Consulting

#### More from
Bright Horizons

Our Solutions

for Parents

Our Solutions

for Employers

Bright Horizons Family Solutions

Brokers and Consultants

EdAssist by Bright Horizons

Workforce Consulting

More from

Bright Horizons

Connect with Bright Horizons

Find a Center Contact Support

© 2026 Bright Horizons Family Solutions. All Rights Reserved. | Privacy Notice | Cookie Notice | Acceptable Use Policy | Trademarks

October 29, 2026 at 4:18 PM EDT

PDF Version

NEWTON, Mass.--(BUSINESS WIRE)--Oct. 29, 2026-- Bright Horizons Family Solutions® Inc. (NYSE: BFAM) today announced financial results for the third quarter of 2026 and provided revised financial guidance for 2026. Bright Horizons is a leading provider of high-quality early education and child care, comprehensive back-up care solutions, and educational advisory services. Our offerings support both working families and employers’ workforce strategies by supporting their employees across life and career stages, and improving employee recruitment, engagement, productivity, retention, and career advancement.

Third Quarter 2026 Highlights (compared to Third Quarter 2025):

  • Revenue of $841 million (increase of 5%)

  • Loss from operations of $187 million

  • Net loss of $231 million and diluted loss per common share of $4.76

Non-GAAP financial measures

  • Adjusted EBITDA* of $163 million (increase of 5%)

  • Adjusted income from operations* of $130 million (increase of 5%)

  • Adjusted net income* of $88 million and diluted adjusted earnings per common share* of $1.80 (decrease of 3% and increase of 15%, respectively)

“Our third quarter results reflect the strength of our diversified portfolio, with revenue up 5%, including 13% growth in back-up care,” said Stephen Kramer, Chief Executive Officer. “This fall, we were proud to celebrate 40 years of partnering with leading employers to support working families. Our commitment to providing safe, nurturing environments and high-quality care and education for the children and families we serve has guided us since our start in 1986, and I am grateful to our global team, whose dedication brings that commitment to life every day.”

Third Quarter 2026 Results

Revenue increased by $38.7 million, or 5%, to $841.5 million in the third quarter of 2026 from the third quarter of 2025, primarily due to growth in back-up care, partially offset by the reductions in revenue from full service centers that have closed over the last 12 months.

Loss from operations was $187.1 million for the third quarter of 2026 compared to income from operations of $120.8 million for the third quarter of 2025. The decrease in income from operations is primarily related to impairment losses of $294.0 million within the international full service operations, partially offset by increased service levels and contributions from our back-up care segment. We had a net loss of $230.7 million for the third quarter of 2026 compared to net income of $78.6 million for the third quarter of 2025 due to the decrease in income from operations noted above, a higher effective tax rate and higher interest expense. Diluted loss per common share was $4.76 for the third quarter of 2026 compared to earnings per common share of $1.37 for the third quarter of 2025.

In the third quarter of 2026, adjusted EBITDA* increased by $7.2 million, or 5%, to $163.3 million, and adjusted income from operations* increased by $5.7 million, or 5%, to $130.2 million from the third quarter of 2025, primarily due to increased service levels and contributions from the back-up care segment. Adjusted net income* was $87.5 million, a decrease from adjusted net income of $90.1 million in the same period in the prior year, as a result of higher interest expense and an increase to the adjusted effective tax rate, partially offset by the increase in adjusted income from operations noted above. Diluted adjusted earnings per common share* was $1.80 for the third quarter of 2026 compared to $1.57 for the third quarter of 2025.

As of September 30, 2026, the Company operated 979 early education and child care centers with the capacity to serve approximately 112,500 children and their families.

*Adjusted EBITDA, adjusted income from operations, adjusted net income and diluted adjusted earnings per common share are financial measures that are not calculated in accordance with generally accepted accounting principles in the United States (“GAAP”), which are commonly referred to as “non-GAAP financial measures.” Adjusted EBITDA represents EBITDA (which is net income (loss), as determined in accordance with GAAP, before interest expense, income tax expense, depreciation, and amortization) adjusted to exclude stock-based compensation expense, impairment losses, incremental general liability expense, debt refinancing costs, lease termination costs, and, at times, other non-recurring costs, such as transaction costs. Adjusted income from operations represents income (loss) from operations, as determined in accordance with GAAP, adjusted to exclude impairment losses, incremental general liability expense, debt refinancing costs, lease termination costs, and, at times, other non-recurring costs, such as transaction costs. Adjusted net income represents net income (loss), as determined in accordance with GAAP, adjusted to exclude amortization, stock-based compensation expense, impairment losses, incremental general liability expense, debt refinancing costs, lease termination costs, interest related to pre-acquisition obligations, and, at times, other non-recurring costs, such as transaction costs, and the income tax provision (benefit) thereon. Diluted adjusted earnings per common share is calculated using adjusted net income. These non-GAAP financial measures are more fully described and are reconciled from the respective measures determined under GAAP in “Presentation of Non-GAAP Financial Measures” and the attached table “Bright Horizons Family Solutions Inc. Non-GAAP Reconciliations,” respectively.

Balance Sheet and Liquidity

At September 30, 2026, the Company had $119.2 million of cash and cash equivalents and $436.0 million available for borrowing under its revolving credit facility. In the nine months ended September 30, 2026, we generated $208.1 million of cash from operations, compared to $202.8 million for the same period in 2025, repurchased approximately 7.7 million shares totaling $557.7 million compared to approximately 0.9 million shares totaling $106.0 million for the same period in the prior year, and made net investments totaling $71.8 million, compared to $63.5 million for the same period in the prior year.

2026 Outlook

Based on current trends and expectations, we currently expect fiscal year 2026 revenue to be approximately $3.07 billion and diluted adjusted earnings per common share to be in the range of $4.98 to $5.03. The Company will provide additional information on its outlook during its earnings conference call.

Conference Call

Bright Horizons Family Solutions will host an investor conference call today at 5:00 pm ET to discuss the results for the third quarter of 2026, as well as the Company’s updated business outlook and strategy. Interested parties are invited to listen to the conference call by dialing 1-844-539-3703, or for international callers, 1-412-652-1273, and asking for the Bright Horizons Family Solutions conference call moderated by Chief Executive Officer Stephen Kramer. Replays of the entire call will be available through November 12, 2026 at 1-844-512-2921, or for international callers, at 1-412-317-6671, conference ID #13758194. A link to the audio webcast of the conference call and a copy of this press release are also available through the Investor Relations section of the Company’s web site, investors.brighthorizons.com.

Forward-Looking Statements

This press release includes forward looking statements within the meaning of Section 27A of the Securities Act of 1933, as amended, and Section 21E of the Securities Exchange Act of 1934, as amended. The Company’s actual results may vary significantly from the results anticipated in these forward-looking statements, which can generally be identified by the use of forward-looking terminology, including the terms “believes,” “expects,” “may,” “will,” “should,” “seeks,” “projects,” “approximately,” “intends,” “plans,” “estimates” or “anticipates,” or, in each case, their negatives or other variations or comparable terminology. These forward-looking statements include all matters that are not historical facts, including statements regarding the Company’s intentions, beliefs or current expectations concerning, among other things, our results of operations, financial condition, liquidity, operating expectations, execution and delivery of our services and solutions, our model, business trends, value and quality of our service offerings, our future growth opportunities, enrollment levels and trends in jurisdictions, utilization of services, margins, back-up care contributions, our investments, long-term growth strategy, cash flows, estimated effective tax rate, tax expense, our future business and financial performance, our client partners and relationships, use and impact of our services, our share repurchase activity and our 2026 financial guidance. By their nature, forward-looking statements involve risks and uncertainties because they relate to events and depend on circumstances that may or may not occur in the future. The Company believes that these risks and uncertainties include, but are not limited to, changes in the demand for child care, dependent care and other workplace solutions, including variations in enrollment trends and lower than expected demand from employer sponsor clients as well as variations in workforce demographics and work environments; the constrained labor market for teachers and staff and ability to hire and retain talent, including the impact of increased compensation and labor costs; the availability or lack of government support programs, and the impact of available government child care benefit programs; our ability to respond to changing client and customer needs; competition in our industry; the possibility that acquisitions may disrupt our operations and expose us to additional risk; our ability to pass on our increased costs; our ability to maintain applicable licenses and registrations in the jurisdictions in which we operate; our indebtedness and the terms of such indebtedness; our ability to withstand seasonal fluctuations in the demand for our services; our ability to implement our growth strategies successfully; our ability to close underperforming centers or exit lease arrangements; changes in general economic, political, business and financial market conditions and other macroeconomic events and uncertainty, including the impact of inflation and interest rate fluctuations; fluctuations in currency exchange rates; the effects of a cyber-attack, data breach or other security incident on our information technology system or software or those of our third party vendors; changes in tax rates or policies; damage or harm to our brand or reputation or negative public perception, including as a result of recent incidents and media coverage; outcome of legal matters, claims, allegations, actual or threatened litigation and regulatory investigations and reviews; insurance risks including self-insured risks and excess coverage; changes in laws and regulations; and other risks and uncertainties more fully described in the “Risk Factors” section of our Annual Report on Form 10-K filed on February 26, 2026, and other factors disclosed from time to time in our other filings with the Securities and Exchange Commission. These forward-looking statements speak only as of the time of this release and we do not undertake to publicly update or revise them, whether as a result of new information, future events or otherwise, except as required by law.

Presentation of Non-GAAP Financial Measures

In addition to the results provided in accordance with GAAP throughout this press release, the Company has provided certain non-GAAP financial measures that present operating results on a basis adjusted for certain items. The Company uses these non-GAAP financial measures as key performance indicators for the purpose of evaluating performance internally, and in connection with determining incentive compensation for Company management, including executive officers. Adjusted EBITDA is also used in connection with the determination of certain ratio requirements under our credit agreement. We believe that these non-GAAP financial measures provide investors with useful information with respect to our historical operations. These non-GAAP financial measures are not intended to replace, and should not be considered superior to, the presentation of our financial results in accordance with GAAP. The use of the terms adjusted EBITDA, adjusted income from operations, adjusted net income and diluted adjusted earnings per common share may differ from similar measures reported by other companies and may not be comparable to other similarly titled measures.

With respect to our outlook for diluted adjusted earnings per common share, we do not provide the most directly comparable GAAP financial measure or corresponding reconciliation to such GAAP financial measure on a forward-looking basis. We are unable to predict with reasonable certainty and without unreasonable effort certain items such as the timing and amount of net excess income tax benefits or shortfalls, future impairments, lease termination costs, transaction costs, and other non-recurring costs, as well as gains or losses from the early retirement of debt and the outcome from legal proceedings. These items are uncertain, depend on various factors outside our management’s control, and could significantly impact, either individually or in the aggregate, our future period earnings per common share as calculated and presented in accordance with GAAP.


teacher with sign

Annual award celebrates exceptional educators and their impact on children and families 

October 28, 2026 – Bright Horizons®, a leading global provider of high-quality early education and child care, back-up care, and workforce education services, today announced the 14 recipients of the Janice Hill Memorial Award. The annual award honors educators who consistently exceed expectations by creating meaningful learning experiences, building trusted partnerships with families, and strengthening their communities. This year’s recipients were selected from the dedicated classroom teachers who make a difference for children and families every day at Bright Horizons centers nationwide.  Nominated by the colleagues, families, and clients who see their impact firsthand, each winner represents the very best of Bright Horizons educators. 

The award honors the memory of Janice Hill, who taught at Bright Horizons Campbell Hill Child Care Center for 10 years and dedicated her life to children and families before she died of cancer in 1998. Her commitment to early education continues to inspire the award today. 

The educators recognized this year for going above and beyond for children, families, and their center communities are listed below. 

Winners: 

  • Marie B., Bright Horizons at Roseland
  • Najla M., Bright Horizons at Tysons Corner
  • Ikea W.****, Bright Horizons at All Saints'
  • Jennifer U., Bright Horizons at U of U Research Park
  • Saira N.****, Bright Horizons at Riverdale
  • Debra W.****, Bernice E. Lavin Early Childhood Education Center
  • Letiah M.****, Bright Horizons at the Prudential Center
  • Robin M.****, Cummins Child Development Center
  • Marjorie E.****, Bright Horizons Children's Center at The Forum
  • Jelisa M.****, Bright Horizons at Broad Street with School Age Enrichment
  • Olga M., Bright Horizons at Kirkland
  • Rocio Q., Bright Horizons Child Care Center at Comcast NBCUniversal
  • Carol M., Lamont-Doherty Child Development Center
  • Stacy R., Camp Amgen

Bright Horizons Educators 

Bright Horizons educators get to know each child as an individual and create learning experiences that reflect their interests and development. Through Discovery Driven Learning® and ongoing professional development, teachers support children’s growth while building trusted partnerships with families. This year’s Janice Hill Memorial Award recipients represent the commitment Bright Horizons educators bring to children and families across the country. 

About Bright Horizons Family Solutions Inc. 

Bright Horizons® is a leading provider of high-quality early education and child care, back-up care, and workforce education services. For 40 years, we have partnered with employers to support workforces by providing services that help working families and employees thrive personally and professionally. Bright Horizons operates approximately 1,000 early education and child care centers in the United States, the United Kingdom, the Netherlands, Australia and India, and serves more than 1,450 of the world’s leading employers. Bright Horizons’ early education and child care centers, back-up child and elder care, and workforce education programs help employees succeed at each life and career stage. For more information, go to www.brighthorizons.com . 

,* Bright Horizons News


#### Our Solutions
for Parents

#### Our Solutions
for Employers

Bright Horizons Family Solutions

Brokers and Consultants

EdAssist by Bright Horizons

Workforce Consulting

#### More from
Bright Horizons

Our Solutions

for Parents

Our Solutions

for Employers

Bright Horizons Family Solutions

Brokers and Consultants

EdAssist by Bright Horizons

Workforce Consulting

More from

Bright Horizons

Connect with Bright Horizons

Find a Center Contact Support

© 2026 Bright Horizons Family Solutions. All Rights Reserved. | Privacy Notice | Cookie Notice | Acceptable Use Policy | Trademarks

Prompts

Bright Horizons Family Solutions Inc. (ticker BFAM), listed in United States.

Company History

Date Change Detail
— Predecessor Predecessor Bright Horizons Family Solutions Inc (CIK 1060559) filed under its own registration; its figures are on its own company page, not shown here.

ETFs Holding Bright Horizons Family Solutions Inc.

ETF Weight in ETF Shares Market value As of
NBSM 0.96% 14,857 $ 1.102M Aug 31, 2026
DWSH short -0.93% -1,128 $ -57.291K Nov 17, 2026
FFOX 0.73% 24,850 $ 1.761M Jun 30, 2026
ABCS 0.39% 664 $ 49.256K Aug 31, 2026
GVLU 0.21% 10,310 $ 541.481K Nov 17, 2026
CDX short -0.18% -8,554.0744 $ -434.461K Nov 17, 2026
DFAT 0.13% 776,260 $ 40.979M Nov 12, 2026
AVSC 0.10% 61,651 $ 3.238M Nov 16, 2026
SMDX 0.09% 2,168 $ 113.863K Nov 17, 2026
MCDS 0.08% 127 $ 6,450.33 Nov 17, 2026
DFAS 0.06% 382,538 $ 20.194M Nov 12, 2026
IEDI 0.05% 202 $ 15.057K Jul 31, 2026
ENHU 0.03% 51 $ 2,678.52 Nov 16, 2026
JMEE 0.02% 12,067 $ 612.883K Nov 17, 2026
MSSM 0.02% 1,538 $ 114.089K Aug 31, 2026
DCOR 0.01% 59,442 $ 3.138M Nov 12, 2026
DFAC 0.01% 114,567 $ 6.048M Nov 12, 2026
DFSU 0.01% 2,374 $ 125.323K Nov 12, 2026
DXUV 0.00% 5,027 $ 265.375K Nov 12, 2026
DFAU 0.00% 7,263 $ 383.414K Nov 12, 2026
DFUS 0.00% 10,249 $ 541.045K Nov 12, 2026
EBI 0.00% 124 $ 9,198.32 Aug 31, 2026
AVSU 0.00% 7 $ 367.64 Nov 16, 2026
NTRL short 0.00% -853 $ 0.00 Nov 16, 2026